Home > Analyses > Consumer Cyclical > Darden Restaurants, Inc.
Darden Restaurants, Inc. transforms everyday dining experiences across the U.S. and Canada, serving millions through its diverse portfolio of full-service restaurants. As the industry leader behind iconic brands like Olive Garden and LongHorn Steakhouse, Darden is renowned for its innovation, quality, and operational excellence. Facing evolving consumer preferences and market dynamics, I examine whether Darden’s strong fundamentals and brand power continue to support its premium valuation and promising growth trajectory.

Table of contents
Business Model & Company Overview
Darden Restaurants, Inc., founded in 1968 and headquartered in Orlando, Florida, operates a vast network of 1,867 full-service restaurants across the United States and Canada. Its core business integrates multiple well-known brands such as Olive Garden and LongHorn Steakhouse into a cohesive ecosystem focused on delivering diverse dining experiences. This expansive portfolio allows Darden to cater to varied customer preferences, reinforcing its dominant position in the restaurant industry.
The company’s revenue engine balances direct restaurant operations with franchising, generating steady cash flow from both owned and franchised locations. Its presence spans key markets in North America, leveraging brand strength and operational efficiency to drive growth. Darden’s strategic scale and diversified brand portfolio create a robust economic moat, positioning it as a pivotal player shaping the future of casual dining.
Financial Performance & Fundamental Metrics
In this section, I analyze Darden Restaurants, Inc.’s income statement, key financial ratios, and dividend payout policy to assess its overall financial health and investment potential.
Income Statement
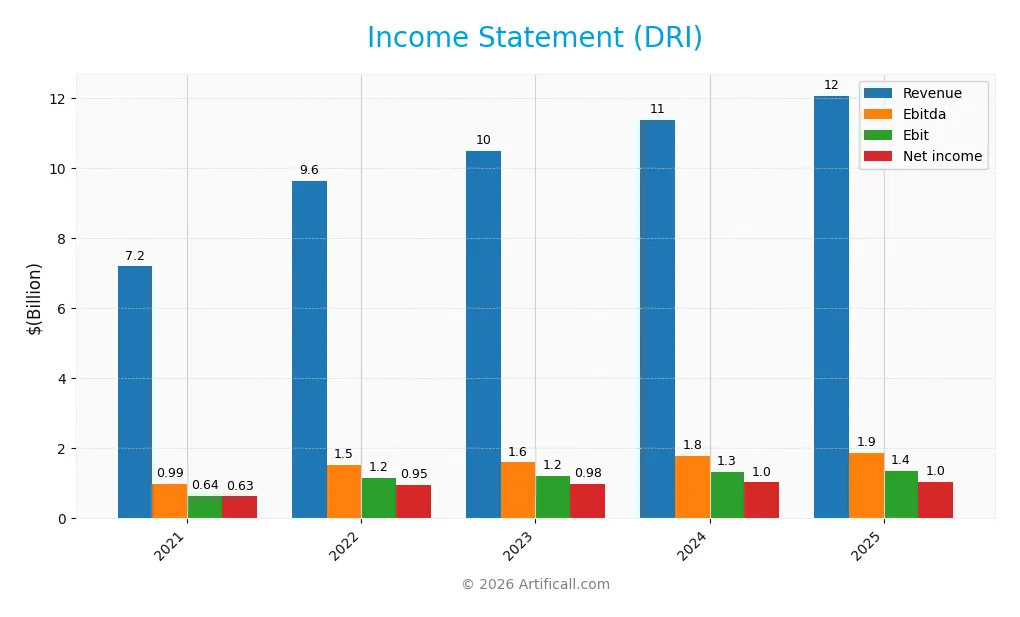
The table below summarizes Darden Restaurants, Inc.’s key income statement figures for fiscal years 2021 through 2025, showing revenue, expenses, profits, and earnings per share.
| 2021 | 2022 | 2023 | 2024 | 2025 | |
|---|---|---|---|---|---|
| Revenue | 7.20B | 9.63B | 10.49B | 11.39B | 12.08B |
| Cost of Revenue | 5.70B | 7.64B | 8.38B | 8.96B | 9.43B |
| Operating Expenses | 845M | 833M | 908M | 1.12B | 1.28B |
| Gross Profit | 1.49B | 2.00B | 2.11B | 2.43B | 2.64B |
| EBITDA | 993M | 1.53B | 1.60B | 1.78B | 1.88B |
| EBIT | 642M | 1.16B | 1.21B | 1.32B | 1.37B |
| Interest Expense | 66M | 73M | 85M | 140M | 180M |
| Net Income | 629M | 953M | 982M | 1.03B | 1.05B |
| EPS | 4.83 | 7.46 | 8.06 | 8.57 | 8.93 |
| Filing Date | 2021-07-23 | 2022-07-22 | 2023-06-01 | 2024-07-19 | 2025-07-18 |
Income Statement Evolution
From 2021 to 2025, Darden Restaurants, Inc. showed a steady revenue increase of 67.8%, reaching $12.1B in 2025. Net income grew by 66.8% over the period, totaling about $1.05B last year. Gross and EBIT margins remained favorable at 21.9% and 11.3%, respectively, although net margin slightly declined by 0.6%, indicating stable but slightly pressured profitability.
Is the Income Statement Favorable?
The 2025 income statement presents generally favorable fundamentals, with a gross profit growth of 8.6% and EBIT growth of 3.6%. Operating expenses grew in line with revenue, which is less favorable, and the net margin contracted by 3.7%. Despite this, interest expense remained low at 1.5%, and EPS increased by 4.1%, supporting an overall positive assessment of the company’s profitability and operational efficiency.
Financial Ratios
The table below presents key financial ratios for Darden Restaurants, Inc. (DRI) over the fiscal years 2021 to 2025, illustrating profitability, valuation, liquidity, leverage, and efficiency metrics:
| Ratios | 2021 | 2022 | 2023 | 2024 | 2025 |
|---|---|---|---|---|---|
| Net Margin | 8.7% | 9.9% | 9.4% | 9.0% | 8.7% |
| ROE | 22.4% | 43.3% | 44.6% | 45.8% | 45.4% |
| ROIC | 7.2% | 11.9% | 12.4% | 12.1% | 11.4% |
| P/E | 29.7 | 16.9 | 19.7 | 17.2 | 22.8 |
| P/B | 6.6 | 7.3 | 8.8 | 7.9 | 10.4 |
| Current Ratio | 1.01 | 0.64 | 0.51 | 0.38 | 0.42 |
| Quick Ratio | 0.91 | 0.49 | 0.37 | 0.24 | 0.28 |
| D/E | 2.05 | 2.22 | 2.18 | 2.42 | 2.70 |
| Debt-to-Assets | 54.0% | 48.2% | 46.8% | 47.9% | 49.5% |
| Interest Coverage | 9.8 | 15.9 | 14.1 | 9.4 | 7.6 |
| Asset Turnover | 0.68 | 0.95 | 1.02 | 1.01 | 0.96 |
| Fixed Asset Turnover | 1.08 | 1.41 | 1.48 | 1.50 | 1.46 |
| Dividend Yield | 1.1% | 3.5% | 3.1% | 3.6% | 2.7% |
Evolution of Financial Ratios
Darden Restaurants’ Return on Equity (ROE) showed strong improvement, climbing from 22.37% in 2021 to 45.41% in 2025, indicating enhanced profitability. However, liquidity ratios such as the Current Ratio declined significantly, dropping from 1.01 to 0.42, reflecting tighter short-term financial flexibility. The Debt-to-Equity Ratio increased to 2.7 in 2025, signaling higher leverage compared to previous years.
Are the Financial Ratios Favorable?
In 2025, profitability ratios like ROE (45.41%) and Return on Invested Capital (11.4%) were favorable, supported by a solid interest coverage ratio of 7.57. Liquidity ratios, including Current (0.42) and Quick (0.28), were unfavorable, suggesting potential short-term liquidity risks. Market valuation metrics presented a mixed picture: Price-to-Earnings was neutral at 22.84, while Price-to-Book was unfavorable at 10.37. Overall, the financial ratios were slightly favorable, balancing strengths in profitability against concerns in liquidity and leverage.
Shareholder Return Policy
Darden Restaurants, Inc. maintains a consistent dividend payout ratio around 60-63%, with dividends per share rising steadily to 5.60 USD in FY2025 and an annual yield near 2.75%. The dividend payments are well covered by free cash flow, supporting sustainable distributions alongside controlled capital expenditures.
The company also engages in share buybacks, complementing its dividend strategy. This balanced approach to shareholder returns, combining reliable dividends and buybacks with strong cash flow coverage, appears aligned with long-term shareholder value preservation and financial prudence.
Score analysis
The following radar chart presents a comprehensive view of Darden Restaurants, Inc.’s key financial scores across valuation, profitability, and leverage metrics:
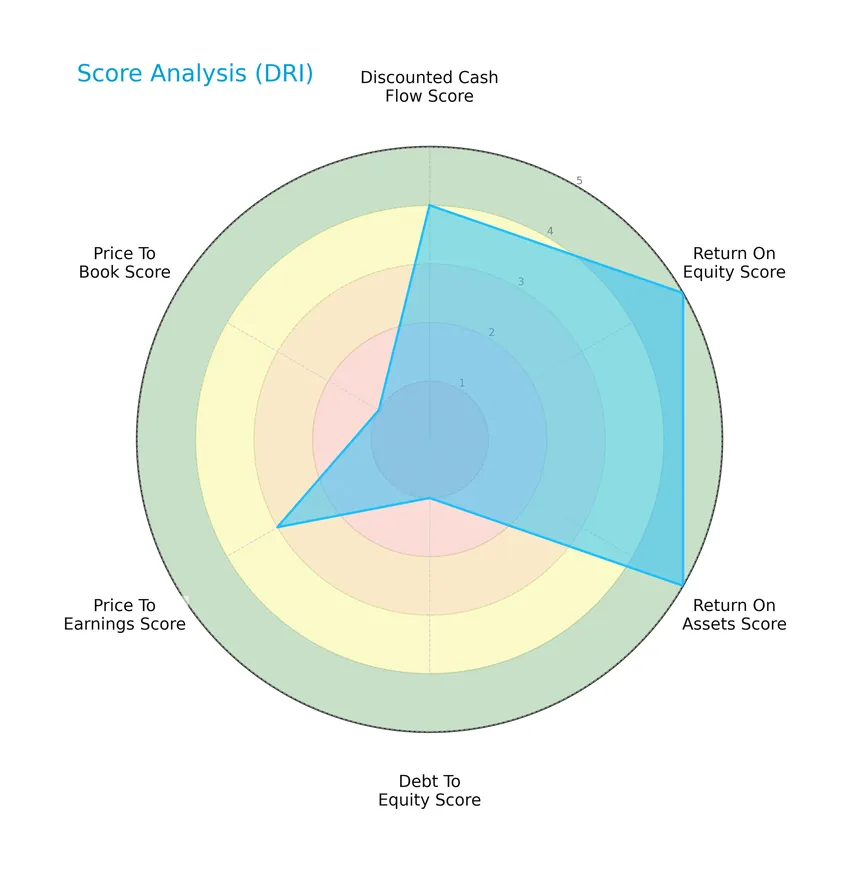
Darden Restaurants shows strong profitability with top scores in return on equity (5) and return on assets (5). The discounted cash flow score is favorable at 4, while valuation scores like price to earnings (3) are moderate. However, leverage indicators such as debt to equity (1) and price to book (1) reflect notable weaknesses.
Analysis of the company’s bankruptcy risk
The Altman Z-Score places Darden Restaurants in the grey zone, indicating a moderate risk of financial distress and potential bankruptcy:

Is the company in good financial health?
The Piotroski Score diagram offers insight into the company’s financial strength based on nine key criteria:

With a score of 7, Darden Restaurants is considered financially strong, reflecting solid profitability, efficiency, and moderate leverage, which supports its overall financial stability.
Competitive Landscape & Sector Positioning
This sector analysis will explore Darden Restaurants, Inc.’s strategic positioning, revenue by segment, key products, main competitors, competitive advantages, and SWOT analysis. I will assess whether Darden Restaurants holds a competitive advantage within the restaurants industry.
Strategic Positioning
Darden Restaurants, Inc. operates a diversified portfolio within the U.S. and Canada, owning 1,867 restaurants across multiple brands including Olive Garden, LongHorn Steakhouse, and fine dining. Its revenue is primarily concentrated in casual dining, with Olive Garden generating 5.2B USD and LongHorn Steakhouse 3B USD in FY 2025, complemented by a growing fine dining segment at 1.3B USD.
Revenue by Segment
This pie chart illustrates the revenue distribution of Darden Restaurants, Inc. by its main segments for the fiscal year 2025.
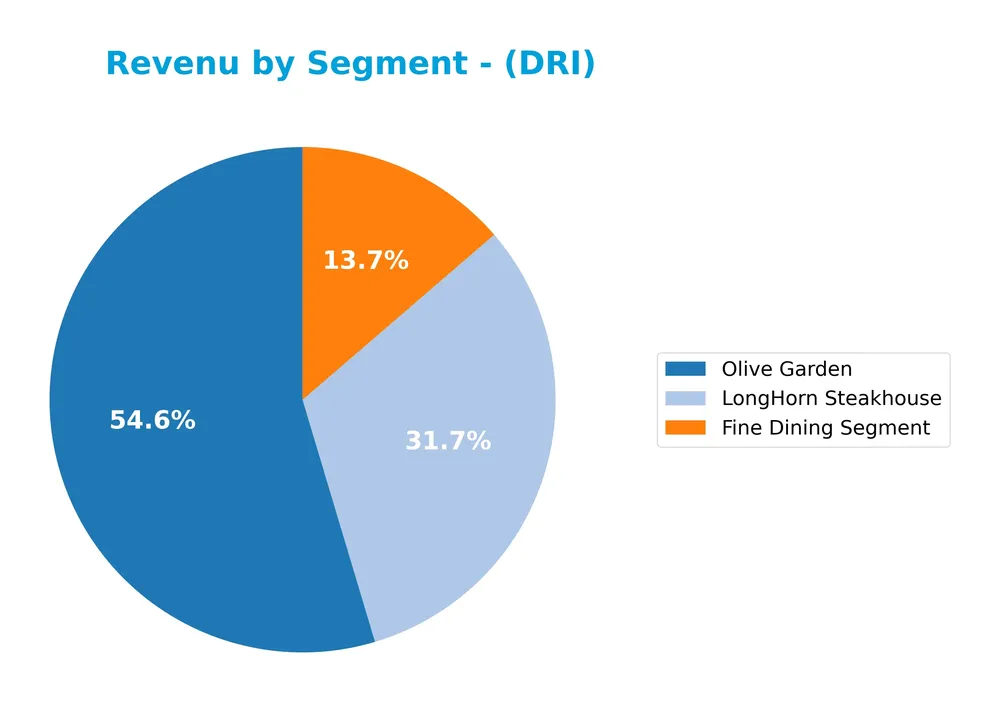
In 2025, Olive Garden remains the dominant revenue driver with $5.21B, showing steady growth since 2024. LongHorn Steakhouse also contributes significantly at $3.03B, continuing its upward trend. The Fine Dining Segment, while smaller at $1.30B, has shown consistent improvement. The concentration is clear in these three segments, with Olive Garden and LongHorn leading, reflecting a stable and focused portfolio with moderate growth across major segments.
Key Products & Brands
The following table summarizes Darden Restaurants, Inc.’s key products and brands with their descriptions:
| Product | Description |
|---|---|
| Olive Garden | Full-service casual dining restaurants, largest brand with over 900 locations (including franchised). |
| LongHorn Steakhouse | Full-service casual dining steakhouses with over 560 locations (including franchised). |
| Fine Dining Segment | Includes upscale dining brands such as The Capital Grille, Eddie V’s Prime Seafood, Seasons 52, Yard House, Bahama Breeze, and Capital Burger. |
| Cheddar’s Scratch Kitchen | Casual dining brand with 172 locations, offering made-from-scratch American cuisine. |
| Other Segments | Comprises various smaller brands and operations outside the main Olive Garden, LongHorn, and Fine Dining segments. |
Darden Restaurants operates a diversified portfolio of full-service dining brands across the U.S. and Canada, with Olive Garden and LongHorn Steakhouse as the primary revenue drivers, complemented by a growing fine dining segment.
Main Competitors
There are 6 main competitors in the Restaurants industry, with the table listing the top 10 leaders by market capitalization:
| Competitor | Market Cap. |
|---|---|
| McDonald’s Corporation | 217B |
| Starbucks Corporation | 95.5B |
| Chipotle Mexican Grill, Inc. | 50.6B |
| Yum! Brands, Inc. | 41.8B |
| Darden Restaurants, Inc. | 21.8B |
| Domino’s Pizza, Inc. | 14.4B |
Darden Restaurants ranks 5th among its competitors, with a market cap at 11.07% of the sector leader, McDonald’s. It is positioned below both the average market cap of the top 10 competitors (73.5B) and the sector median (46.2B). The company has a significant 74.23% gap to the next competitor above, indicating a notable scale difference within this competitive landscape.
Comparisons with competitors
Check out how we compare the company to its competitors:
Does Darden Restaurants have a competitive advantage?
Darden Restaurants presents a clear competitive advantage, demonstrated by a very favorable moat status with a ROIC exceeding WACC by 5.25% and a strong upward ROIC trend of 58%. This indicates efficient capital use and durable value creation.
Looking ahead, Darden’s extensive portfolio of 1,867 restaurants across multiple brands in the US and Canada provides opportunities for expansion and market penetration. Continued growth in profitability and operational improvements suggest potential for sustained competitive positioning.
SWOT Analysis
This SWOT analysis provides a clear overview of Darden Restaurants, Inc.’s current strategic position to assist investors in making informed decisions.
Strengths
- strong market presence with 1,867 restaurants
- favorable profitability metrics (ROE 45.41%, EBIT margin 11.31%)
- durable competitive advantage with growing ROIC
Weaknesses
- high debt-to-equity ratio (2.7)
- weak liquidity ratios (current ratio 0.42, quick ratio 0.28)
- unfavorable price-to-book ratio (10.37)
Opportunities
- expansion into new markets and brand diversification
- leverage favorable consumer trends in dining out
- potential to improve operational efficiency and margin growth
Threats
- economic downturn affecting consumer spending
- intense competition in the restaurant industry
- rising costs impacting operating expenses and net margin
Overall, Darden Restaurants exhibits solid strengths in profitability and market position but faces financial structure and liquidity challenges. Strategic focus should balance growth opportunities with prudent risk management around debt levels and cost control.
Stock Price Action Analysis
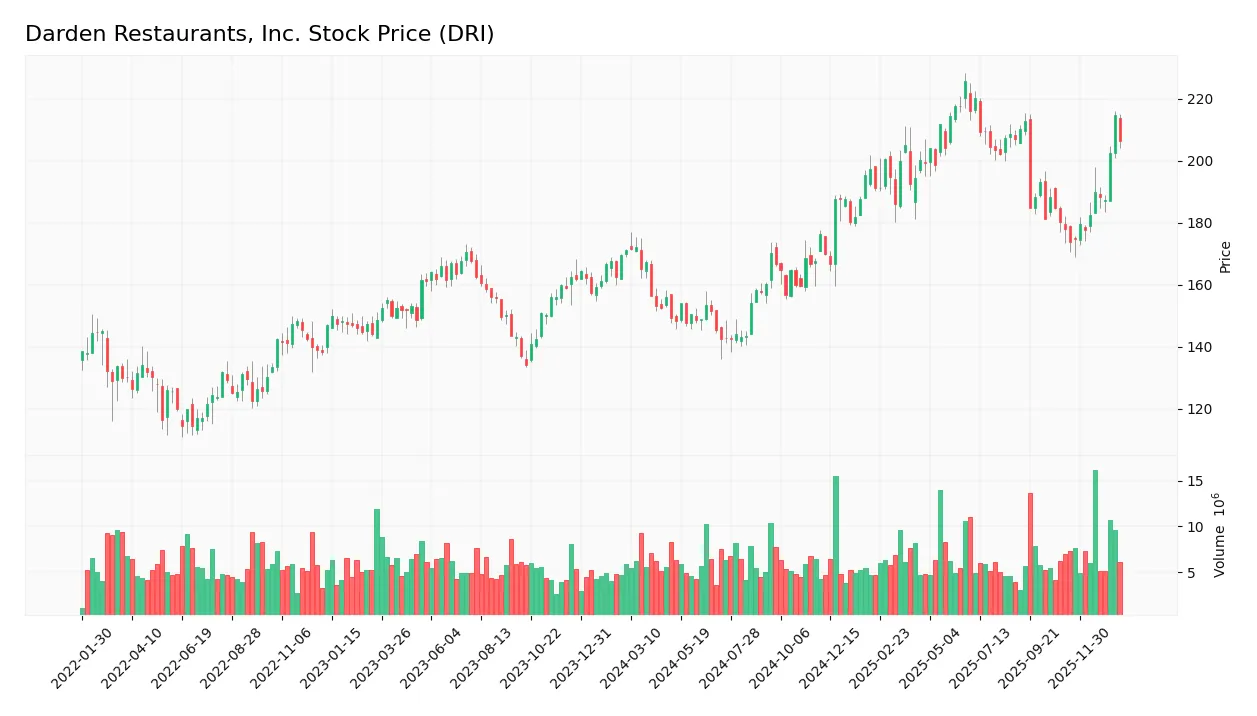
The weekly stock chart for Darden Restaurants, Inc. (DRI) highlights price movements over the last 12 months with notable volatility and trend acceleration:
Trend Analysis
Over the past year, DRI’s stock price increased by 20.36%, indicating a bullish trend with accelerating momentum. The price ranged between a low of 142.27 and a high of 225.78, with a standard deviation of 22.72 reflecting significant volatility during this period.
Volume Analysis
Trading volume over the last three months shows an increasing trend with buyer volume at 55.21% overall and rising to 59.24% recently. This slight buyer dominance suggests growing investor interest and positive market participation for DRI shares.
Target Prices
Analysts present a solid target price consensus for Darden Restaurants, Inc. (DRI).
| Target High | Target Low | Consensus |
|---|---|---|
| 265 | 200 | 221.94 |
The target prices suggest moderate upside potential, with a consensus around 222, indicating cautious optimism among analysts.

Don’t Let Luck Decide Your Entry Point
Optimize your entry points with our advanced ProRealTime indicators. You’ll get efficient buy signals with precise price targets for maximum performance. Start outperforming now!
Analyst & Consumer Opinions
This section reviews the latest analyst ratings and consumer feedback regarding Darden Restaurants, Inc. (DRI).
Stock Grades
Here is a summary of the latest stock grades from recognized financial institutions for Darden Restaurants, Inc.:
| Grading Company | Action | New Grade | Date |
|---|---|---|---|
| Mizuho | Upgrade | Outperform | 2026-01-23 |
| Raymond James | Downgrade | Market Perform | 2026-01-21 |
| Truist Securities | Downgrade | Hold | 2026-01-08 |
| Barclays | Maintain | Overweight | 2026-01-07 |
| BMO Capital | Maintain | Market Perform | 2026-01-06 |
| Mizuho | Maintain | Neutral | 2025-12-22 |
| BTIG | Maintain | Buy | 2025-12-19 |
| Stephens & Co. | Maintain | Equal Weight | 2025-12-19 |
| Guggenheim | Maintain | Buy | 2025-12-17 |
| Jefferies | Maintain | Hold | 2025-12-15 |
The recent grading trend shows a mix of slight downgrades and stable outlooks, with notable upgrades by Mizuho contrasting downgrades from Raymond James and Truist Securities, reflecting varied analyst perspectives on the stock’s near-term performance.
Consumer Opinions
Consumers of Darden Restaurants, Inc. (DRI) have shared a mix of praise and constructive criticism, reflecting a balanced view of their dining experiences.
| Positive Reviews | Negative Reviews |
|---|---|
| Consistently friendly and attentive staff | Occasional delays during peak hours |
| High-quality, fresh ingredients | Some menu items perceived as overpriced |
| Comfortable and inviting restaurant ambiance | Limited vegetarian and vegan options |
| Wide variety of classic American dishes | Inconsistent portion sizes across different locations |
| Reliable loyalty program benefits | Noise levels can be high during busy times |
Overall, consumer feedback highlights Darden’s strengths in customer service and food quality, while noting areas for improvement in menu diversity and service speed during busy periods.
Risk Analysis
Below is a table summarizing the key risks associated with investing in Darden Restaurants, Inc., highlighting their likelihood and potential impact:
| Category | Description | Probability | Impact |
|---|---|---|---|
| Financial Leverage | High debt-to-equity ratio (2.7) increases financial risk and interest burden | High | High |
| Liquidity | Low current ratio (0.42) and quick ratio (0.28) indicate liquidity issues | Medium | Medium |
| Valuation | Elevated price-to-book ratio (10.37) may signal overvaluation | Medium | Medium |
| Market Sensitivity | Beta of 0.636 suggests lower volatility but exposure to economic cycles | Low | Medium |
| Operational Risk | Dependence on full-service restaurant model amid changing consumer trends | Medium | High |
The most pressing risks stem from Darden’s high leverage and weak liquidity ratios, which could strain financial flexibility during economic downturns. However, its strong return on equity (45.41%) and favorable interest coverage (7.57) help mitigate default risk. Investors should closely monitor debt levels and market conditions impacting the restaurant sector.
Should You Buy Darden Restaurants, Inc.?
Darden Restaurants, Inc. appears to be delivering robust profitability with a durable competitive moat reflected in growing ROIC surpassing WACC, yet its leverage profile could be seen as substantial. Despite some mixed valuation signals, the overall B+ rating suggests a very favorable profile.
Strength & Efficiency Pillars
Darden Restaurants, Inc. exhibits robust profitability and value creation metrics, underscored by a return on equity (ROE) of 45.41% and a return on invested capital (ROIC) of 11.4%, comfortably exceeding its weighted average cost of capital (WACC) at 6.15%. This positions DRI as a clear value creator with a durable competitive advantage and growing profitability. Financial health indicators are mixed but solid, with a Piotroski score of 7 reflecting strong fundamentals, although the Altman Z-Score of 2.5 places the company in the grey zone, suggesting moderate bankruptcy risk.
Weaknesses and Drawbacks
Despite favorable profitability, DRI faces several headwinds. The company’s valuation presents risks, with a price-to-book ratio of 10.37 considered very unfavorable, indicating potentially stretched market pricing relative to book value. Leverage is a concern as well, with a high debt-to-equity ratio of 2.7 and low liquidity ratios (current ratio at 0.42, quick ratio at 0.28), which may pressure financial flexibility. These factors combined could weigh on investor sentiment, although recent trading shows buyer dominance mitigating short-term market pressures.
Our Verdict about Darden Restaurants, Inc.
DRI’s long-term fundamental profile appears favorable, supported by strong profitability and value creation. The bullish overall stock trend, coupled with recent buyer dominance at 59.24%, suggests positive market momentum. Given these dynamics, the company’s profile may appear attractive for long-term exposure, though investors should remain mindful of valuation and leverage risks that could introduce volatility or limit upside in the near term.
Disclaimer: This content is for informational purposes only and does not constitute financial, investment, or other professional advice. Investing in financial markets involves a significant risk of loss, and past performance is not indicative of future results.
Additional Resources
- Darden Restaurants, Inc. $DRI Shares Acquired by TrueMark Investments LLC – MarketBeat (Jan 24, 2026)
- Darden Restaurants attracts an upgrade from Mizuho on Olive Garden strength – MSN (Jan 23, 2026)
- Darden Restaurants Inc (NYSE:DRI) Passes the “Caviar Cruise” Quality Investing Screen – Chartmill (Jan 19, 2026)
- Darden Restaurants (DRI) Shares Rise Following Analyst Upgrades – GuruFocus (Jan 23, 2026)
- Darden restaurants’ Wilkerson sells $480k in shares – Investing.com (Jan 21, 2026)
For more information about Darden Restaurants, Inc., please visit the official website: darden.com