Home > Analyses > Technology > D-Wave Quantum Inc.
D-Wave Quantum Inc. transforms complex problems into quantum solutions that impact industries from finance to life sciences. Its fifth-generation Advantage quantum computer and cloud-based Leap service set a new standard in quantum computing accessibility and innovation. Known for pioneering hybrid solvers and developer tools, D-Wave pushes the boundaries of technology. As quantum computing gains commercial traction, I ask: does D-Wave’s current valuation reflect its growth potential and execution risks?

Table of contents
Business Model & Company Overview
D-Wave Quantum Inc., founded in Canada and headquartered in Burnaby, stands as a pioneer in quantum computing systems. The company delivers an integrated ecosystem of hardware, software, and services, including its fifth-generation Advantage quantum computer and cloud-based Leap platform. This suite supports cutting-edge applications across AI, drug discovery, and financial modeling, positioning D-Wave at the forefront of the computer hardware industry.
D-Wave generates revenue by blending sales of advanced quantum machines with recurring software subscriptions and professional services like D-Wave Launch. Its global reach spans the Americas, Europe, and Asia, serving sectors from manufacturing to cybersecurity. The company’s competitive advantage lies in its proprietary technology and developer community, creating a durable economic moat as quantum computing reshapes technology’s future.
Financial Performance & Fundamental Metrics
I analyze D-Wave Quantum Inc.’s income statement, key financial ratios, and dividend payout policy to assess its core financial health and shareholder value.
Income Statement
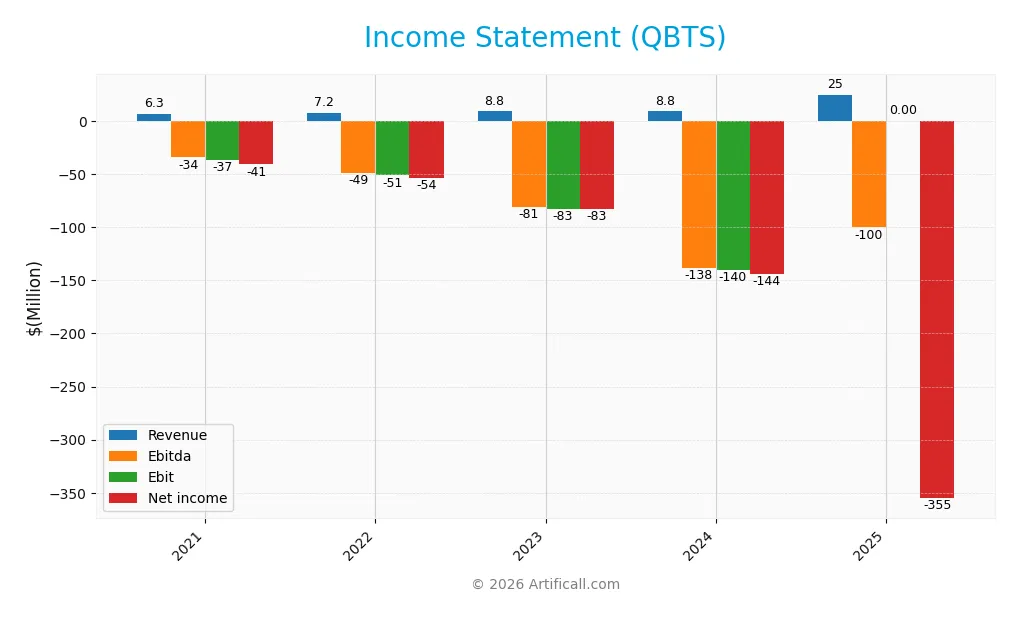
The table below summarizes D-Wave Quantum Inc.’s income statement from 2021 to 2025, showing key profitability and expense metrics in USD.
| 2021 | 2022 | 2023 | 2024 | 2025 | |
|---|---|---|---|---|---|
| Revenue | 6.28M | 7.17M | 8.76M | 8.83M | 24.59M |
| Cost of Revenue | 1.75M | 2.92M | 4.14M | 3.26M | 4.28M |
| Operating Expenses | 43.48M | 63.71M | 85.17M | 82.79M | 120.67M |
| Gross Profit | 4.53M | 4.25M | 4.62M | 5.56M | 20.31M |
| EBITDA | -34.36M | -49.03M | -80.83M | -138.05M | -100.37M |
| EBIT | -36.96M | -51.37M | -82.68M | -139.98M | 0 |
| Interest Expense | 4.01M | 2.34M | 2.16M | 3.90M | -4.01M |
| Net Income | -40.97M | -53.70M | -82.72M | -143.88M | -355.06M |
| EPS | -0.33 | -0.45 | -0.60 | -0.75 | -1.11 |
| Filing Date | 2021-12-31 | 2023-04-18 | 2024-03-29 | 2025-03-14 | 2026-02-26 |
Income Statement Evolution
D-Wave Quantum’s revenue surged from 6.3M in 2021 to 24.6M in 2025, a 292% increase. Gross profit grew proportionally, boosting gross margin to a favorable 82.6%. Operating expenses also rose sharply, keeping EBIT at break-even in 2025 but margins overall remain pressured due to high costs and losses.
Is the Income Statement Favorable?
In 2025, fundamentals show mixed signals. Revenue growth accelerated 179% year-over-year, and gross margin improved to 82.6%, reflecting operational efficiency. However, net margin remains deeply negative at -1444%, with net income losses widening to -355M. Interest expense is favorable relative to revenue, but net losses and negative EPS growth highlight ongoing profitability challenges.
Financial Ratios
The table below presents key financial ratios for D-Wave Quantum Inc. (QBTS) over the last five fiscal years:
| Ratios | 2021 | 2022 | 2023 | 2024 | 2025 |
|---|---|---|---|---|---|
| Net Margin | -6.53% | -7.49% | -9.44% | -16.30% | -14.44% |
| ROE | 2.23% | 1.82% | 3.38% | -229.67% | -41.66% |
| ROIC | -1.84% | -4.04% | -1.61% | -45.01% | -11.20% |
| P/E | -30.04 | -3.21 | -1.47 | -11.22 | -23.66 |
| P/B | -67.06 | -5.85 | -4.96 | 25.76 | 9.86 |
| Current Ratio | 1.53 | 0.87 | 4.18 | 6.14 | 42.38 |
| Quick Ratio | 1.33 | 0.73 | 4.00 | 6.08 | 42.25 |
| D/E | -2.15 | -1.44 | -2.97 | 0.61 | 0.01 |
| Debt-to-Assets | 1.34 | 1.57 | 1.22 | 0.19 | 0.01 |
| Interest Coverage | -9.71 | -25.46 | -37.38 | -19.82 | 25.01 |
| Asset Turnover | 0.21 | 0.27 | 0.15 | 0.04 | 0.03 |
| Fixed Asset Turnover | 0.53 | 0.63 | 0.81 | 0.77 | 1.71 |
| Dividend Yield | 0% | 0% | 0% | 0% | 0% |
Evolution of Financial Ratios
Return on Equity (ROE) declined sharply to -41.7% in 2025, signaling deteriorating profitability. The Current Ratio surged to 42.4, reflecting a significant increase in liquidity. Debt-to-Equity Ratio dropped to a minimal 0.01, showing reduced leverage. Overall, profitability weakened while liquidity and debt levels shifted markedly over the period.
Are the Financial Ratios Favorable?
In 2025, profitability ratios such as net margin (-1444%) and ROE (-41.7%) were unfavorable, indicating ongoing losses. Liquidity was mixed: a very high Current Ratio (42.4) is unusual and flagged as unfavorable, while the Quick Ratio was favorable. Leverage ratios including debt-to-equity (0.01) and debt-to-assets (0.83%) were favorable. Asset turnover was low (0.03), and market valuation ratios were mostly unfavorable, resulting in an overall unfavorable assessment.
Shareholder Return Policy
D-Wave Quantum Inc. (QBTS) does not pay dividends, reflecting its ongoing net losses and reinvestment focus. The company’s strategy emphasizes growth and R&D, consistent with its negative profit margins and substantial cash reserves per share.
QBTS does not engage in share buybacks either, which aligns with its prioritization of capital preservation over shareholder distributions. This approach supports sustainable long-term value creation given the firm’s current financial position and growth phase.
Score analysis
Here is a radar chart illustrating key financial scores for D-Wave Quantum Inc., providing a snapshot of valuation and profitability metrics:
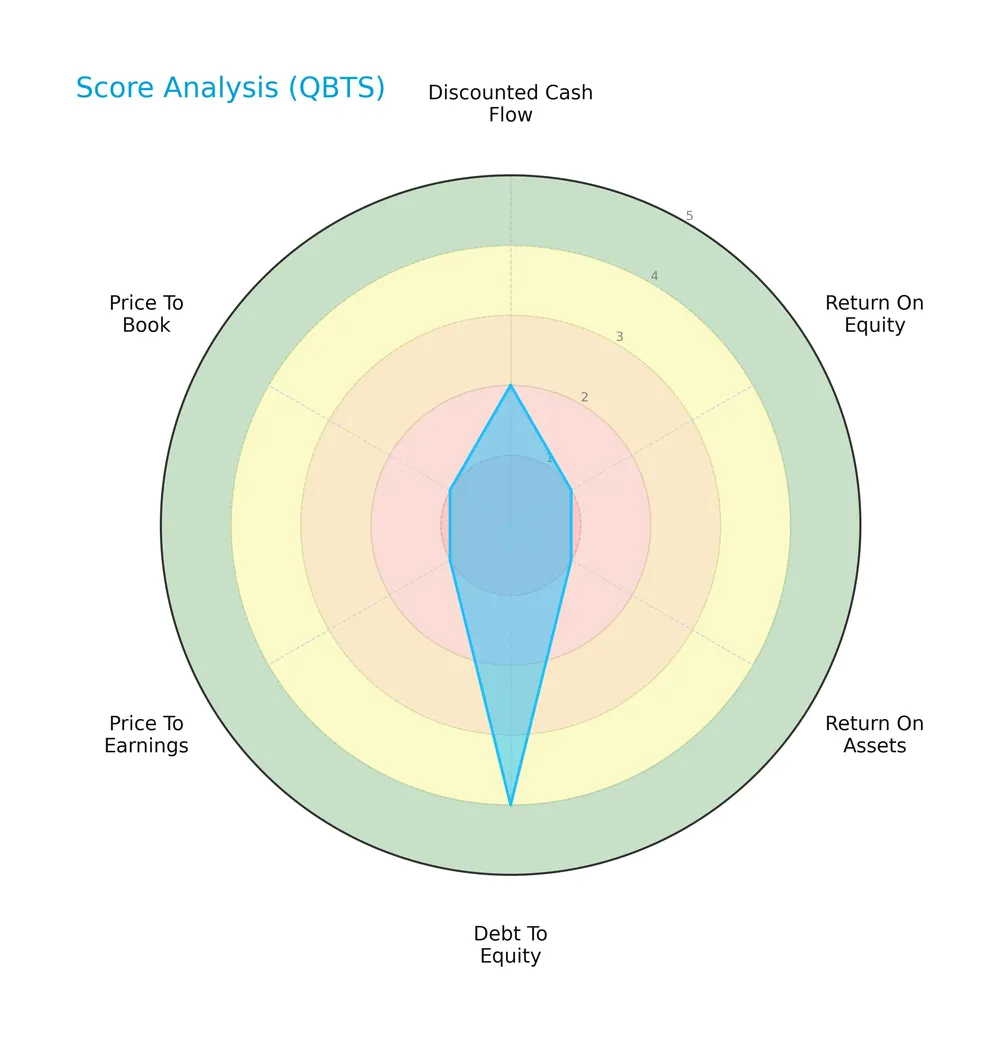
The scores reveal a mixed profile: discounted cash flow and overall scores are unfavorable at 2, while return on equity and assets are very unfavorable at 1 each. Debt-to-equity stands out favorably at 4, but valuation multiples like price-to-earnings and price-to-book remain very unfavorable at 1.
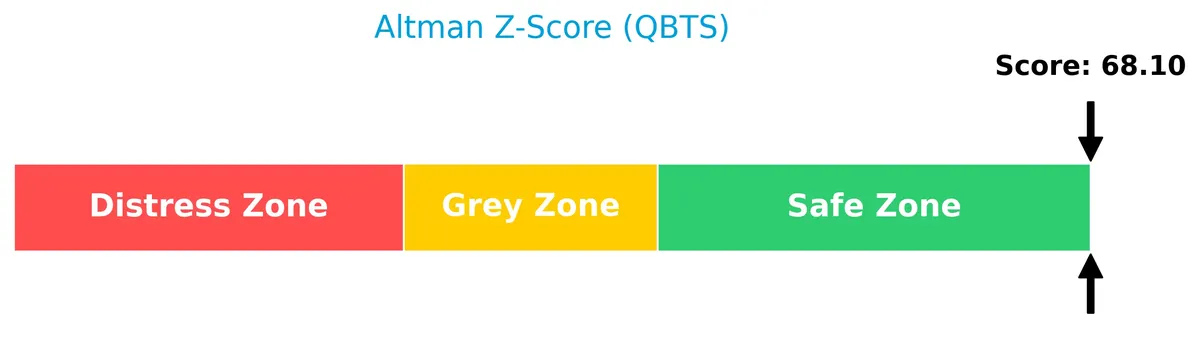
Analysis of the company’s bankruptcy risk
The Altman Z-Score places the company firmly in the safe zone, indicating a very low risk of bankruptcy based on key financial ratios:
Is the company in good financial health?
This Piotroski diagram displays the company’s financial strength based on profitability, leverage, liquidity, and efficiency criteria:
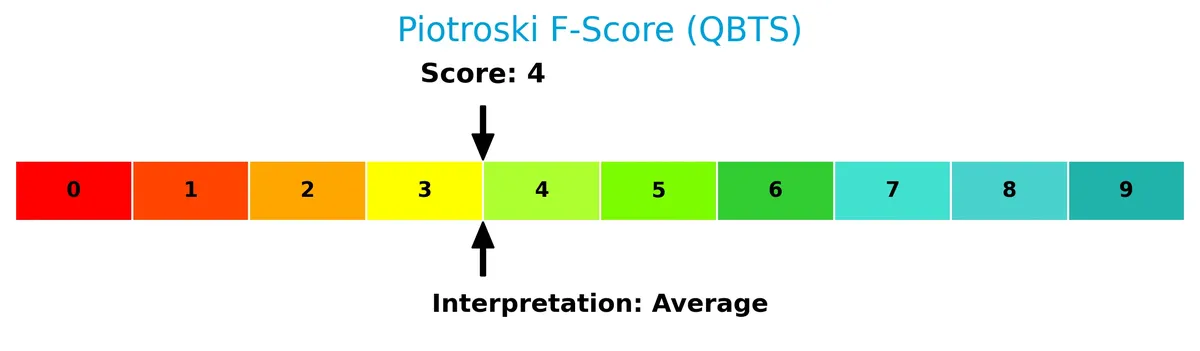
With a Piotroski Score of 4, D-Wave Quantum Inc. falls into the average category, suggesting moderate financial health but leaving room for improvement to reach stronger investment quality.
Competitive Landscape & Sector Positioning
This section analyzes D-Wave Quantum Inc.’s strategic positioning, revenue breakdown, key products, competitors, and SWOT. I will assess whether the company holds a competitive advantage over its peers.
Strategic Positioning
D-Wave Quantum concentrates revenue in system sales and professional services, with system sales reaching $16.2M in 2025. Geographically, it diversifies across North America, Europe, and Asia, with Germany generating $16.8M, signaling a strategic focus on key global tech markets.
Revenue by Segment
This pie chart illustrates D-Wave Quantum Inc.’s revenue distribution by segment for fiscal year 2025, highlighting the relative contribution of system sales, professional services, and other products.
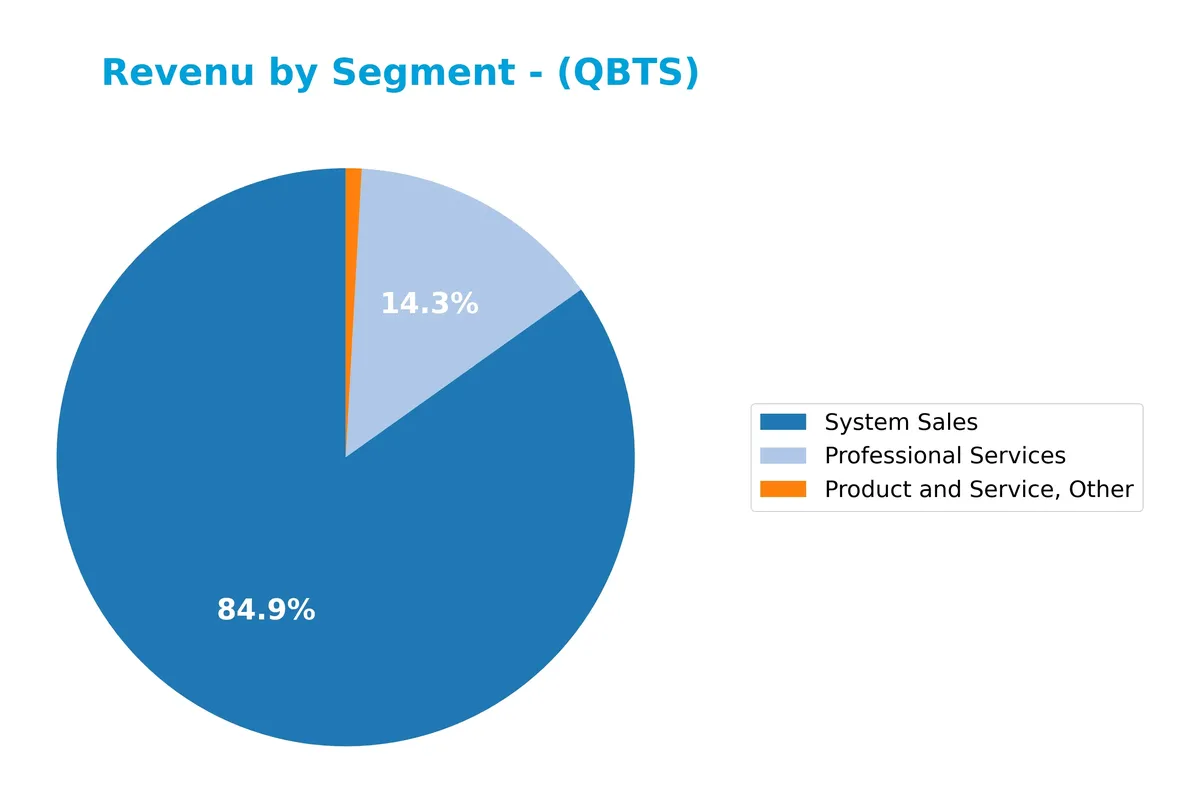
In 2025, system sales dominate with $16.2M, driving the bulk of revenue growth. Professional services contribute $2.7M, showing steady recovery since 2023’s dip. The “Product and Service, Other” segment remains a minor but growing part, reaching $168K. The addition of system sales data in 2025 reveals a crucial revenue shift, emphasizing hardware as the company’s core value driver.
Key Products & Brands
The following table outlines D-Wave Quantum Inc.’s main products and services with concise descriptions:
| Product | Description |
|---|---|
| Advantage | Fifth-generation quantum computer delivering advanced quantum processing capabilities. |
| Leap | Cloud service providing real-time access to live quantum computers, hybrid solvers, and developer tools. |
| Ocean | Open-source suite of programming tools for quantum computing application development. |
| Launch | Quantum onboarding service guiding enterprises from problem discovery to application deployment. |
| D-Wave Launch | Professional quantum service supporting enterprises through in-production quantum application deployment. |
D-Wave Quantum Inc. focuses on quantum computing hardware, cloud services, software development tools, and professional services. These offerings support industries from AI to financial modeling, reflecting a comprehensive quantum technology ecosystem.
Main Competitors
The sector includes 12 competitors; below is a table of the top 10 leaders by market capitalization:
| Competitor | Market Cap. |
|---|---|
| Arista Networks, Inc. | 168B |
| Dell Technologies Inc. | 86B |
| Western Digital Corporation | 65B |
| Seagate Technology Holdings plc | 61B |
| Pure Storage, Inc. | 22B |
| NetApp, Inc. | 21B |
| HP Inc. | 21B |
| Super Micro Computer, Inc. | 18B |
| IonQ, Inc. | 16B |
| D-Wave Quantum Inc. | 9.1B |
D-Wave Quantum Inc. ranks 10th among 12 competitors, with a market cap at 4.39% of the leader, Arista Networks. The company is below both the average market cap of the top 10 (48.7B) and the sector median (21B). It has a 115% market cap gap to its next closest competitor above, IonQ, highlighting a significant scale difference.
Comparisons with competitors
Check out how we compare the company to its competitors:
Does D-Wave Quantum Inc. have a competitive advantage?
D-Wave Quantum Inc. shows a slightly unfavorable competitive advantage, with ROIC below WACC indicating value destruction despite growing profitability. Its gross margin of 82.6% reflects strong product-level efficiency, yet net margins remain deeply negative.
The company’s future outlook includes expanding quantum computing solutions like Advantage and Leap cloud services. Growth in artificial intelligence and materials science markets offers opportunities to improve returns and capture wider adoption across industries.
SWOT Analysis
This analysis distills D-Wave Quantum Inc.’s key internal and external factors shaping its strategic outlook.
Strengths
- Leading-edge quantum computing technology
- Strong revenue growth trajectory
- Low debt levels enhance financial flexibility
Weaknesses
- Negative net margin signals ongoing losses
- ROIC below WACC indicates value destruction
- High price-to-book ratio suggests overvaluation risk
Opportunities
- Expanding applications in AI and drug discovery
- Growing global demand for quantum solutions
- Potential strategic partnerships in financial services
Threats
- Intense competition in quantum hardware space
- High R&D costs pressure profitability
- Market adoption still in nascent stage
D-Wave’s strengths in innovation and revenue growth position it well for future gains. However, persistent losses and value destruction urge cautious capital allocation. The company must leverage growth opportunities while mitigating competitive and market risks.
Stock Price Action Analysis
The weekly chart depicts D-Wave Quantum Inc.’s stock price movement over the last 100 weeks, highlighting key highs and lows:
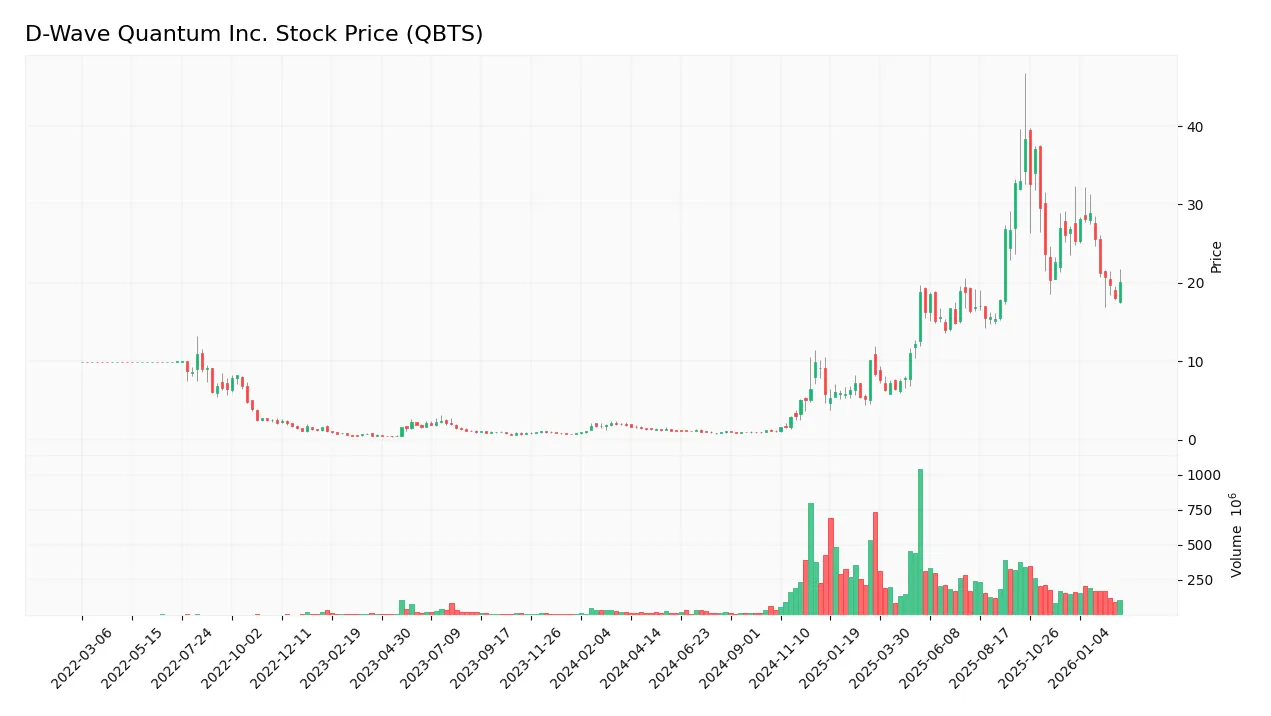
Trend Analysis
Over the past 12 months, QBTS surged 971.28%, marking a strong bullish trend despite deceleration. The stock peaked at 38.33 and bottomed at 0.84. Recent three-month data show a -22.84% drop, signaling short-term weakness with mild volatility (3.67 std. dev.).
Volume Analysis
Total trading volume stands at 19.55B shares, with buyer activity slightly dominant at 54.46%. Volume has increased overall, indicating rising market participation. However, recent months reveal seller dominance (67.67%), reflecting cautious or negative investor sentiment.
Target Prices
Analysts set a clear target consensus for D-Wave Quantum Inc., reflecting moderate upside potential.
| Target Low | Target High | Consensus |
|---|---|---|
| 35 | 46 | 41 |
The target range from 35 to 46 signals cautious optimism, with a consensus price of 41 showing analysts expect steady growth ahead.

Don’t Let Luck Decide Your Entry Point
Optimize your entry points with our advanced ProRealTime indicators. You’ll get efficient buy signals with precise price targets for maximum performance. Start outperforming now!
Analyst & Consumer Opinions
This section examines the latest analyst ratings and consumer feedback regarding D-Wave Quantum Inc. (QBTS).
Stock Grades
Here are the latest verified analyst grades on D-Wave Quantum Inc. from leading financial firms:
| Grading Company | Action | New Grade | Date |
|---|---|---|---|
| Needham | Maintain | Buy | 2026-02-26 |
| Needham | Maintain | Buy | 2026-01-29 |
| Rosenblatt | Maintain | Buy | 2026-01-28 |
| Benchmark | Maintain | Buy | 2026-01-23 |
| Needham | Maintain | Buy | 2026-01-22 |
| Rosenblatt | Maintain | Buy | 2026-01-08 |
| Rosenblatt | Maintain | Buy | 2026-01-07 |
| Benchmark | Maintain | Buy | 2025-11-10 |
| Canaccord Genuity | Maintain | Buy | 2025-11-07 |
| Cantor Fitzgerald | Maintain | Overweight | 2025-11-07 |
The consensus strongly favors a Buy rating, with all analysts maintaining positive outlooks. No downgrades or Holds appear, reflecting consistent confidence in the stock.
Consumer Opinions
D-Wave Quantum Inc. inspires mixed reactions from its user base, reflecting both excitement and concern about its quantum computing technology.
| Positive Reviews | Negative Reviews |
|---|---|
| “Innovative technology with promising potential.” | “High cost limits accessibility.” |
| “Strong customer support and technical guidance.” | “Steep learning curve for new users.” |
| “Reliable performance improvements over time.” | “Limited software ecosystem compared to competitors.” |
Overall, consumers appreciate D-Wave’s cutting-edge innovation and support but often cite pricing and complexity as barriers. The technology’s promise is clear, though adoption challenges remain.
Risk Analysis
Below is a summary of key risks associated with D-Wave Quantum Inc., highlighting their likelihood and potential impact:
| Category | Description | Probability | Impact |
|---|---|---|---|
| Financial Health | Extremely negative net margin (-1444%) and ROE (-41.66%) signal ongoing losses. | High | High |
| Market Volatility | Beta of 1.57 indicates stock price swings exceed market average, raising trading risk. | High | Medium |
| Liquidity | Unusually high current ratio (42.38) suggests inefficient use of liquidity, potentially masking operational issues. | Medium | Medium |
| Debt & Leverage | Low debt-to-equity (0.01) reduces default risk but may limit growth opportunities. | Low | Low |
| Valuation Metrics | Price-to-book ratio near 10 signals possible overvaluation risking correction. | Medium | Medium |
| Profitability | Negative ROIC (-11.2%) below WACC (10.97%) implies value destruction. | High | High |
| Operational Risk | Minimal asset turnover (0.03) questions revenue generation efficiency. | Medium | Medium |
The most pressing concerns lie in D-Wave’s sustained heavy losses and poor returns on invested capital. Despite a strong Altman Z-score indicating low bankruptcy risk, the firm’s fundamentals reflect a high operating risk. Its volatile stock and elevated valuation amplify potential downside, demanding cautious risk management.
Should You Buy D-Wave Quantum Inc.?
D-Wave Quantum Inc. appears to be shedding value despite a growing ROIC trend, suggesting improving operational efficiency amid a slightly unfavorable moat. Supported by a manageable leverage profile but very weak profitability, the overall rating could be seen as a cautious C.
Strength & Efficiency Pillars
D-Wave Quantum Inc. reports a robust gross margin of 82.59%, reflecting strong operational efficiency. The company’s revenue surged 178.54% in the last year, signaling rapid top-line growth. Despite this, the net margin remains deeply negative at -1444.1%, and ROIC stands at -11.2%, well below its WACC of 10.97%. This indicates the company is not a value creator and is currently shedding value. However, its debt-to-equity ratio is minimal at 0.01, evidencing conservative leverage management.
Weaknesses and Drawbacks
The Altman Z-Score of 68.1 places D-Wave firmly in the safe zone, so financial distress is not an immediate concern. Yet, serious weaknesses persist. The net margin of -1444.1% and return on equity of -41.66% highlight ongoing profitability struggles. Valuation metrics are mixed: a negative P/E ratio (-23.66) suggests losses, while a high P/B ratio of 9.86 points to an expensive stock relative to book value. The current ratio of 42.38, though unusually high, may indicate inefficient asset utilization. Recent seller dominance (67.67% buyers) adds short-term market pressure.
Our Final Verdict about D-Wave Quantum Inc.
D-Wave Quantum Inc. presents a complex profile with rapid growth but weak profitability and value destruction. The strong Altman Z-Score reassures about solvency, yet recent market selling pressure and stretched valuation suggest caution. Despite long-term growth potential, the current financial and market signals might warrant a wait-and-see approach for a better entry point. This profile may appear attractive to risk-tolerant investors intrigued by quantum computing’s promise but remains speculative.
Disclaimer: This content is for informational purposes only and does not constitute financial, investment, or other professional advice. Investing in financial markets involves a significant risk of loss, and past performance is not indicative of future results.
Additional Resources
- D-Wave Quantum Stock Rises on Earnings. Why a Revenue Miss Doesn’t Seem to Matter. – Barron’s (Feb 26, 2026)
- D-Wave Reports Fourth Quarter and Year-End 2025 Results – Yahoo Finance (Feb 26, 2026)
- D-Wave Quantum’s Q4 revenue rises 19% Y/Y, misses estimates – Seeking Alpha (Feb 26, 2026)
- QBTS Stock Q4 Earnings Tomorrow – Here’s What to Expect – TipRanks (Feb 25, 2026)
- Assessing D‑Wave Quantum (QBTS) Valuation After Strong Long Term Returns And Recent Share Price Pressure – Yahoo Finance (Feb 26, 2026)
For more information about D-Wave Quantum Inc., please visit the official website: dwavesys.com