Home > Analyses > Consumer Cyclical > D.R. Horton, Inc.
D.R. Horton, Inc. shapes the American residential landscape by delivering quality homes that define neighborhoods across 31 states. As the largest homebuilder in the U.S., it stands out for its diverse portfolio—from single-family houses to multifamily rentals—and its integrated services, including mortgage financing and title insurance. Known for innovation and market influence, D.R. Horton consistently adapts to changing housing demands. The key question now is whether its strong fundamentals continue to support attractive growth and justify its market valuation.

Table of contents
Business Model & Company Overview
D.R. Horton, Inc., founded in 1978 and headquartered in Arlington, Texas, stands as a dominant player in the U.S. residential construction industry. Operating across 31 states and 98 markets, it offers a cohesive ecosystem of homebuilding solutions—from single-family detached homes to townhomes and multi-family rentals—under well-known brands like America’s Builder and Freedom Homes. This broad reach positions the company at the core of America’s housing market.
The company’s revenue engine is fueled by a balanced mix of land acquisition, home construction, mortgage financing, and title services. It also manages non-residential real estate and energy assets, enhancing diversification. With a strong presence spanning the Americas, the company’s integrated approach creates a durable economic moat, shaping the future landscape of residential development.
Financial Performance & Fundamental Metrics
I will analyze D.R. Horton, Inc.’s income statement, key financial ratios, and dividend payout policy to provide a clear view of its financial health and performance.
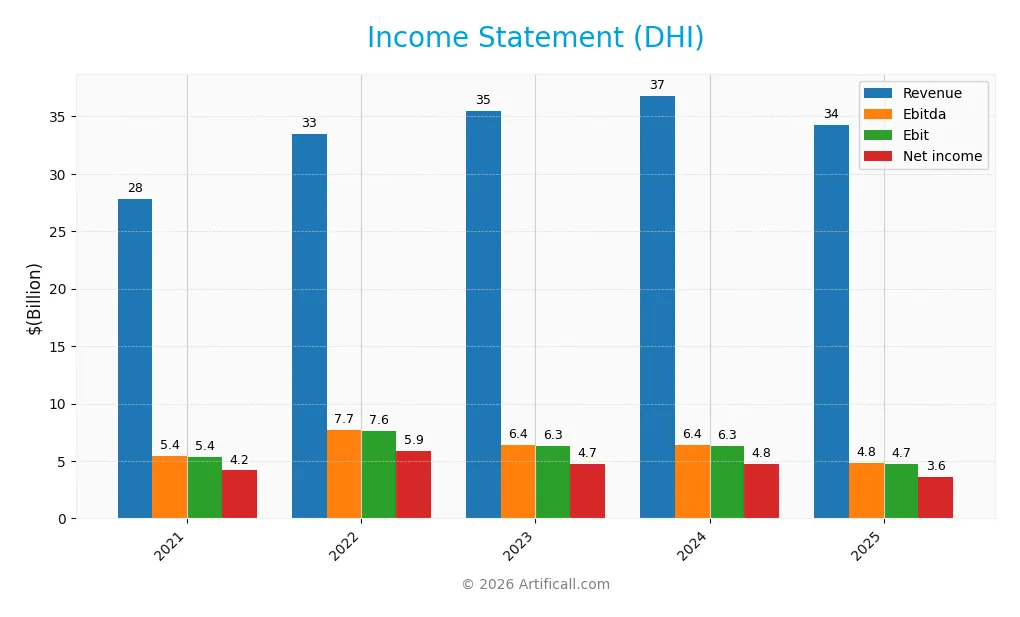
Income Statement
The table below summarizes D.R. Horton, Inc.’s key financial results for fiscal years 2021 through 2025, expressed in USD.
| 2021 | 2022 | 2023 | 2024 | 2025 | |
|---|---|---|---|---|---|
| Revenue | 27.77B | 33.48B | 35.46B | 36.80B | 34.25B |
| Cost of Revenue | 19.90B | 22.98B | 26.11B | 27.27B | 26.13B |
| Operating Expenses | 2.48B | 2.80B | 3.11B | 3.42B | 3.69B |
| Gross Profit | 7.88B | 10.50B | 9.35B | 9.54B | 8.12B |
| EBITDA | 5.43B | 7.71B | 6.41B | 6.37B | 4.84B |
| EBIT | 5.36B | 7.63B | 6.31B | 6.28B | 4.74B |
| Interest Expense | 0 | 0 | 0 | 0 | 0 |
| Net Income | 4.18B | 5.86B | 4.75B | 4.76B | 3.59B |
| EPS | 11.56 | 16.65 | 13.93 | 14.44 | 11.62 |
| Filing Date | 2021-11-18 | 2022-11-18 | 2023-11-17 | 2024-11-19 | 2025-11-19 |
Income Statement Evolution
From 2021 to 2025, D.R. Horton, Inc. experienced a 23.3% increase in revenue, signaling overall growth. However, net income declined by 14.1% over the same period, with net margin contracting by 30.4%. The most recent year saw a revenue drop of 6.9%, accompanied by a sharper net income decline of 19.0%, reflecting pressure on profitability and margin compression.
Is the Income Statement Favorable?
The 2025 income statement shows a gross margin of 23.7% and an EBIT margin of 13.8%, both classified as favorable, with no interest expense burden. However, the year-over-year decreases in revenue, gross profit, EBIT, net margin, and EPS indicate operational challenges. The global evaluation rates the income statement as unfavorable due to the predominance of negative growth metrics despite some maintained margin strengths.
Financial Ratios
The following table presents key financial ratios for D.R. Horton, Inc. over the last five fiscal years, illustrating the company’s profitability, valuation, liquidity, leverage, and efficiency metrics:
| Ratios | 2021 | 2022 | 2023 | 2024 | 2025 |
|---|---|---|---|---|---|
| Net Margin | 15% | 17% | 13% | 13% | 10% |
| ROE | 28% | 30% | 21% | 19% | 15% |
| ROIC | 19% | 21% | 15% | 13% | 10% |
| P/E | 7.3 | 4.0 | 7.7 | 13.2 | 14.6 |
| P/B | 2.04 | 1.22 | 1.61 | 2.48 | 2.16 |
| Current Ratio | 12.9 | 13.1 | 15.0 | 17.1 | 17.4 |
| Quick Ratio | 3.7 | 3.3 | 4.2 | 4.8 | 4.5 |
| D/E | 0.37 | 0.32 | 0.23 | 0.24 | 0.25 |
| Debt-to-Assets | 23% | 20% | 16% | 17% | 17% |
| Interest Coverage | 0 | 0 | 0 | 0 | 0 |
| Asset Turnover | 1.16 | 1.10 | 1.09 | 1.02 | 0.97 |
| Fixed Asset Turnover | 242 | 232 | 549 | 526 | 399 |
| Dividend Yield | 0.95% | 1.34% | 0.93% | 0.63% | 0.95% |
Evolution of Financial Ratios
From 2021 to 2025, D.R. Horton, Inc. saw a decline in Return on Equity (ROE) from 28.05% to 14.82%, indicating a slowdown in profitability. The Current Ratio improved significantly, rising from 12.87 in 2021 to 17.39 in 2025, showing increased liquidity. Meanwhile, the Debt-to-Equity Ratio decreased from 0.37 to 0.25, reflecting reduced leverage over the period.
Are the Financial Ratios Favorable?
In 2025, profitability ratios such as net margin (10.47%) were favorable, while ROE and ROIC were neutral, reflecting cautious earnings efficiency. Liquidity showed mixed signals: the quick ratio was favorable at 4.51, but the very high current ratio of 17.39 was unfavorable, possibly indicating excess current assets. Leverage ratios, including debt-to-equity at 0.25 and debt-to-assets at 17%, were favorable. Market valuation metrics showed a favorable P/E of 14.58 but an unfavorable dividend yield below 1%. Overall, the ratios suggest a slightly favorable financial standing.
Shareholder Return Policy
D.R. Horton, Inc. maintains a consistent dividend policy with a payout ratio rising from 7% in 2021 to 14% in 2025, supported by free cash flow coverage near 96%. Dividend yield remains below 1%, while share buybacks are not explicitly reported.
This measured distribution approach, with dividends covered by cash flow and moderate payout ratios, suggests a balanced strategy aimed at sustainable shareholder value creation, avoiding excessive repurchases or unsustainable payouts.
Score analysis
The radar chart below displays key financial metric scores for D.R. Horton, Inc., highlighting various aspects of its financial performance and valuation:
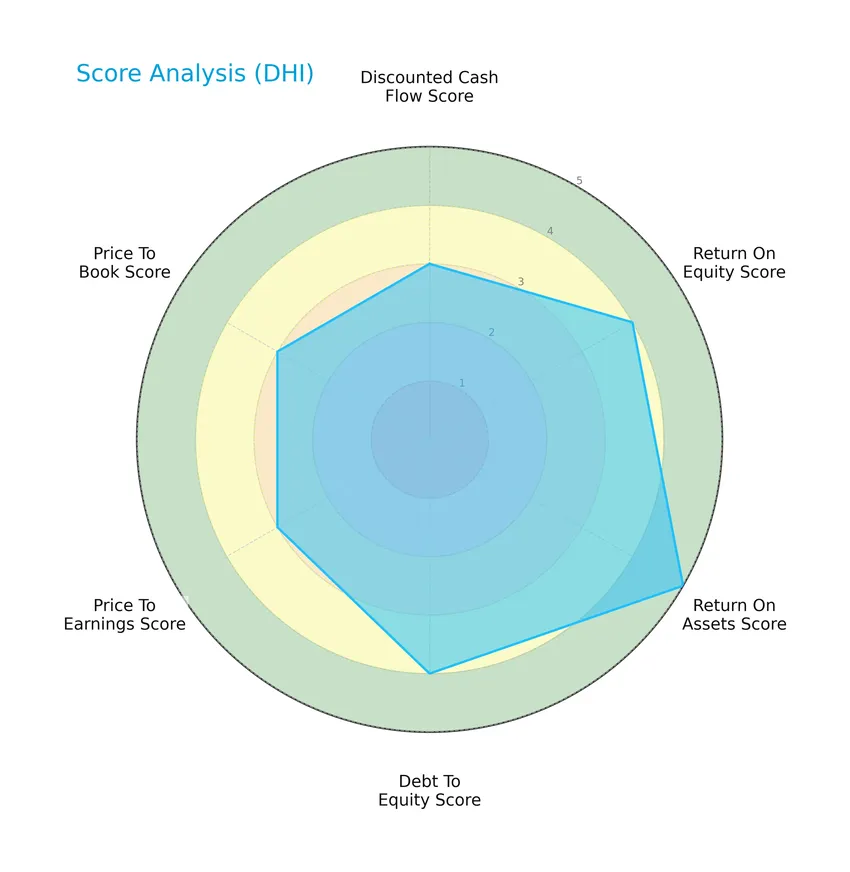
D.R. Horton demonstrates very favorable return on assets (5) and favorable return on equity (4) and debt-to-equity (4) scores. Discounted cash flow, price-to-earnings, and price-to-book scores are moderate at 3, indicating balanced valuation metrics alongside solid operational efficiency.
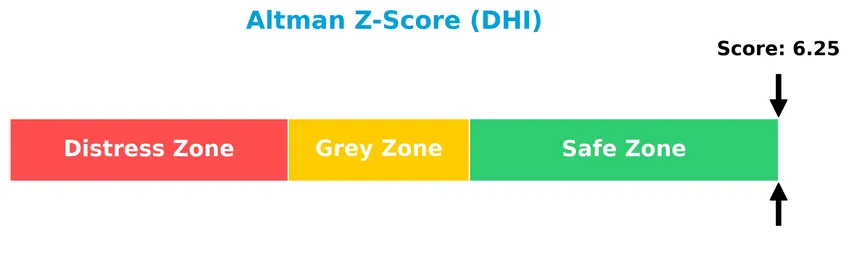
Analysis of the company’s bankruptcy risk
The Altman Z-Score indicates that D.R. Horton is in the safe zone, reflecting a low bankruptcy risk and strong financial stability:
Is the company in good financial health?
The Piotroski score diagram provides insight into the company’s financial strength based on profitability, leverage, liquidity, and efficiency:

With a Piotroski score of 5 categorized as average, D.R. Horton shows moderate financial health. This suggests some strengths in fundamentals but also room for improvement relative to stronger scoring companies.
Competitive Landscape & Sector Positioning
This sector analysis will explore D.R. Horton, Inc.’s strategic positioning, revenue by segment, key products, main competitors, competitive advantages, and SWOT analysis. I will assess whether the company holds a competitive advantage over its industry peers.
Strategic Positioning
D.R. Horton, Inc. maintains a diversified product portfolio primarily focused on homebuilding, supplemented by rental, financial services, and land development segments. Geographically, it operates across six major U.S. regions, generating balanced revenue streams with no single market dominating, reflecting broad national exposure.
Revenue by Segment
This pie chart illustrates D.R. Horton, Inc.’s revenue distribution by business segment for the fiscal year 2025, highlighting key contributors to the company’s total income.
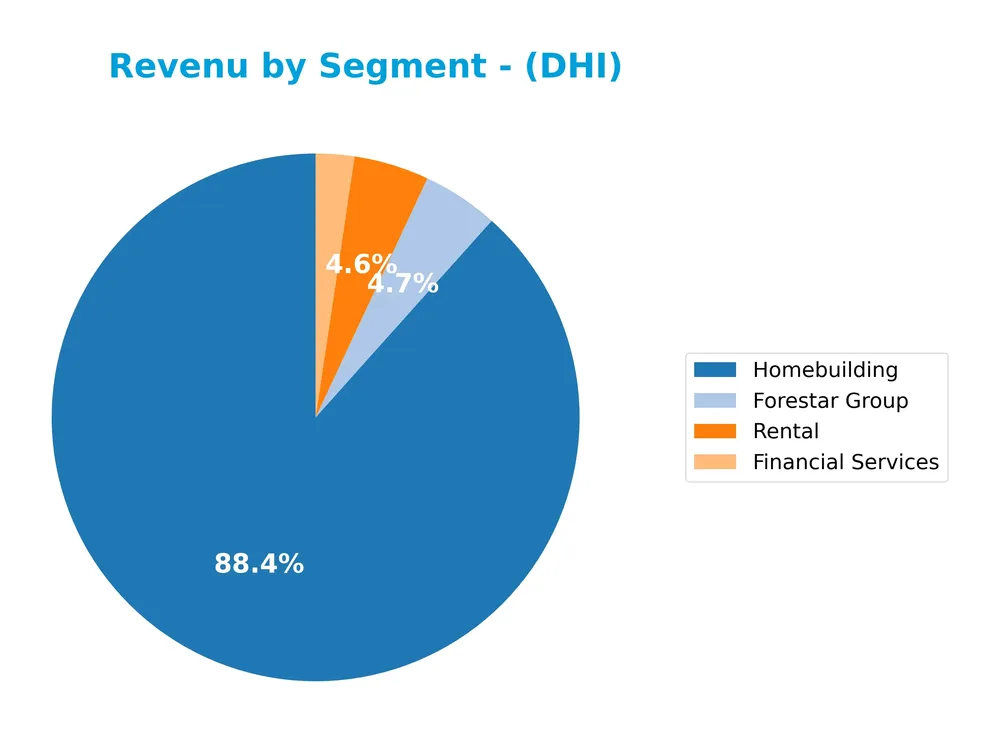
In 2025, Homebuilding remains the dominant revenue driver at 31.5B, reflecting its core business strength despite a slight decline from 33.96B in 2024. Other segments like Forestar Group and Rental contribute modestly with 1.66B and 1.64B respectively, while Financial Services generated 841M. The segment Eliminations and Other showed a negative value of -1.36B, indicating internal adjustments. Overall, revenue concentration in Homebuilding continues to pose a risk, with recent years showing some slowdown in this key segment.
Key Products & Brands
The table below details D.R. Horton, Inc.’s key products and brands along with their descriptions:
| Product | Description |
|---|---|
| D.R. Horton, America’s Builder | Residential homebuilding brand operating across 31 states and 98 markets in the US. |
| Express Homes | Brand under which D.R. Horton constructs and sells a variety of residential homes. |
| Emerald Homes | Residential homebuilding brand focusing on single-family detached and attached homes. |
| Freedom Homes | Another brand name used by D.R. Horton for home construction and sales in multiple US regions. |
| Homebuilding | Construction and sale of single-family detached homes, townhomes, duplexes, and triplexes. |
| Mortgage Financing Services | Provides mortgage loans to homebuyers as part of its financial services. |
| Title Insurance & Closing Services | Offers title insurance policies, examination, and closing services related to home sales. |
| Residential Lot Development | Engages in acquisition and development of land for residential building projects. |
| Rental Properties | Development, ownership, leasing, and sale of multi-family and single-family rental properties. |
| Forestar Group | Segment involved in land acquisition and real estate development activities. |
| Financial Services | Includes mortgage financing and related financial products supporting homebuyers. |
D.R. Horton operates multiple residential construction brands offering single-family and attached homes, supported by mortgage financing and title services. It also develops rental properties and manages land through Forestar Group, reflecting a diversified real estate and homebuilding portfolio.
Main Competitors
There are 4 main competitors in the Residential Construction industry; the table below lists the top 4 leaders by market capitalization:
| Competitor | Market Cap. |
|---|---|
| D.R. Horton, Inc. | 42.6B |
| Lennar Corporation | 26.3B |
| PulteGroup, Inc. | 23.2B |
| NVR, Inc. | 20.6B |
D.R. Horton, Inc. ranks 1st among its 4 competitors with a market cap 3.3% above the next largest firm. It stands well above both the average market cap of the top 10 competitors (28.2B) and the median market cap in the sector (24.8B). The company holds a significant lead, with a 67.1% gap below it to the next competitor.
Comparisons with competitors
Check out how we compare the company to its competitors:
Does DHI have a competitive advantage?
D.R. Horton, Inc. currently does not present a clear competitive advantage, as its return on invested capital (ROIC) is below the weighted average cost of capital (WACC), indicating value is being shed and profitability is declining. The overall moat status is slightly unfavorable with a downward ROIC trend, suggesting challenges in sustaining economic profits.
Looking ahead, DHI operates across 31 states and 98 markets, providing opportunities to leverage its diverse geographic footprint and brand portfolio to introduce new residential products and services. These market presences could offer avenues for growth despite recent unfavorable income statement trends and margin pressures.
SWOT Analysis
This SWOT analysis highlights D.R. Horton, Inc.’s key internal strengths and weaknesses along with external opportunities and threats to guide informed investment decisions.
Strengths
- Leading homebuilder in 31 states
- Strong brand portfolio including America’s Builder
- Favorable net margin of 10.47%
Weaknesses
- Recent 1-year revenue decline of -6.93%
- Declining ROIC trend indicating value erosion
- High current ratio suggests inefficient asset management
Opportunities
- Expansion in high-growth U.S. regions
- Rising demand for single-family homes
- Growing mortgage financing and title service segments
Threats
- Volatile residential construction market
- Rising interest rates impacting affordability
- Intense competition in homebuilding sector
Overall, D.R. Horton maintains solid operational strengths and market leadership but faces challenges from recent profitability declines and market volatility. Strategic focus on operational efficiency and capitalizing on regional growth can help mitigate risks and sustain long-term value creation.
Stock Price Action Analysis
The following weekly stock chart of D.R. Horton, Inc. (DHI) illustrates price movements and volatility patterns over the past 12 months:
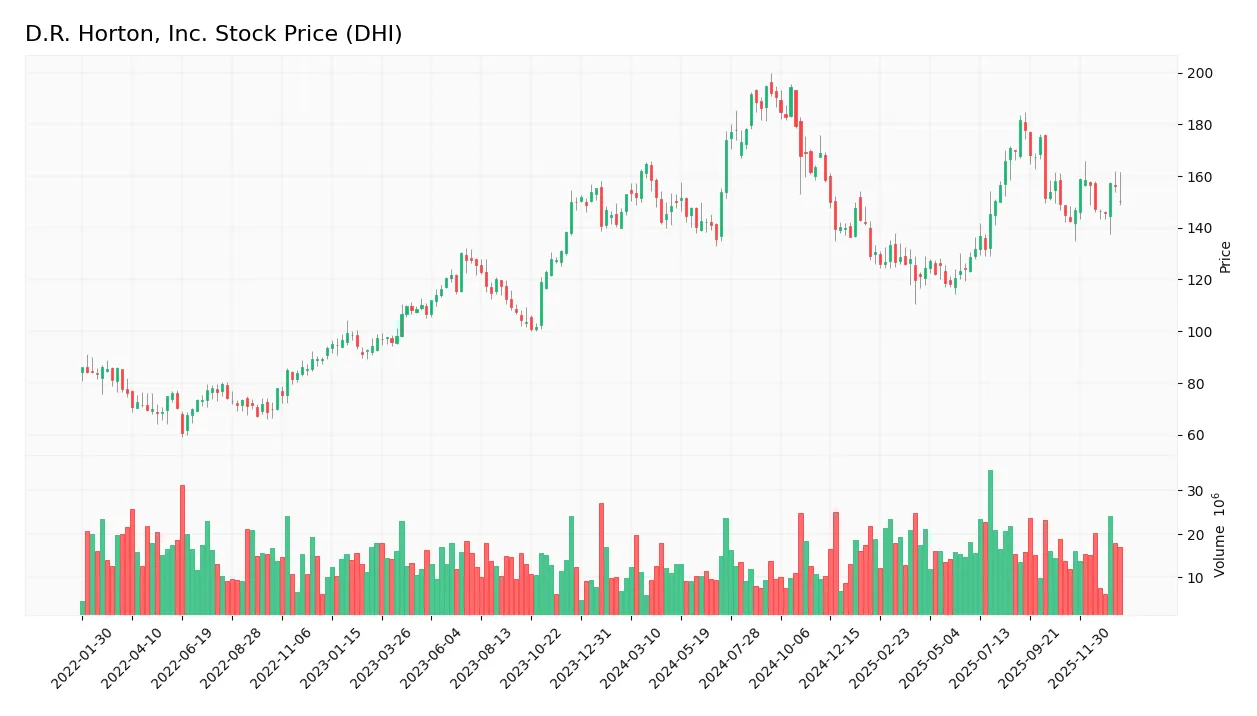
Trend Analysis
Over the past 12 months, DHI’s stock price declined by 1.61%, indicating a bearish trend by definition despite being close to neutral. The trend shows acceleration with a high volatility level (std deviation 20.01). The price ranged between a low of 118.06 and a high of 194.8, reflecting significant fluctuations during this period.
Volume Analysis
In the last three months, trading volume has been increasing overall, but the recent period from November 2025 to January 2026 shows seller dominance with buyers accounting for only 30.26% of activity. This suggests cautious investor sentiment, with selling pressure outweighing buying interest and elevated market participation.
Target Prices
The consensus among analysts presents a positive outlook for D.R. Horton, Inc., with a clear range of target prices.
| Target High | Target Low | Consensus |
|---|---|---|
| 195 | 129 | 173 |
Analysts expect the stock to trade between 129 and 195, with a consensus target of 173, indicating a generally optimistic market sentiment.

Don’t Let Luck Decide Your Entry Point
Optimize your entry points with our advanced ProRealTime indicators. You’ll get efficient buy signals with precise price targets for maximum performance. Start outperforming now!
Analyst & Consumer Opinions
This section reviews the latest analyst ratings and consumer feedback regarding D.R. Horton, Inc.’s market performance.
Stock Grades
Here is a detailed overview of recent grades assigned to D.R. Horton, Inc. by prominent financial institutions:
| Grading Company | Action | New Grade | Date |
|---|---|---|---|
| B of A Securities | Maintain | Neutral | 2026-01-21 |
| Barclays | Maintain | Equal Weight | 2026-01-21 |
| Evercore ISI Group | Maintain | In Line | 2026-01-21 |
| Citigroup | Maintain | Neutral | 2026-01-08 |
| Citizens | Downgrade | Market Perform | 2026-01-07 |
| Wells Fargo | Downgrade | Equal Weight | 2026-01-06 |
| UBS | Maintain | Buy | 2026-01-06 |
| Wells Fargo | Maintain | Overweight | 2025-12-08 |
| Barclays | Maintain | Equal Weight | 2025-12-08 |
| RBC Capital | Maintain | Underperform | 2025-10-29 |
The grades reveal a mix of hold-oriented assessments, with several firms maintaining neutral or equal weight ratings, while a few have recently downgraded their outlook. Notably, UBS continues to support a buy rating, reflecting some confidence amid cautious sentiment.
Consumer Opinions
Consumers of D.R. Horton, Inc. express a mix of appreciation and concerns, reflecting varied experiences with the homebuilder.
| Positive Reviews | Negative Reviews |
|---|---|
| “Excellent build quality and modern designs.” | “Customer service response times can be slow.” |
| “Smooth buying process with helpful sales staff.” | “Some homes had minor construction delays.” |
| “Good value for the price in growing neighborhoods.” | “Limited customization options in certain markets.” |
Overall, customers commend D.R. Horton for solid construction and value, but recurring issues include customer service delays and occasional project timeline setbacks.
Risk Analysis
Below is a summary table highlighting the main risk categories relevant to D.R. Horton, Inc., including their probability and potential impact on investment outcomes:
| Category | Description | Probability | Impact |
|---|---|---|---|
| Market Volatility | Fluctuations in housing demand and prices due to economic cycles | Medium | High |
| Interest Rate Risk | Rising interest rates increasing mortgage costs, potentially reducing sales | High | High |
| Operational Risk | Supply chain disruptions or increased construction costs | Medium | Medium |
| Regulatory Risk | Changes in zoning laws, building codes, or environmental regulations | Low | Medium |
| Liquidity Risk | Unfavorable current ratio indicates potential short-term liquidity concerns | Low | Medium |
The most critical risks for D.R. Horton center on interest rate increases and market volatility, which could significantly affect home sales and margins. Despite a strong Altman Z-score placing the company in a safe zone, the unfavorable current ratio and average Piotroski score suggest caution regarding liquidity and operational efficiency.
Should You Buy D.R. Horton, Inc.?
D.R. Horton, Inc. appears to be characterized by improving profitability and a manageable leverage profile, yet its competitive moat could be seen as slightly unfavorable due to declining returns. Supported by an overall A rating, this suggests a profile of operational efficiency with cautious value creation.
Strength & Efficiency Pillars
D.R. Horton, Inc. exhibits solid profitability with a net margin of 10.47% and a return on equity (ROE) of 14.82%, reflecting moderate efficiency in generating shareholder returns. Its return on invested capital (ROIC) stands at 9.9%, marginally below its weighted average cost of capital (WACC) of 9.67%, indicating the company is currently not a clear value creator. Financially, DHI is robust, supported by a strong Altman Z-Score of 6.25 placing it well within the safe zone, and a Piotroski score of 5, which suggests average financial health.
Weaknesses and Drawbacks
Several cautionary signals emerge in valuation and liquidity. The price-to-earnings (P/E) ratio at 14.58 denotes reasonable valuation, yet the price-to-book (P/B) ratio of 2.16 and an excessively high current ratio of 17.39 raise concerns about asset management and operational efficiency. The buyer dominance is weak at 30.26% over the recent period, indicating seller dominance that may create short-term selling pressure. Additionally, the company’s dividend yield is low at 0.95%, which might not attract income-focused investors.
Our Verdict about D.R. Horton, Inc.
The long-term fundamental profile of DHI is moderately favorable due to its profitability and financial stability, but the company’s inability to clearly create value (ROIC below WACC) and average Piotroski score temper enthusiasm. Despite a bearish overall stock trend and recent seller dominance, the recent mild price recovery could suggest a cautious wait-and-see approach before considering entry. Hence, DHI may appear suitable for investors seeking moderate exposure with attention to market timing.
Disclaimer: This content is for informational purposes only and does not constitute financial, investment, or other professional advice. Investing in financial markets involves a significant risk of loss, and past performance is not indicative of future results.
Additional Resources
- Is It Too Late To Consider D.R. Horton (DHI) After Strong Housing Market Optimism? – Yahoo Finance (Jan 23, 2026)
- D.R. Horton Inc (DHI) – Scale Advantage Offset by Housing Cycle Headwinds – AlphaStreet (Jan 21, 2026)
- Myriad Asset Management US LP Acquires Shares of 6,864 D.R. Horton, Inc. $DHI – MarketBeat (Jan 23, 2026)
- D.R. Horton: December Earnings Support Buying On Falling Mortgage Rates (NYSE:DHI) – Seeking Alpha (Jan 20, 2026)
- Results: D.R. Horton, Inc. Exceeded Expectations And The Consensus Has Updated Its Estimates – simplywall.st (Jan 23, 2026)
For more information about D.R. Horton, Inc., please visit the official website: drhorton.com