Home > Analyses > Technology > CyberArk Software Ltd.
CyberArk shapes the cybersecurity landscape by safeguarding privileged access that powers modern enterprises. As a pioneer in software infrastructure, it delivers cutting-edge solutions like Privileged Access Manager and Cloud Entitlements Manager. Renowned for innovation and trust, CyberArk serves global industries from finance to healthcare, defending critical assets against evolving threats. Now, the key question is whether its robust fundamentals and market influence still justify its premium valuation and growth outlook in 2026.

Table of contents
Business Model & Company Overview
CyberArk Software Ltd., founded in 1999 and headquartered in Petah Tikva, Israel, commands a leading position in software infrastructure security. Its ecosystem integrates privileged access management, identity services, and cloud entitlement solutions. This cohesive suite safeguards enterprises from cyber threats by controlling and monitoring critical credentials across diverse environments.
The company’s revenue engine balances robust software licenses with expanding SaaS offerings like Endpoint Privilege Manager and Cloud Entitlements Manager. CyberArk serves global markets across the Americas, Europe, and Asia through direct and partner channels. Its competitive advantage lies in a deep specialization that creates high switching costs, establishing a durable moat in the cybersecurity landscape.
Financial Performance & Fundamental Metrics
I analyze CyberArk Software Ltd.’s income statement, key financial ratios, and dividend payout policy to assess its core financial health and investment quality.
Income Statement
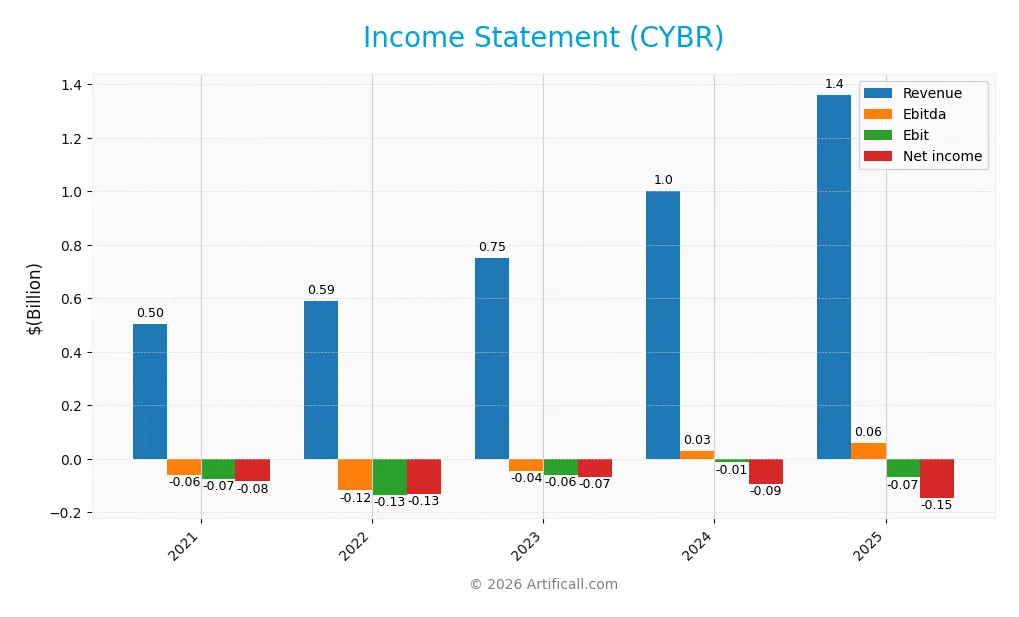
Below is CyberArk Software Ltd.’s income statement summary for fiscal years 2021 through 2025, showing key profitability and expense figures in USD.
| 2021 | 2022 | 2023 | 2024 | 2025 | |
|---|---|---|---|---|---|
| Revenue | 503M | 592M | 752M | 1.00B | 1.36B |
| Cost of Revenue | 93M | 126M | 156M | 208M | 350M |
| Operating Expenses | 488M | 618M | 712M | 865M | 1.12B |
| Gross Profit | 410M | 466M | 596M | 792M | 1.01B |
| EBITDA | -59M | -118M | -44M | 29M | 59M |
| EBIT | -73M | -134M | -61M | -13M | -69M |
| Interest Expense | 18M | 3M | 1M | 4M | 0 |
| Net Income | -84M | -130M | -67M | -93M | -147M |
| EPS | -2.12 | -3.21 | -1.60 | -2.12 | -2.93 |
| Filing Date | 2022-03-10 | 2023-03-02 | 2024-03-13 | 2025-03-12 | 2025-12-31 |
Income Statement Evolution
CyberArk’s revenue surged 36% in 2025 to $1.36B, continuing a 171% growth trend since 2021. Gross profit increased by 28%, maintaining a strong 74.25% gross margin. However, EBIT declined sharply, deepening the negative margin to -5.08%. Net income remained negative, widening losses and compressing net margins to -10.79%.
Is the Income Statement Favorable?
In 2025, fundamentals show mixed signals. Revenue and gross profit growth are favorable, reflecting robust top-line momentum and efficient cost of revenue management. Yet, operating expenses scaled with revenue growth, leading to an unfavorable EBIT decline and a net loss of $147M. Interest expenses are negligible, but the persistent net loss and negative margins temper optimism, resulting in a neutral overall assessment.
Financial Ratios
The table below summarizes key financial ratios for CyberArk Software Ltd. over the last five fiscal years:
| Ratios | 2021 | 2022 | 2023 | 2024 | 2025 |
|---|---|---|---|---|---|
| Net Margin | -16.7% | -22.0% | -8.8% | -9.3% | -10.8% |
| ROE | -11.6% | -19.2% | -8.4% | -3.9% | -6.1% |
| ROIC | -5.3% | -10.6% | -7.9% | -2.9% | -2.7% |
| P/E | -81.8 | -40.4 | -137.2 | -157.5 | -152.2 |
| P/B | 9.5 | 7.8 | 11.5 | 6.2 | 9.3 |
| Current Ratio | 3.1 | 2.4 | 1.1 | 1.5 | 2.0 |
| Quick Ratio | 3.1 | 2.4 | 1.1 | 1.5 | 2.0 |
| D/E | 0.73 | 0.85 | 0.76 | 0.01 | 0.51 |
| Debt-to-Assets | 31.1% | 31.7% | 29.8% | 0.9% | 25.4% |
| Interest Coverage | -4.3 | -46.9 | -195.0 | -17.9 | 0 |
| Asset Turnover | 0.30 | 0.33 | 0.37 | 0.30 | 0.28 |
| Fixed Asset Turnover | 24.9 | 25.2 | 15.4 | 51.1 | 32.7 |
| Dividend Yield | 0% | 0% | 0% | 0% | 0% |
Evolution of Financial Ratios
From 2021 to 2025, CyberArk’s Return on Equity (ROE) consistently remained negative, declining further to -6.11% in 2025. The Current Ratio improved steadily, reaching 2.0 in 2025, indicating better short-term liquidity. The Debt-to-Equity ratio fluctuated but settled at a moderate 0.51 in 2025, signaling relatively stable leverage over the period.
Are the Financial Ratios Favorable?
In 2025, profitability ratios including net margin (-10.79%) and ROE (-6.11%) are unfavorable, reflecting ongoing losses. Liquidity ratios like the current and quick ratios stand at a favorable 2.0, showing solid short-term financial health. Leverage ratios are neutral to favorable, with a debt-to-assets ratio at 25.38%. Asset turnover at 0.28 is unfavorable, while fixed asset turnover is favorable at 32.73. Overall, the financial ratios lean slightly unfavorable.
Shareholder Return Policy
CyberArk Software Ltd. does not pay dividends, reflecting its negative net income and ongoing reinvestment in growth and development. The company maintains share buyback programs, though details on their scale and frequency are not provided.
This approach aligns with a strategy prioritizing long-term value creation through capital allocation to R&D and expansion. The absence of dividends, paired with share repurchases, suggests a focus on sustaining future profitability rather than immediate shareholder payouts.
Score analysis
The following radar chart displays CyberArk Software Ltd.’s key financial metric scores, highlighting strengths and weaknesses:
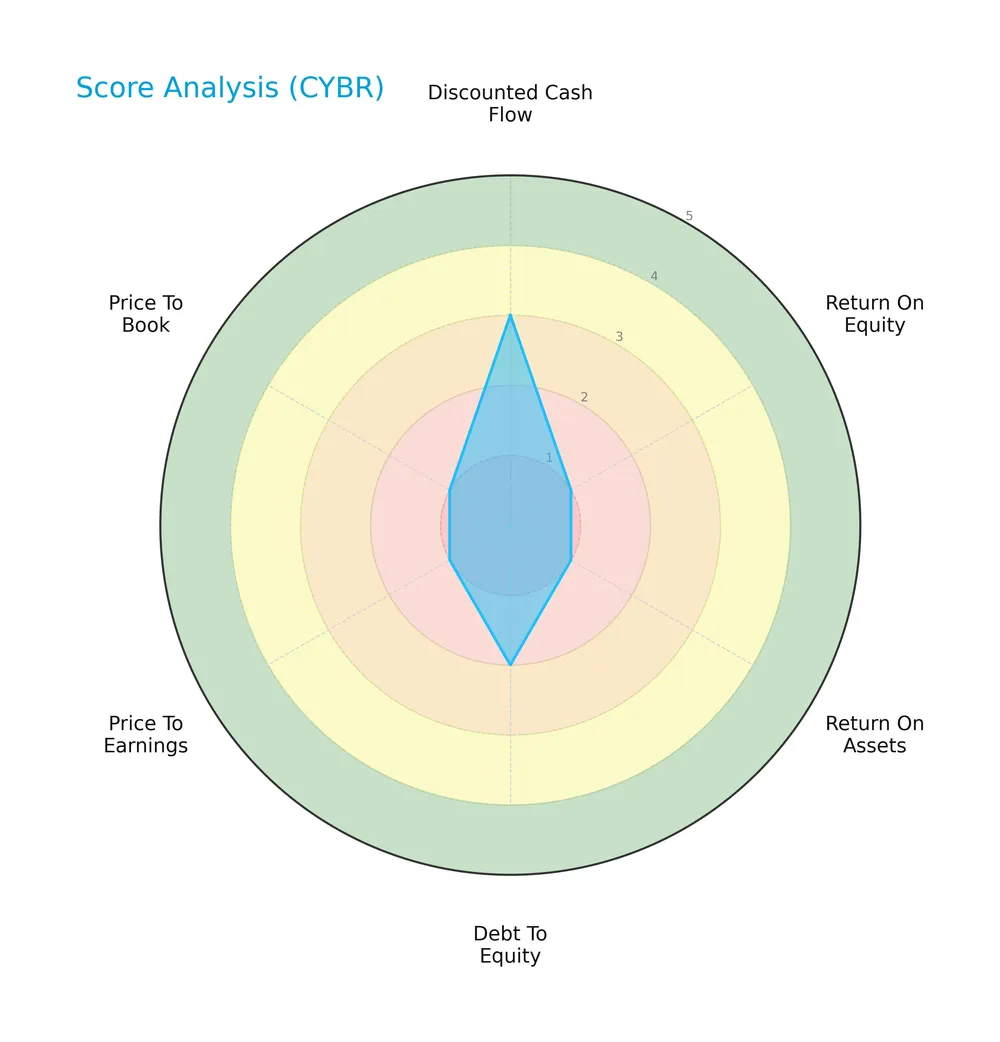
CyberArk’s discounted cash flow and debt-to-equity scores show moderate strength. However, returns on equity and assets, along with valuation metrics, remain very unfavorable, signaling persistent operational and market challenges.
Analysis of the company’s bankruptcy risk
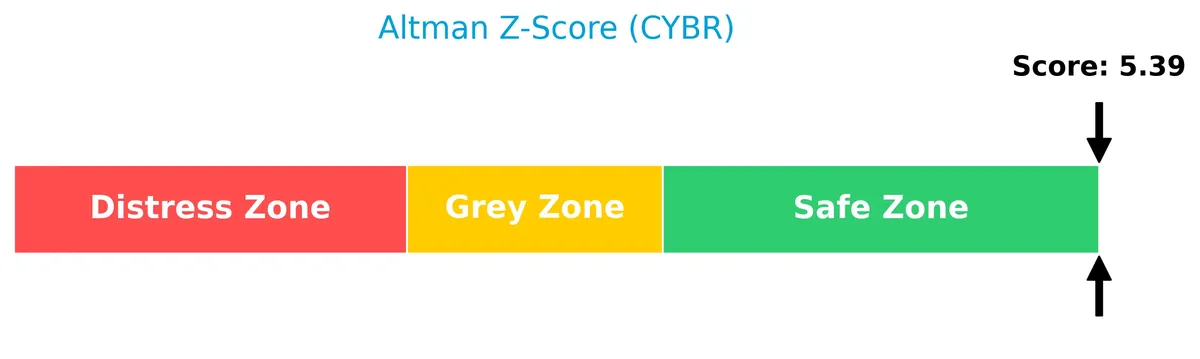
CyberArk’s Altman Z-Score firmly places it in the safe zone, indicating a low risk of bankruptcy based on its financial ratios:
Is the company in good financial health?
The Piotroski Score diagram provides insight into CyberArk’s financial health based on profitability, leverage, and efficiency metrics:
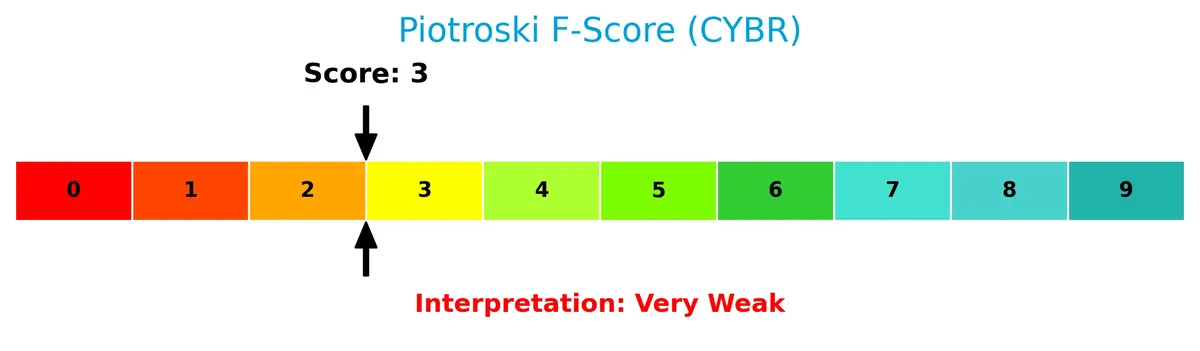
With a Piotroski Score of 3, CyberArk scores very weak, suggesting limited financial strength and highlighting areas requiring improvement for sustained value creation.
Competitive Landscape & Sector Positioning
This section analyzes CyberArk Software Ltd.’s strategic positioning within the software infrastructure sector. It covers revenue by segment, key products, and main competitors. I will assess whether CyberArk holds a competitive advantage over its peers.
Strategic Positioning
CyberArk concentrates on software-based security solutions, with a diverse product mix spanning SaaS, self-hosted subscriptions, and professional services. Geographically, it balances revenue between the US (503M) and EMEA (243M), maintaining moderate exposure in Israel and other regions.
Revenue by Segment
The pie chart illustrates CyberArk Software Ltd.’s revenue distribution by segment for fiscal year 2024, highlighting the company’s business drivers and evolving revenue mix.
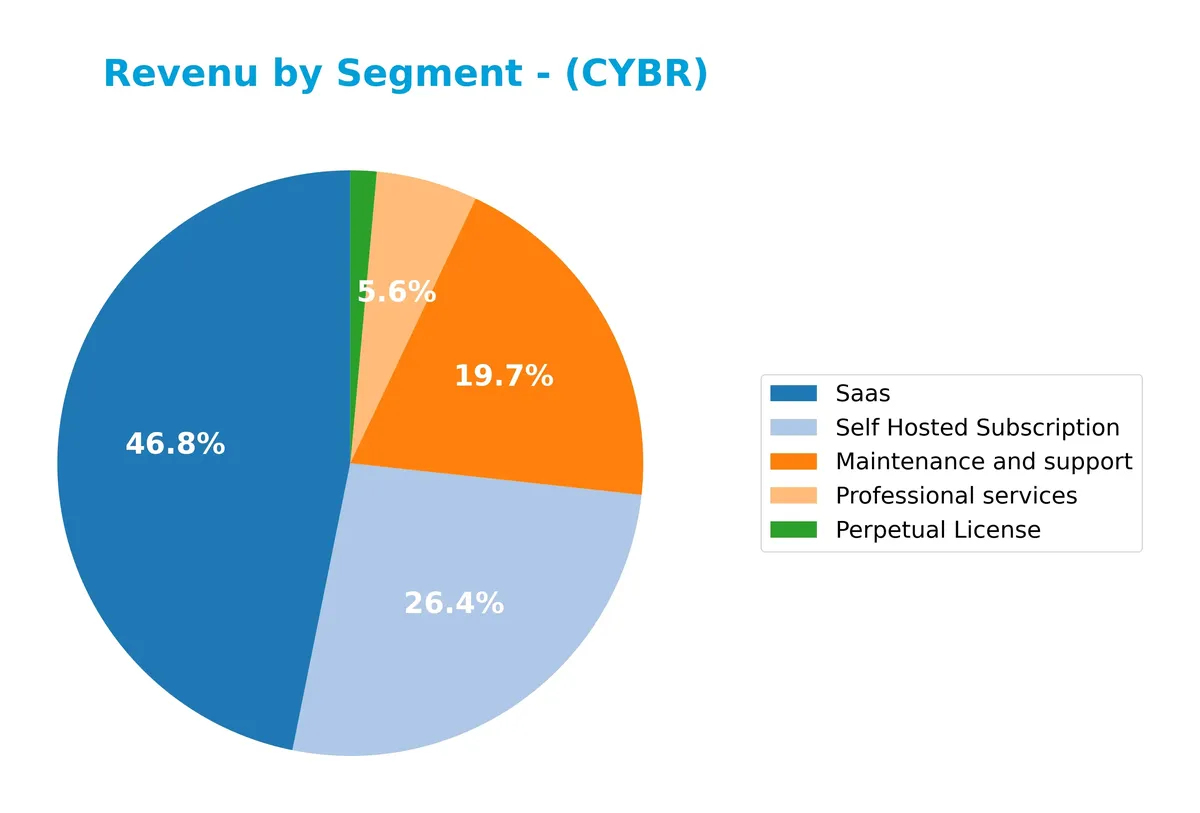
In 2024, SaaS leads revenue at $469M, showcasing rapid growth and an accelerated shift toward cloud services. Self Hosted Subscription follows strongly at $265M, reflecting steady demand. Maintenance and Support remains significant at $197M but shows a slight decline, indicating a shift from traditional models. Professional Services and Perpetual License segments contribute less, signaling concentration risk in subscription-based revenues. This trend aligns with industry moves towards recurring revenue streams.
Key Products & Brands
The following table outlines CyberArk Software Ltd.’s primary products and services as of fiscal year 2024:
| Product | Description |
|---|---|
| Privileged Access Manager | Software that offers risk-based credential security and session management to protect against privileged access attacks. |
| Vendor Privileged Access Manager | Combines Privileged Access Manager and Remote Access to securely manage third-party vendor access. |
| Endpoint Privilege Manager | SaaS solution securing privileges on endpoints to reduce risk. |
| Cloud Entitlements Manager | SaaS tool implementing least privilege across cloud environments to reduce excessive privilege risks. |
| Identity and Access Management as a Service | Includes workforce identity with adaptive MFA, single sign-on, secure web sessions, and customer identity services. |
| Secrets Manager Credential Providers | Provides and manages credentials for third-party solutions. |
| Secrets Manager Conjur | Cloud-native application secrets management solution. |
| Maintenance and Support | Ongoing support services to maintain software performance and security. |
| Perpetual License | One-time license sales for CyberArk’s software products. |
| Professional Services | Consulting, implementation, and training services. |
| SaaS | Subscription-based cloud software offerings. |
| Self Hosted Subscription | Subscription-based software deployed on customer premises. |
CyberArk’s portfolio balances on-premises and cloud-based security solutions. SaaS and self-hosted subscriptions have grown notably, reflecting industry trends toward recurring revenue models and cloud adoption. Maintenance and professional services complement product sales, supporting customer retention and implementation.
Main Competitors
CyberArk Software Ltd. faces competition from 32 peers, with the top 10 leaders by market capitalization listed below:
| Competitor | Market Cap. |
|---|---|
| Microsoft Corporation | 3.52T |
| Oracle Corporation | 553B |
| Palantir Technologies Inc. | 383B |
| Adobe Inc. | 140B |
| Palo Alto Networks, Inc. | 120B |
| CrowdStrike Holdings, Inc. | 113B |
| Synopsys, Inc. | 92B |
| Cloudflare, Inc. | 69B |
| Fortinet, Inc. | 59B |
| Block, Inc. | 40B |
CyberArk ranks 14th among 32 competitors. Its market cap is just 0.57% of Microsoft’s, the sector leader. The company sits below the average market cap of the top 10 (508B) but above the sector median (19B). It enjoys a substantial 71.7% gap over the next closest competitor above, highlighting a notable scale difference within its peer group.
Comparisons with competitors
Check out how we compare the company to its competitors:
Does CyberArk have a competitive advantage?
CyberArk currently lacks a strong competitive advantage, as it is shedding value with a ROIC well below its WACC. Despite this, its gross margin remains robust at 74%, supporting operational leverage.
Looking ahead, CyberArk’s expanding product suite in privileged access, endpoint security, and cloud entitlements, combined with geographic revenue growth in the U.S. and EMEA, presents clear opportunities for market penetration and margin improvement.
SWOT Analysis
This SWOT analysis highlights CyberArk Software Ltd.’s key strategic factors to guide investment decisions.
Strengths
- strong revenue growth 36% YoY
- high gross margin 74%
- diverse global customer base
Weaknesses
- negative net margin -10.8%
- negative ROIC below WACC
- weak profitability and efficiency metrics
Opportunities
- expanding cloud security market
- increasing demand for privileged access management
- growth in international markets, especially EMEA
Threats
- intense competition in cybersecurity
- rapid technology changes
- potential margin pressure from rising expenses
CyberArk’s robust revenue growth and market presence contrast with weak profitability and value destruction. The company must improve capital efficiency while leveraging cloud security trends to sustain its competitive edge.
Stock Price Action Analysis
The weekly stock chart below illustrates CyberArk Software Ltd.’s price movements over the past 12 months, highlighting key highs and lows along the timeline:
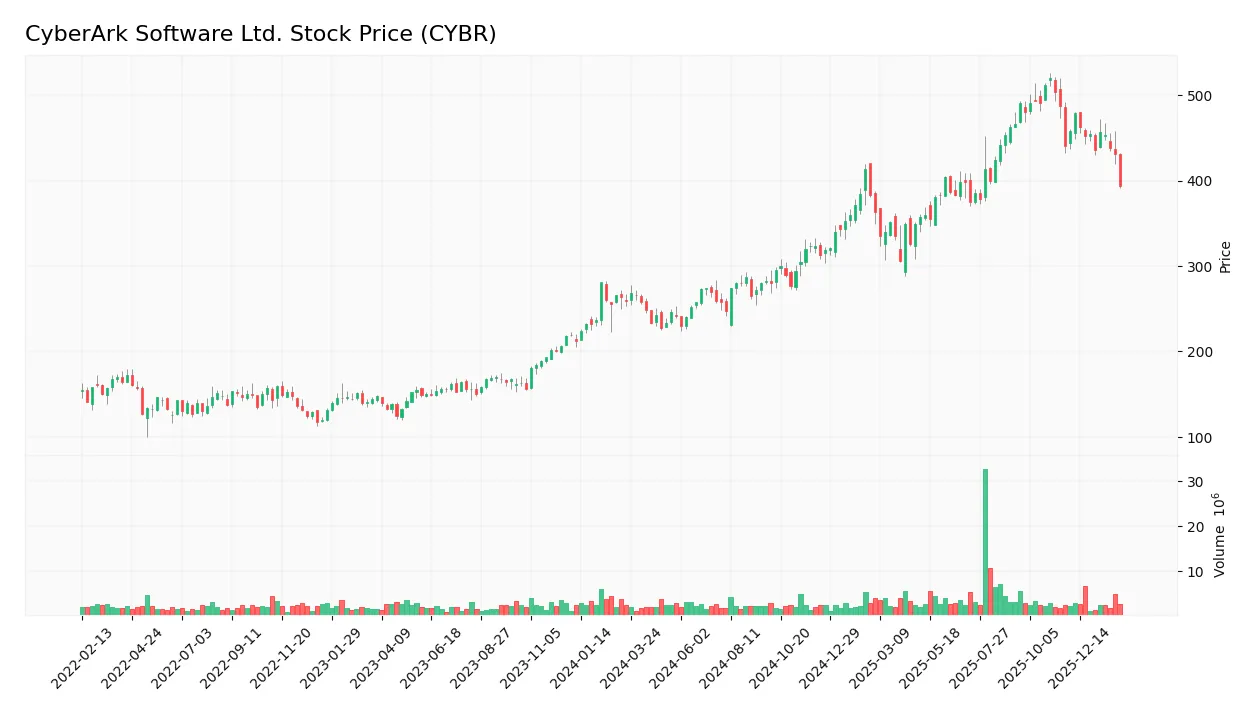
Trend Analysis
Over the past 12 months, CYBR gained 51.98%, signaling a strong bullish trend by a wide margin. The stock reached a high of 520.78 and a low of 227.32, showing significant volatility with an 81.98 standard deviation. However, recent months reveal a deceleration in momentum.
Volume Analysis
In the last three months, trading volume shows a seller-driven pattern with sellers accounting for 73.66% of activity. Volume is increasing, indicating heightened market participation but growing bearish sentiment among investors. Buyer dominance dropped to 26.34%, reinforcing the seller’s control during this period.
Target Prices
Analysts set a confident target consensus for CyberArk Software Ltd. based on solid growth prospects.
| Target Low | Target High | Consensus |
|---|---|---|
| 411 | 502 | 466.17 |
The target prices indicate a robust upside potential, reflecting strong market confidence in CyberArk’s strategic positioning.

Don’t Let Luck Decide Your Entry Point
Optimize your entry points with our advanced ProRealTime indicators. You’ll get efficient buy signals with precise price targets for maximum performance. Start outperforming now!
Analyst & Consumer Opinions
This section reviews analyst ratings and consumer feedback to provide a comprehensive view of CyberArk Software Ltd.’s market perception.
Stock Grades
Here are the latest verified stock grades from leading financial institutions for CyberArk Software Ltd.:
| Grading Company | Action | New Grade | Date |
|---|---|---|---|
| Oppenheimer | Maintain | Outperform | 2024-10-22 |
| Keybanc | Maintain | Overweight | 2024-10-18 |
| Mizuho | Maintain | Outperform | 2024-10-17 |
| BTIG | Maintain | Buy | 2024-10-09 |
| Barclays | Maintain | Overweight | 2024-10-07 |
| Wedbush | Maintain | Outperform | 2024-10-01 |
| Jefferies | Maintain | Buy | 2024-09-24 |
| Wedbush | Maintain | Outperform | 2024-08-09 |
| Keybanc | Maintain | Overweight | 2024-08-09 |
| Cantor Fitzgerald | Maintain | Overweight | 2024-08-09 |
The grades show a consistent positive consensus with all firms maintaining Buy, Outperform, or Overweight ratings through late 2024. No downgrades or Sell ratings indicate stable confidence in the stock’s outlook.
Consumer Opinions
CyberArk Software Ltd. sparks a mix of admiration and frustration among its user base, reflecting its complex role in cybersecurity.
| Positive Reviews | Negative Reviews |
|---|---|
| Robust security features protect critical assets | Steep learning curve for new users |
| Reliable customer support with quick responses | High pricing relative to competitors |
| Comprehensive access control capabilities | Occasional software bugs disrupt workflows |
Overall, consumers praise CyberArk’s strong security protocols and responsive support. However, they frequently cite its complexity and cost as barriers, suggesting room for improved user experience and pricing strategies.
Risk Analysis
Below is a summary table highlighting key risk categories, their descriptions, probabilities, and potential impacts for CyberArk Software Ltd.:
| Category | Description | Probability | Impact |
|---|---|---|---|
| Profitability Risk | Negative net margin (-10.8%) signals ongoing losses, pressuring cash flow and valuation. | High | High |
| Operational Risk | Low asset turnover (0.28) indicates inefficiency in using assets to generate revenue. | Medium | Medium |
| Financial Stability | Interest coverage ratio at 0 signals inability to cover interest expenses from earnings. | High | High |
| Market Valuation | Elevated price-to-book ratio (9.31) suggests overvaluation relative to book value. | Medium | Medium |
| Credit Risk | Debt-to-equity moderate (0.51), but Altman Z-Score (5.39) indicates low bankruptcy risk. | Low | Low |
| Growth Risk | Weak Piotroski score (3) reflects poor financial strength and limited growth prospects. | High | Medium |
Profitability and financial stability risks dominate. CyberArk’s negative margins and zero interest coverage heighten liquidity concerns. Despite a strong Altman Z-score signaling low bankruptcy risk, weak operational efficiency and poor Piotroski score flag potential growth challenges. Overvaluation risks remain due to a high PB ratio. Investors should monitor cash flow and margin improvement closely.
Should You Buy CyberArk Software Ltd.?
CyberArk appears to be shedding value despite improving profitability, suggesting a slightly unfavorable moat. Its leverage profile could be seen as moderate with a safe-zone Altman Z-score. Overall, the firm’s rating of C- reflects significant financial challenges.
Strength & Efficiency Pillars
CyberArk Software Ltd. shows robust financial health with an Altman Z-score of 5.39, placing it firmly in the safe zone. The company maintains a strong gross margin of 74.25%, reflecting solid product pricing power. Its current and quick ratios both stand at 2.0, indicating good liquidity. Although ROIC is -2.74%, below its WACC of 7.88%, signaling value destruction, some operational efficiency is evident in a high fixed asset turnover of 32.73.
Weaknesses and Drawbacks
The company struggles with profitability, posting a negative net margin of -10.79% and a return on equity of -6.11%, both unfavorable. Valuation metrics raise concerns, with a high price-to-book ratio of 9.31, suggesting potential overvaluation. Its interest coverage is zero, signaling vulnerability to financial stress despite moderate debt-to-equity at 0.51. Recent market behavior is bearish; sellers dominate at 73.66%, pressuring the stock with a 10.56% recent price decline.
Our Verdict about CyberArk Software Ltd.
CyberArk’s long-term fundamentals appear unfavorable due to persistent losses and value destruction. Despite a bullish overall trend, recent seller dominance and negative earnings momentum suggest caution. Investors might consider a wait-and-see approach for a better entry point, as operational strengths have yet to translate into sustained profitability or shareholder value creation.
Disclaimer: This content is for informational purposes only and does not constitute financial, investment, or other professional advice. Investing in financial markets involves a significant risk of loss, and past performance is not indicative of future results.
Additional Resources
- CyberArk Software (CYBR) Faces Target Price Reduction by Barclays | CYBR Stock News – GuruFocus (Feb 05, 2026)
- Compared to Estimates, CyberArk (CYBR) Q4 Earnings: A Look at Key Metrics – Yahoo Finance Singapore (Feb 04, 2026)
- CyberArk Software (CYBR): Mizuho Lowers Price Target to $470 | C – GuruFocus (Feb 05, 2026)
- Earnings Flash (CYBR) CyberArk Software Ltd. Reports Q4 Revenue $372.7M, vs. FactSet Est of $361.2M – marketscreener.com (Feb 04, 2026)
- Earnings Summary: CyberArk Software Q4 – Benzinga (Feb 04, 2026)
For more information about CyberArk Software Ltd., please visit the official website: cyberark.com