Home > Analyses > Healthcare > CVS Health Corporation
CVS Health reshapes how millions access healthcare daily, blending pharmacy, insurance, and clinical services under one roof. It commands the U.S. healthcare plans sector with a vast network of nearly 10,000 retail locations and 1,200 MinuteClinics. Renowned for innovation and integration, CVS drives efficiency in pharmacy benefit management and consumer health. The critical question: does CVS’s current financial strength and market position justify its valuation amid evolving healthcare dynamics?
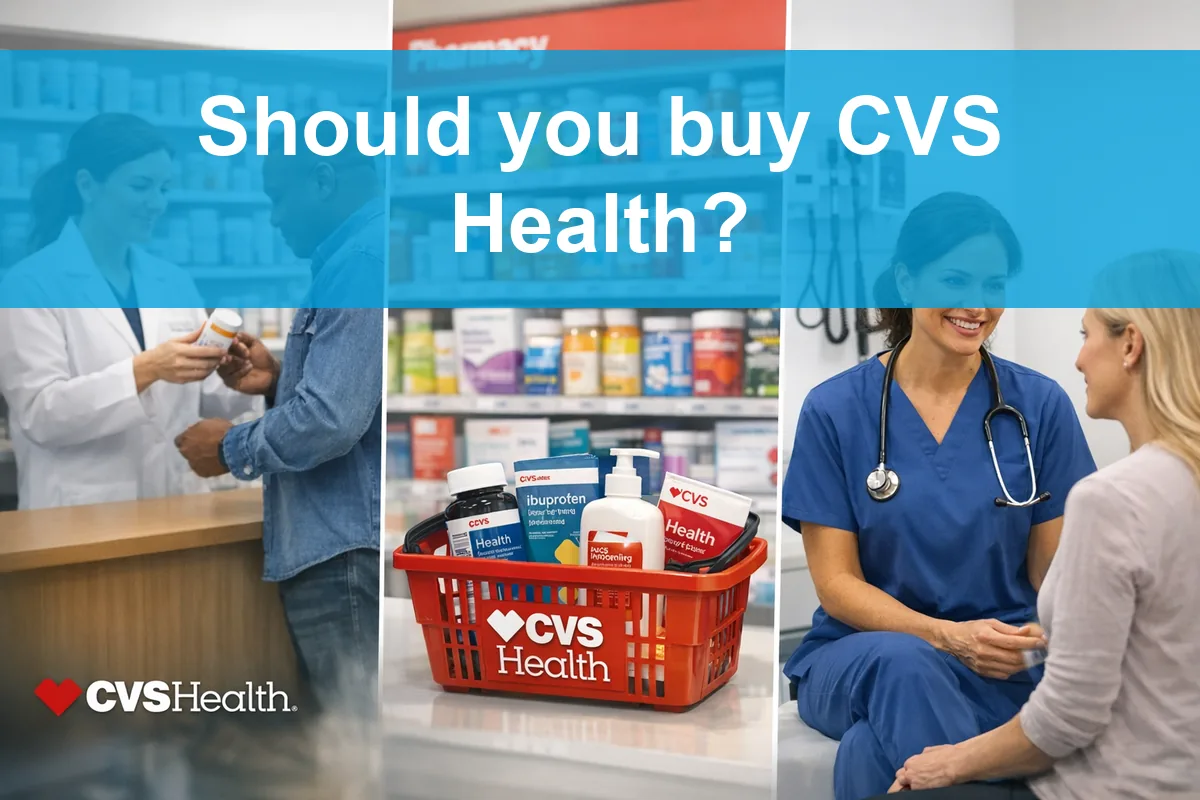
Table of contents
Business Model & Company Overview
CVS Health Corporation, founded in 1963 and headquartered in Woonsocket, Rhode Island, stands as a dominant force in the U.S. healthcare sector. Its integrated ecosystem spans health care benefits, pharmacy services, and retail/LTC operations. This combined offering serves a broad client base—from employer groups and government plans to individual consumers—creating a comprehensive health services platform that drives scale and efficiency across 9,900 retail locations and 1,200 MinuteClinics.
The company generates value through a balanced revenue engine combining insurance products, pharmacy benefit management, and retail drug sales with in-clinic care. Its strategic footprint covers the Americas with significant penetration in diverse markets. CVS’s ability to integrate clinical services with pharmacy and insurance creates a powerful economic moat, positioning it to shape the future of healthcare delivery in the U.S.
Financial Performance & Fundamental Metrics
I analyze CVS Health Corporation’s income statement, key financial ratios, and dividend payout policy to assess its core profitability and shareholder value.
Income Statement
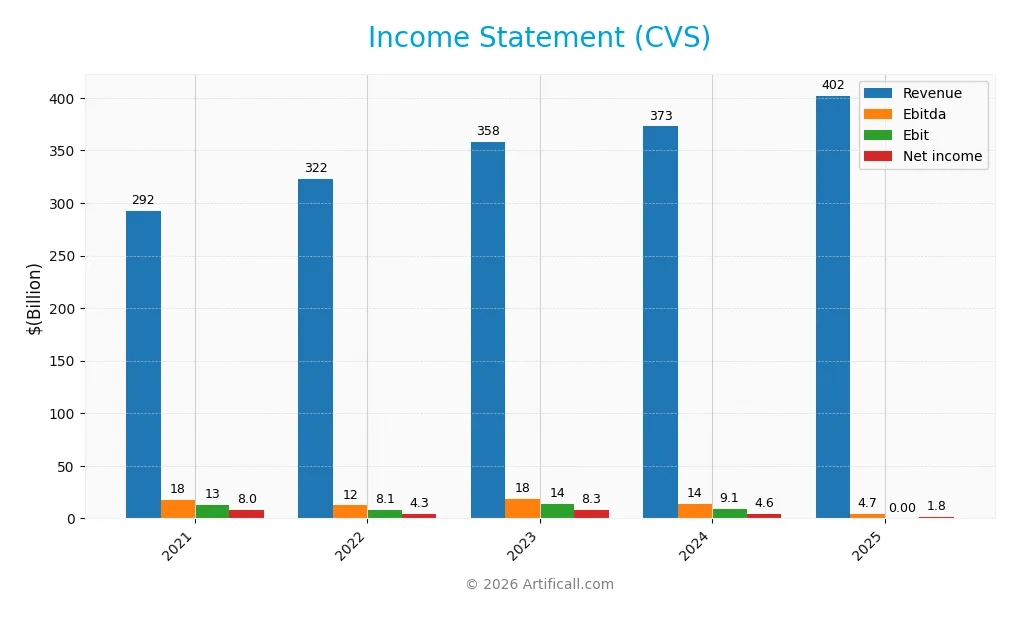
Below is CVS Health Corporation’s income statement overview for the fiscal years 2021 through 2025, highlighting key profitability and expense metrics.
| 2021 | 2022 | 2023 | 2024 | 2025 | |
|---|---|---|---|---|---|
| Revenue | 292.1B | 322.5B | 357.8B | 372.8B | 402.1B |
| Cost of Revenue | 240.0B | 268.0B | 303.3B | 321.4B | 346.7B |
| Operating Expenses | 38.8B | 46.5B | 40.7B | 42.9B | 44.98B |
| Gross Profit | 52.1B | 54.5B | 54.4B | 51.4B | 55.4B |
| EBITDA | 17.5B | 12.3B | 18.2B | 13.7B | 4.7B |
| EBIT | 13.0B | 8.1B | 13.8B | 9.1B | 0 |
| Interest Expense | 2.5B | 2.3B | 2.7B | 3.0B | 3.1B |
| Net Income | 8.0B | 4.3B | 8.3B | 4.6B | 1.8B |
| EPS | 6.00 | 3.29 | 6.49 | 3.66 | 1.40 |
| Filing Date | 2022-02-09 | 2023-02-08 | 2024-02-07 | 2025-02-12 | 2026-02-10 |
Income Statement Evolution
From 2021 to 2025, CVS’s revenue rose 38% to 402B, signaling solid top-line growth. However, net income plummeted nearly 78%, falling to 1.77B. Gross margins remained stable around 13.8%, but operating income collapsed, pushing EBIT margin to zero. This signals margin compression despite revenue gains, reflecting rising expenses or cost pressures.
Is the Income Statement Favorable?
In 2025, CVS showed neutral gross margin (13.77%) and net margin (0.44%), but EBIT margin was unfavorable at 0%. Interest expense was a favorable 0.78% of revenue. One-year growth rates reveal a 7.9% revenue increase, offset by sharply declining EBIT and net income margins. The overall income statement trend is unfavorable, indicating erosion in profitability fundamentals.
Financial Ratios
The table below summarizes CVS Health Corporation’s key financial ratios from 2020 to 2024, reflecting profitability, valuation, liquidity, leverage, efficiency, and dividend metrics:
| Ratios | 2020 | 2021 | 2022 | 2023 | 2024 |
|---|---|---|---|---|---|
| Net Margin | 2.67% | 2.74% | 1.34% | 2.33% | 1.24% |
| ROE | 10.35% | 10.66% | 6.03% | 10.91% | 6.11% |
| ROIC | 5.83% | 5.90% | 3.63% | 5.87% | 3.61% |
| P/E | 12.45 | 17.01 | 28.36 | 12.16 | 12.25 |
| P/B | 1.29 | 1.81 | 1.71 | 1.33 | 0.75 |
| Current Ratio | 0.91 | 0.88 | 0.95 | 0.86 | 0.81 |
| Quick Ratio | 0.61 | 0.62 | 0.67 | 0.63 | 0.60 |
| D/E | 1.23 | 1.01 | 0.99 | 1.04 | 1.10 |
| Debt-to-Assets | 37% | 33% | 31% | 32% | 33% |
| Interest Coverage | 4.79 | 5.32 | 3.48 | 5.17 | 2.88 |
| Asset Turnover | 1.16 | 1.25 | 1.41 | 1.43 | 1.47 |
| Fixed Asset Turnover | 8.06 | 9.12 | 10.49 | 11.76 | 12.88 |
| Dividend Yield | 2.93% | 1.93% | 2.38% | 3.09% | 5.97% |
Evolution of Financial Ratios
From 2020 to 2024, CVS’s Return on Equity (ROE) declined from about 10.3% to 6.1%, signaling weakening profitability. The Current Ratio steadily decreased from 0.91 to 0.81, indicating tighter liquidity. The Debt-to-Equity Ratio rose from 1.23 to 1.10, showing relatively stable but elevated leverage. Profit margins contracted notably in 2024.
Are the Financial Ratios Favorable?
In 2024, CVS’s profitability ratios, including ROE (6.1%) and net margin (1.24%), appear unfavorable versus sector benchmarks. Liquidity ratios like Current (0.81) and Quick (0.6) ratios remain below 1, raising red flags. Leverage is elevated with a Debt-to-Equity of 1.1, also unfavorable. However, valuation metrics such as P/E (12.25) and P/B (0.75) are favorable, alongside asset turnover ratios. Overall, the financial ratios are slightly unfavorable.
Shareholder Return Policy
CVS Health maintains a consistent dividend policy, with a payout ratio around 73% in 2024 and a dividend yield near 6%. The dividend per share has increased steadily over recent years, supported by free cash flow coverage of approximately 69%. The company also engages in share buybacks, complementing its distribution strategy.
This approach balances returning cash to shareholders with sustaining capital expenditures, as the dividend and capex coverage ratio exceeds 1.4. However, the relatively high payout ratio warrants monitoring for potential pressure on financial flexibility. Overall, the policy appears aligned with supporting long-term shareholder value through a mix of income and buybacks.
Score analysis
Below is a radar chart illustrating CVS Health Corporation’s key financial scores across valuation, profitability, and leverage metrics:
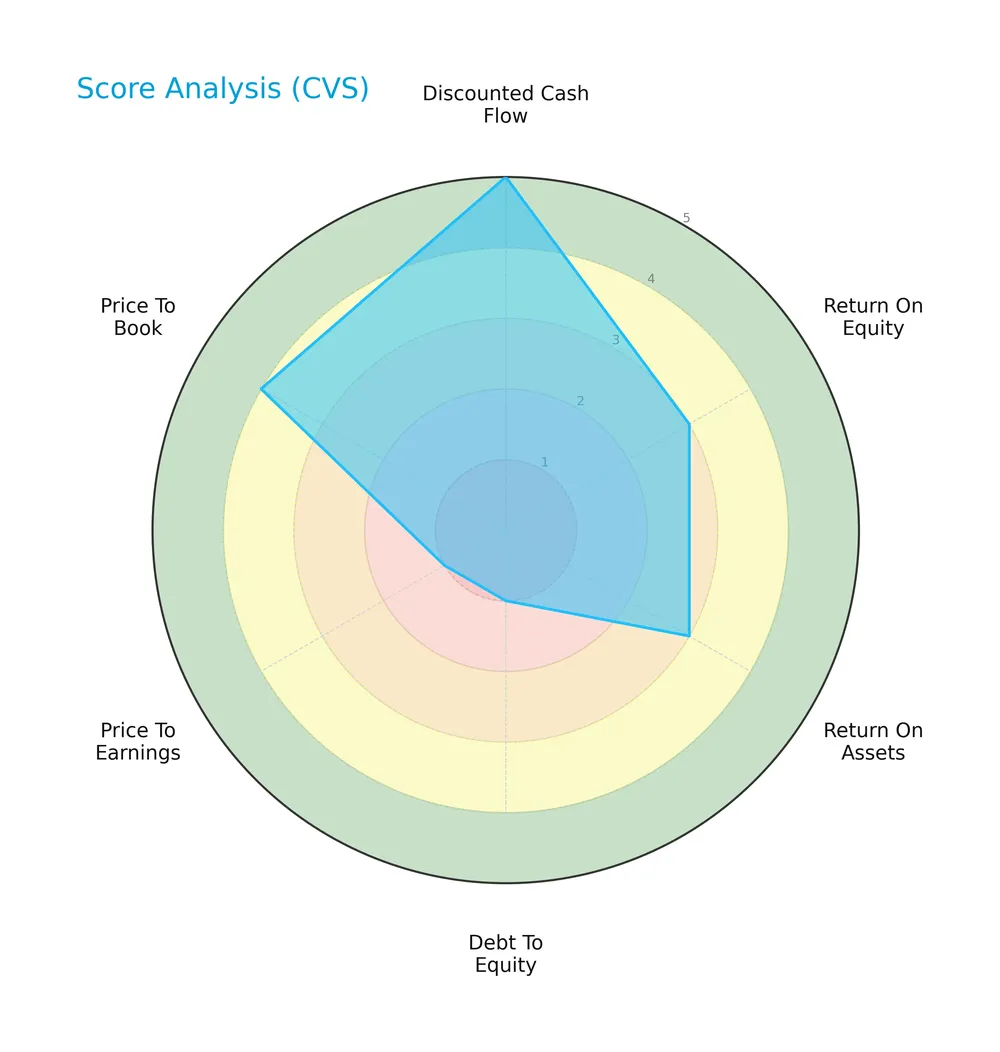
CVS scores very favorably on discounted cash flow (5) and price to book (4). Profitability metrics ROE and ROA are moderate (3 each). Debt to equity and price to earnings scores remain very unfavorable (1 each), signaling financial leverage and valuation concerns.
Analysis of the company’s bankruptcy risk
The Altman Z-Score places CVS in the grey zone, indicating a moderate risk of bankruptcy that warrants cautious monitoring:

Is the company in good financial health?
The following Piotroski diagram reflects CVS’s financial strength based on nine key criteria:
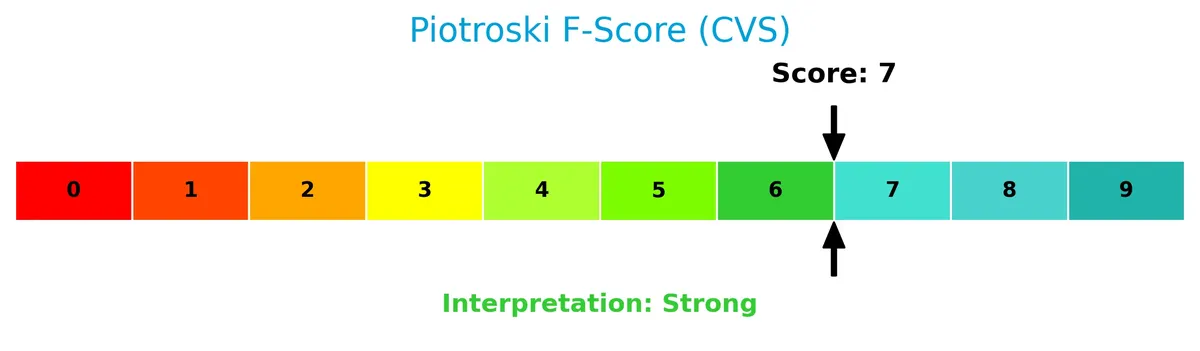
With a Piotroski score of 7, CVS demonstrates strong financial health. This suggests solid profitability, liquidity, and operational efficiency, though not at the very strongest level.
Competitive Landscape & Sector Positioning
This sector analysis examines CVS Health Corporation’s strategic positioning, revenue breakdown, and key products within healthcare. I will assess CVS’s main competitors and competitive advantages in the medical healthcare plans industry. The goal is to determine whether CVS holds a sustainable edge over its peers.
Strategic Positioning
CVS Health Corporation concentrates primarily on the U.S. healthcare market with a diversified portfolio spanning pharmacy services, retail pharmacy, and health insurance premiums. Its integrated model combines large-scale pharmacy operations with insurance products, leveraging about 9,900 retail locations and 1,200 MinuteClinics.
Revenue by Segment
This pie chart displays CVS Health Corporation’s revenue distribution by segment for the fiscal year 2024, highlighting the company’s multi-billion-dollar business lines.
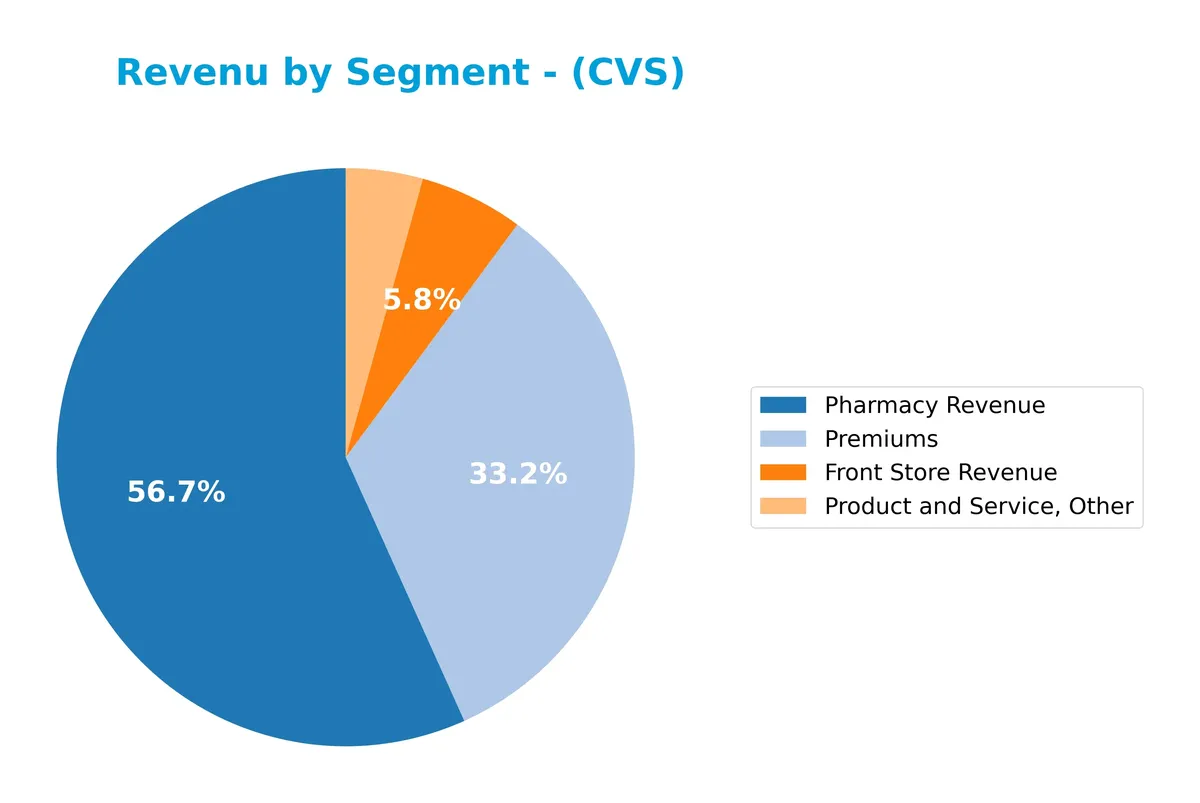
In 2024, Pharmacy Revenue remains the dominant segment at $210B, reflecting CVS’s core strength in prescription fulfillment. Premiums surged to $123B, marking a clear acceleration and increasing their share of total revenue. Front Store Revenue and Product and Service, Other contribute $21.5B and $16B respectively, showing stable but smaller roles. The growth in Premiums signals a strategic shift towards insurance services, raising concentration risk but diversifying earnings beyond traditional retail pharmacy.
Key Products & Brands
The table below outlines CVS Health Corporation’s main products and brands across its business segments:
| Product | Description |
|---|---|
| Pharmacy Services | Pharmacy benefit management, plan design, formulary management, retail and specialty pharmacy. |
| Retail/LTC (Front Store) | Prescription drugs, OTC products, health and beauty items, MinuteClinic walk-in medical clinics. |
| Health Care Benefits (Premiums) | Traditional, voluntary, and consumer-directed health insurance products and related services. |
| Product and Service, Other | Ancillary services including pharmacy consulting and related health care services. |
CVS Health’s diversified offerings span pharmacy services, retail health products, and insurance premiums. Its integration of clinical and retail solutions supports a broad customer base across healthcare and insurance sectors.
Main Competitors
There are 7 main competitors in the Healthcare sector; the table below lists the top 7 leaders by market capitalization:
| Competitor | Market Cap. |
|---|---|
| UnitedHealth Group Incorporated | 305B |
| CVS Health Corporation | 102B |
| Elevance Health Inc. | 79B |
| Cigna Corporation | 75B |
| Humana Inc. | 32B |
| Centene Corporation | 21B |
| Molina Healthcare, Inc. | 9.7B |
CVS Health ranks 2nd among its 7 competitors with a market cap at 31.5% of the leader, UnitedHealth Group. It stands above both the average market cap of the top 10 competitors (88.8B) and the sector median (74.6B). CVS has a significant 217% market cap gap from the next competitor above, highlighting its strong position in the sector.
Comparisons with competitors
Check out how we compare the company to its competitors:
Does CVS have a competitive advantage?
CVS does not present a competitive advantage, as it consistently generates returns below its cost of capital. Its ROIC has declined sharply, indicating value destruction and weakening profitability over recent years.
Looking ahead, CVS’s extensive healthcare services and retail footprint offer opportunities to expand new products and markets. However, ongoing challenges in profitability and margin pressures temper the outlook for sustainable advantage.
SWOT Analysis
This SWOT analysis highlights CVS Health Corporation’s strategic position, balancing its internal capabilities against external market forces.
Strengths
- strong retail footprint with 9,900 locations
- integrated healthcare services boost customer loyalty
- favorable valuation metrics (P/E 12.25, P/B 0.75)
Weaknesses
- declining profitability with negative ROIC vs. WACC
- weak liquidity ratios (current ratio 0.81, quick ratio 0.6)
- high debt levels (D/E 1.1) strain financial flexibility
Opportunities
- growth in healthcare benefits segment
- expanding specialty pharmacy and infusion services
- rising demand for integrated care and digital health solutions
Threats
- intense competition in healthcare plans and pharmacy services
- regulatory pressures in US healthcare
- margin erosion from rising operational costs and reimbursement cuts
CVS’s strong retail presence and integrated services provide a solid base, but profitability erosion and liquidity weaknesses demand caution. The company must leverage growth opportunities while managing regulatory and competitive risks to restore value creation.
Stock Price Action Analysis
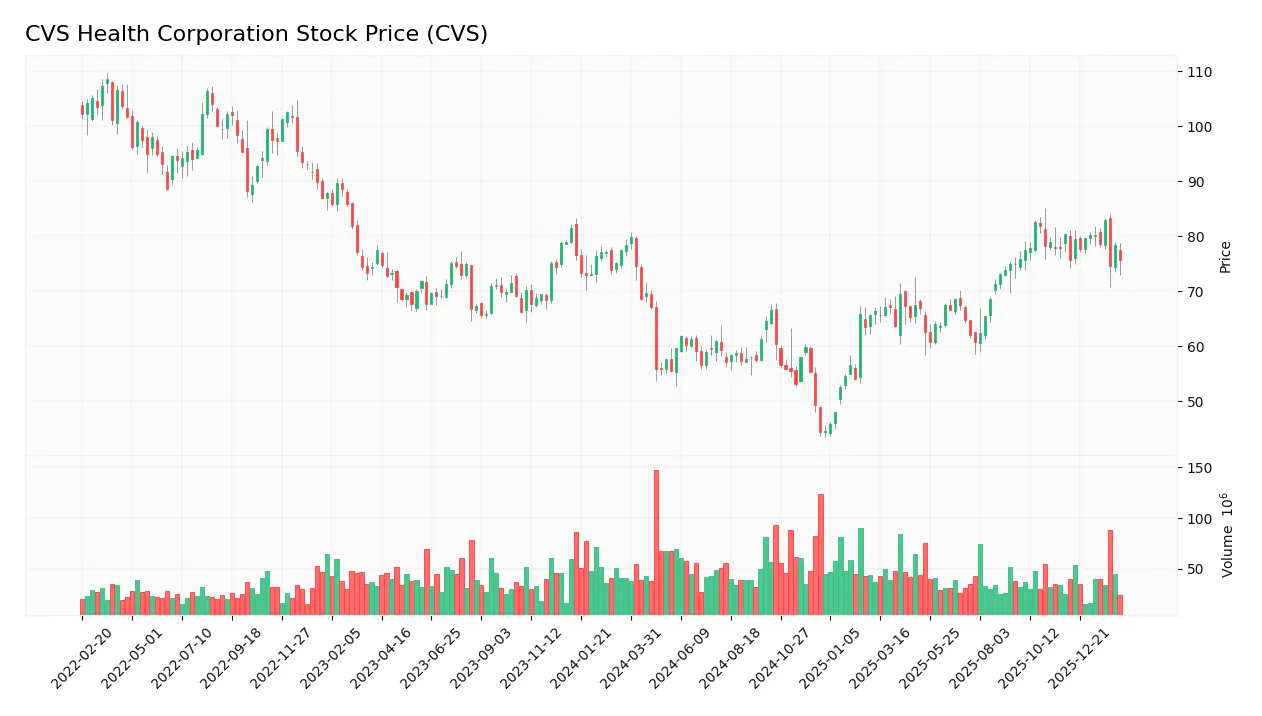
The weekly stock chart below illustrates CVS Health Corporation’s price movements over the last 12 months, highlighting key trend shifts and volatility patterns:
Trend Analysis
Over the past 12 months, CVS’s stock price declined by 3.64%, indicating a bearish trend. The price range fluctuated between 44.36 and 83.01, with volatility measured by a 9.4% standard deviation. The downtrend shows deceleration, suggesting a slowing pace of decline.
Volume Analysis
Trading volume over the last three months is decreasing overall. Buyer and seller volumes nearly balance, with a slight buyer edge at 50.15%, reflecting neutral buyer behavior. This indicates subdued market participation and cautious investor sentiment.
Target Prices
Analysts set a clear target consensus for CVS Health Corporation, reflecting cautious optimism.
| Target Low | Target High | Consensus |
|---|---|---|
| 90 | 103 | 94.92 |
The target range suggests moderate upside potential, with consensus near $95 signaling steady confidence in CVS’s valuation.

Don’t Let Luck Decide Your Entry Point
Optimize your entry points with our advanced ProRealTime indicators. You’ll get efficient buy signals with precise price targets for maximum performance. Start outperforming now!
Analyst & Consumer Opinions
This section examines CVS Health Corporation’s analyst ratings alongside consumer feedback to provide a balanced perspective.
Stock Grades
Here are the latest verified stock grades from recognized research firms for CVS Health Corporation:
| Grading Company | Action | New Grade | Date |
|---|---|---|---|
| Argus Research | Maintain | Buy | 2026-01-28 |
| B of A Securities | Maintain | Buy | 2026-01-27 |
| JP Morgan | Maintain | Overweight | 2025-12-17 |
| Bernstein | Maintain | Market Perform | 2025-12-12 |
| Truist Securities | Maintain | Buy | 2025-12-10 |
| Piper Sandler | Maintain | Overweight | 2025-12-10 |
| Barclays | Maintain | Overweight | 2025-12-10 |
| Morgan Stanley | Maintain | Overweight | 2025-12-10 |
| UBS | Maintain | Buy | 2025-12-10 |
| Baird | Maintain | Outperform | 2025-12-10 |
The consensus remains firmly positive with a “Buy” rating, reflecting broad confidence across major firms. Most grades emphasize stability, with no downgrades or sell recommendations noted.
Consumer Opinions
Consumers have mixed feelings about CVS Health Corporation, reflecting both loyalty to its convenience and frustration with certain service aspects.
| Positive Reviews | Negative Reviews |
|---|---|
| Convenient store locations and pharmacy hours. | Long wait times for prescription fulfillment. |
| Friendly and knowledgeable pharmacy staff. | Inconsistent customer service experience. |
| Wide selection of health and wellness products. | Prices sometimes higher than competitors. |
Overall, customers appreciate CVS’s accessibility and helpful staff. However, recurring complaints about wait times and pricing could weigh on satisfaction if unaddressed.
Risk Analysis
The table below summarizes key risks facing CVS Health Corporation, focusing on likelihood and potential impact:
| Category | Description | Probability | Impact |
|---|---|---|---|
| Financial Health | Altman Z-Score in the grey zone signals moderate bankruptcy risk amid weak liquidity ratios. | Medium | High |
| Profitability | Low net margin (1.24%) and ROE (6.11%) reflect operational challenges in a competitive sector. | High | Medium |
| Leverage | High debt-to-equity ratio (1.1) and negative interest coverage highlight refinancing risks. | High | High |
| Liquidity | Current ratio of 0.81 and quick ratio of 0.6 indicate weak short-term solvency. | High | Medium |
| Market Valuation | Favorable P/E (12.25) and P/B (0.75) ratios could limit upside, signaling value concerns. | Medium | Medium |
| Regulatory & Sector | Healthcare plan regulations and competitive retail pharmacy markets pose ongoing challenges. | Medium | Medium |
CVS’s greatest risks stem from its leveraged balance sheet and liquidity constraints, exacerbated by moderate profitability. The grey zone Altman Z-Score and negative interest coverage are red flags. Historically, companies in this sector with such profiles face refinancing pressure during tighter credit cycles. Vigilance on debt management is crucial.
Should You Buy CVS Health Corporation?
CVS appears to be a company with moderate profitability and deteriorating value creation, reflected in a very unfavorable moat due to declining ROIC. Despite a challenging leverage profile, the overall B rating suggests a cautiously favorable investment case.
Strength & Efficiency Pillars
CVS Health Corporation shows operational resilience with a gross margin of 13.77% and a stable net margin of 1.24%. Return on equity sits at a modest 6.11%, while return on invested capital (ROIC) is 3.61%, slightly below its weighted average cost of capital (WACC) at 4.6%. This indicates the company is currently shedding value rather than creating it. Asset turnover ratios are a bright spot, with 1.47 overall and 12.88 for fixed assets, reflecting efficient asset utilization despite profitability challenges.
Weaknesses and Drawbacks
CVS faces significant headwinds, evidenced by an Altman Z-Score of 2.19 placing it in the “grey zone,” signaling moderate bankruptcy risk. Leverage is high with a debt-to-equity ratio of 1.1, and liquidity is strained, as the current ratio of 0.81 and quick ratio of 0.6 both fall below safe thresholds. Interest coverage is negative, raising red flags about the company’s ability to service its debt. Additionally, a bearish stock trend (-3.64%) and decelerating price action reflect market skepticism.
Our Final Verdict about CVS Health Corporation
Despite operational strengths and strong Piotroski fundamentals (score 7), the grey zone Altman Z-Score warns of solvency risks that make CVS a cautious consideration. The profile might appear attractive to value-focused investors monitoring turnaround potential but remains too risky for conservative capital. Recent neutral buyer dominance and bearish technicals suggest a wait-and-see stance before committing capital.
Disclaimer: This content is for informational purposes only and does not constitute financial, investment, or other professional advice. Investing in financial markets involves a significant risk of loss, and past performance is not indicative of future results.
Additional Resources
- CVS Health Corporation (CVS) Under Pressure From Medicare Proposal, Argus Holds Positive View – Yahoo Finance (Feb 09, 2026)
- What to expect from CVS Q4 earnings – Seeking Alpha (Feb 09, 2026)
- CVS annual profit guidance misses Wall Street estimates – The Boston Globe (Feb 10, 2026)
- CVS HEALTH CORPORATION REPORTS FOURTH QUARTER AND FULL-YEAR 2025 RESULTS – PR Newswire (Feb 10, 2026)
- CVS Health grapples with high costs, strategic reset – Modern Healthcare News (Feb 10, 2026)
For more information about CVS Health Corporation, please visit the official website: cvshealth.com