Home > Analyses > Industrials > Cummins Inc.
Cummins Inc. powers industries and communities worldwide with its advanced diesel and natural gas engines, hybrid powertrains, and innovative emission solutions. As a stalwart in industrial machinery, Cummins shapes transportation, construction, and energy sectors through cutting-edge technology and a broad product portfolio. Renowned for quality and market influence, the company continually adapts to evolving energy demands. The key question now: do Cummins’ fundamentals still support its premium valuation and future growth prospects?

Table of contents
Business Model & Company Overview
Cummins Inc., founded in 1919 and headquartered in Columbus, Indiana, commands a leading position in the industrial machinery sector. It delivers a comprehensive ecosystem of diesel and natural gas engines, hybrid powertrains, and related components that serve diverse markets such as transportation, construction, and agriculture. The company’s multi-segment structure integrates Engine, Distribution, Components, Power Systems, and New Power to support global industrial power needs.
Cummins generates revenue through a balanced mix of hardware sales—engines and power systems—and recurring services like parts, remanufacturing, and repairs. Its footprint spans the Americas, Europe, and Asia, enabling strong exposure to global demand cycles. The company’s economic moat lies in its deep engineering expertise and broad aftermarket network, shaping the future of power solutions worldwide.
Financial Performance & Fundamental Metrics
I will analyze Cummins Inc.’s income statement, key financial ratios, and dividend payout policy to assess its core financial health and profitability trends.
Income Statement
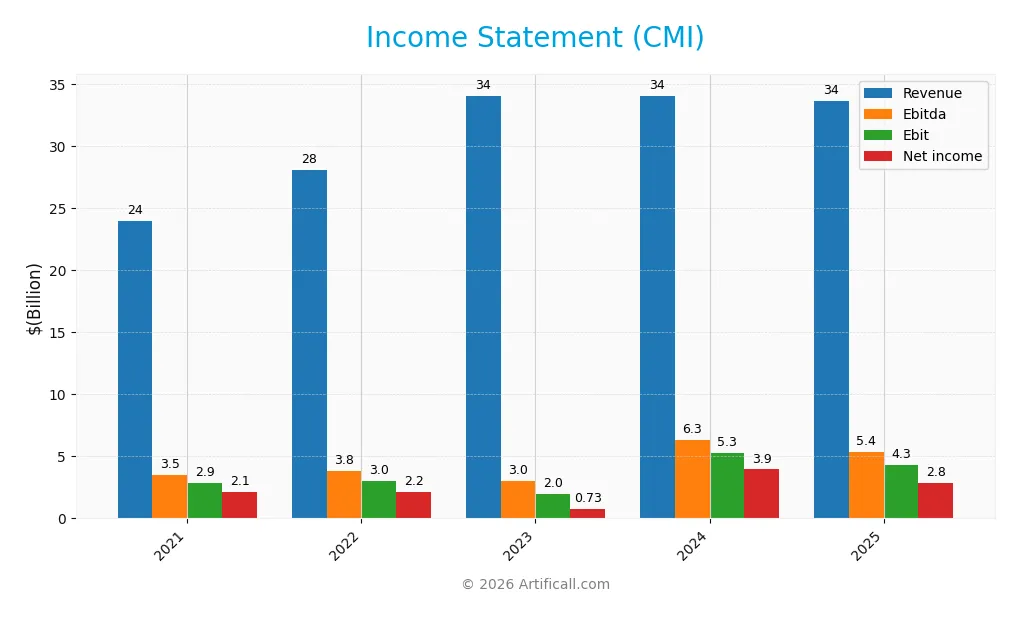
This table summarizes Cummins Inc.’s key income statement figures for fiscal years 2021 through 2025, reflecting revenue, profitability, and earnings per share trends.
| 2021 | 2022 | 2023 | 2024 | 2025 | |
|---|---|---|---|---|---|
| Revenue | 24.0B | 28.1B | 34.1B | 34.1B | 33.7B |
| Cost of Revenue | 18.3B | 21.4B | 25.8B | 25.7B | 25.2B |
| Operating Expenses | 3.0B | 3.8B | 6.5B | 4.7B | 4.5B |
| Gross Profit | 5.7B | 6.7B | 8.2B | 8.4B | 8.5B |
| EBITDA | 3.5B | 3.8B | 3.0B | 6.3B | 5.4B |
| EBIT | 2.9B | 3.0B | 2.0B | 5.3B | 4.3B |
| Interest Expense | 111M | 199M | 375M | 370M | 329M |
| Net Income | 2.1B | 2.2B | 735M | 3.9B | 2.8B |
| EPS | 14.7 | 15.2 | 5.2 | 28.6 | 20.6 |
| Filing Date | 2022-02-08 | 2023-02-14 | 2024-02-12 | 2025-02-11 | 2026-02-10 |
Income Statement Evolution
From 2021 to 2025, Cummins Inc. grew revenue by 40.2% but saw a slight 1.3% decline in 2025 alone. Net income increased 33.4% overall but fell 27% in the last year. Gross margin remained stable near 25.3%, while EBIT and net margins showed favorable levels despite recent margin compression.
Is the Income Statement Favorable?
In 2025, Cummins reported $33.7B revenue and $2.84B net income, yielding an 8.4% net margin, which is favorable against industry norms. EBIT margin stood at 12.8%, supported by controlled interest expense under 1%. However, recent declines in revenue, EBIT, and net income margins warn of near-term pressure despite solid fundamentals overall.
Financial Ratios
The following table summarizes Cummins Inc.’s key financial ratios for fiscal years 2021 through 2025, providing insight into profitability, liquidity, leverage, and valuation metrics:
| Ratios | 2021 | 2022 | 2023 | 2024 | 2025 |
|---|---|---|---|---|---|
| Net Margin | 8.9% | 7.7% | 2.2% | 11.6% | 8.4% |
| ROE | 25.1% | 24.0% | 8.3% | 38.4% | 23.0% |
| ROIC | 12.3% | 10.1% | 4.3% | 13.7% | 12.0% |
| P/E | 14.8 | 15.9 | 46.2 | 12.2 | 24.8 |
| P/B | 3.7 | 3.8 | 3.8 | 4.7 | 5.7 |
| Current Ratio | 1.74 | 1.27 | 1.18 | 1.31 | 1.76 |
| Quick Ratio | 1.12 | 0.77 | 0.74 | 0.80 | 1.16 |
| D/E | 0.54 | 0.93 | 0.81 | 0.74 | 0.59 |
| Debt-to-Assets | 19.5% | 27.6% | 22.5% | 24.1% | 21.3% |
| Interest Coverage | 24.4 | 14.7 | 4.7 | 10.1 | 12.1 |
| Asset Turnover | 1.01 | 0.93 | 1.06 | 1.08 | 0.99 |
| Fixed Asset Turnover | 5.43 | 5.08 | 5.05 | 4.95 | 4.84 |
| Dividend Yield | 2.56% | 2.49% | 2.71% | 2.01% | 1.50% |
Evolution of Financial Ratios
Cummins Inc.’s Return on Equity (ROE) peaked in 2024 before declining to 23.02% in 2025, indicating some volatility in profitability. The Current Ratio steadily improved, reaching 1.76 in 2025, signaling enhanced liquidity. Meanwhile, the Debt-to-Equity Ratio declined from 0.81 in 2023 to 0.59 in 2025, reflecting a moderate reduction in leverage over the period.
Are the Financial Ratios Favorable?
In 2025, Cummins posts a favorable ROE of 23.02% and a solid Return on Invested Capital (ROIC) of 12.01%, both above the weighted average cost of capital (8.51%), evidencing efficient capital allocation. Liquidity is strong with current and quick ratios above 1.1. Debt levels are moderate with a 21.3% debt-to-assets ratio and favorable interest coverage of 13.05. However, the price-to-book ratio at 5.7 appears high, marking an unfavorable market valuation. Overall, the financial ratios are slightly favorable.
Shareholder Return Policy
Cummins Inc. maintains a consistent dividend policy, with a payout ratio around 37% in 2025 and a dividend yield near 1.5%. Dividends per share have grown steadily, supported by free cash flow coverage of roughly 66%. The company also engages in share buybacks, enhancing returns.
This balanced approach combines dividends and buybacks, reflecting prudent capital allocation. While the payout ratio remains moderate, the policy appears sustainable, supporting long-term shareholder value without jeopardizing investment in growth or financial stability.
Score analysis
The radar chart below illustrates Cummins Inc.’s key financial scores across valuation, profitability, and leverage metrics:
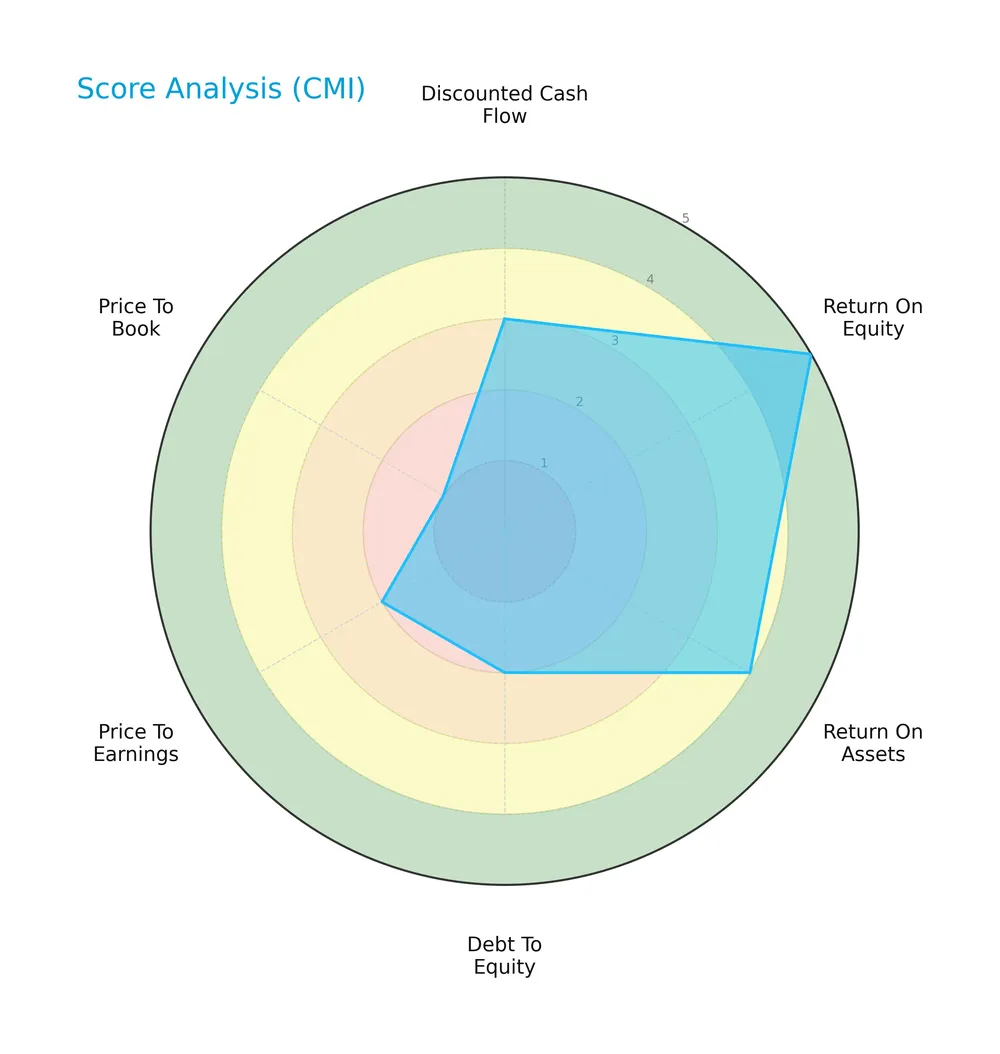
Cummins shows strong returns with a very favorable ROE score of 5 and favorable ROA of 4. However, its debt-to-equity ratio is unfavorable at 2, while valuation metrics—P/E at 2 and P/B at 1—signal less attractive pricing. The overall DCF score sits moderately at 3.
Analysis of the company’s bankruptcy risk
Cummins’ Altman Z-Score of 4.96 places it solidly in the safe zone, indicating low bankruptcy risk:

Is the company in good financial health?
The Piotroski Score diagram presents Cummins’ financial strength based on multiple criteria:

With a Piotroski Score of 5, Cummins ranks as average in financial health. This suggests moderate strength but leaves room for improvement in operational efficiency and profitability metrics.
Competitive Landscape & Sector Positioning
This sector analysis will examine Cummins Inc.’s strategic positioning, revenue segments, key products, competitors, and competitive advantages. I will assess whether Cummins holds a sustainable edge over its main rivals in the industrial machinery sector.
Strategic Positioning
Cummins Inc. operates a diversified product portfolio spanning engines, components, distribution, power systems, and emerging electrified power. Its geographic exposure balances a dominant US market ($19.4B in 2024) with significant revenues from China ($2.9B), India ($1.8B), and other international markets ($10B).
Revenue by Segment
The pie chart displays Cummins Inc.’s revenue distribution by segment for the fiscal year 2024, highlighting key contributors and segment size differences.
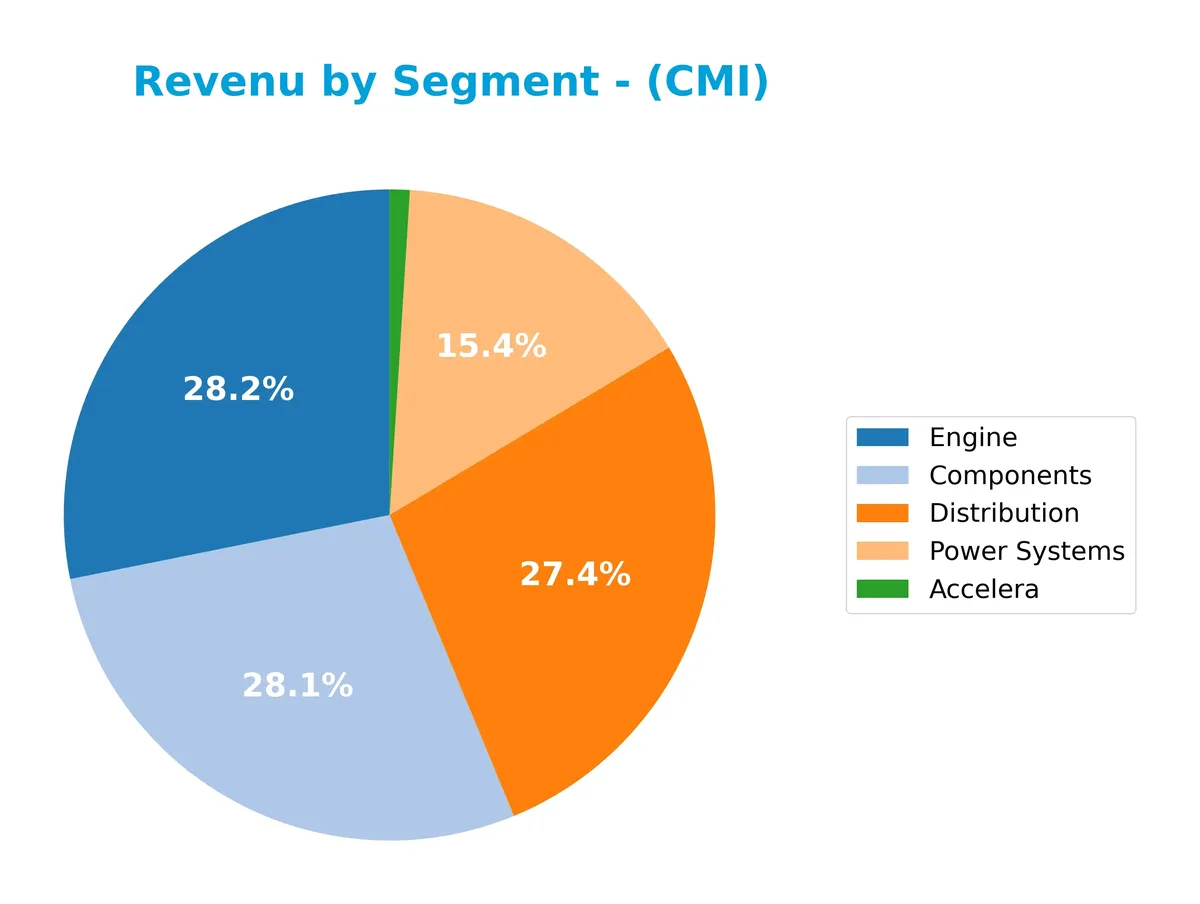
In 2024, Cummins’ revenue centers on Engines at $11.7B, Components at $11.7B, and Distribution at $11.4B, showing a balanced contribution among these core segments. Power Systems, with $6.4B, also plays a significant role. The Accelera segment, though smaller at $414M, suggests emerging focus areas. The recent year reflects steady growth in Components and Distribution, highlighting a diversification that mitigates concentration risks in Engine dominance.
Key Products & Brands
The table below details Cummins Inc.’s primary products and brand segments with concise descriptions:
| Product | Description |
|---|---|
| Engine | Diesel and natural gas engines for trucks, buses, RVs, construction, mining, marine, rail, and more. |
| Distribution | Sales and services network offering parts and engines to OEMs, dealers, and customers worldwide. |
| Components | Turbochargers, filtration systems, fuel systems, electronic controls, sensors, and related engine parts. |
| Power Systems | Power generation systems, high-horsepower engines, generators, controls, and alternators (Stamford, AVK). |
| New Power | Electrified powertrains, including battery, fuel cell, and hydrogen technologies for clean energy. |
| Accelera | (No description provided in source data.) |
Cummins’ portfolio spans traditional engines to advanced electrified power solutions. The company integrates components and distribution to support diverse industrial and transportation markets.
Main Competitors
Cummins Inc. faces competition from 24 key players, with the table listing the top 10 leaders by market capitalization:
| Competitor | Market Cap. |
|---|---|
| Eaton Corporation plc | 127B |
| Parker-Hannifin Corporation | 114B |
| Howmet Aerospace Inc. | 85B |
| Emerson Electric Co. | 76B |
| Illinois Tool Works Inc. | 73B |
| Cummins Inc. | 72B |
| AMETEK, Inc. | 48B |
| Roper Technologies, Inc. | 47B |
| Rockwell Automation, Inc. | 45B |
| Symbotic Inc. | 36B |
Cummins Inc. ranks 6th among its 24 competitors, holding about 64% of the top player’s market cap. It sits above both the average market cap of the top 10 (72B) and the sector median (32B). The company maintains a 10% gap from the next larger competitor, illustrating a solid but competitive position in industrial machinery.
Comparisons with competitors
Check out how we compare the company to its competitors:
Does CMI have a competitive advantage?
Cummins Inc. demonstrates a competitive advantage, creating value with an ROIC 3.5% above WACC, indicating efficient capital use despite a slightly declining profitability trend. Its diverse industrial portfolio, including diesel, natural gas, and electrified powertrains, supports resilient market positioning.
Looking ahead, Cummins targets growth through electrified power systems and hydrogen technologies, expanding into new power and aftermarket services. Its exposure to global markets, especially the U.S., China, and India, presents opportunities amid evolving emission standards and energy transitions.
SWOT Analysis
This SWOT analysis highlights Cummins Inc.’s key strengths, weaknesses, opportunities, and threats to guide strategic decisions.
Strengths
- Strong ROE at 23%
- Diverse product portfolio including diesel, natural gas, and electrified powertrains
- Global market presence with robust US and growing non-US sales
Weaknesses
- Declining ROIC trend signals weakening profitability
- High price-to-book ratio at 5.7 suggests valuation risk
- Recent revenue and net income growth slowing
Opportunities
- Expansion in electrification and hydrogen fuel technologies
- Growing demand in emerging markets like India and China
- Aftermarket services and remanufactured parts growth potential
Threats
- Regulatory pressure on emissions impacting diesel sales
- Intense competition in industrial machinery sector
- Global supply chain disruptions and commodity cost volatility
Cummins balances solid financial strength with innovation-driven growth potential. However, it must address profitability trends and valuation risks while navigating regulatory and competitive challenges.
Stock Price Action Analysis
The following weekly chart illustrates Cummins Inc. (CMI) stock price movement over the past 12 months:
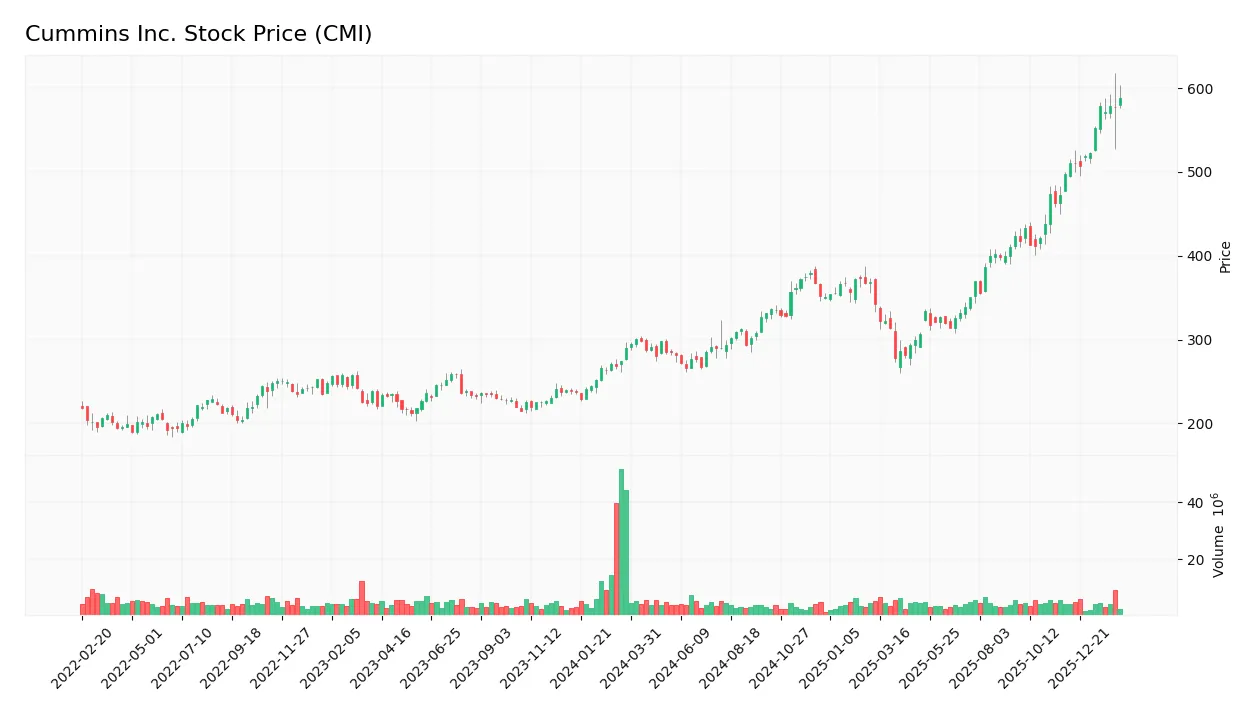
Trend Analysis
Over the past 12 months, CMI’s stock price rose 102.55%, indicating a strong bullish trend with clear acceleration. Volatility remains elevated, reflected by an 82.19 standard deviation. The stock ranged from a low of 266.48 to a high of 588.07, confirming robust upward momentum.
Volume Analysis
Trading volume shows a decreasing trend despite a 62.41% buyer volume dominance overall. In the recent three months, volume remains slightly buyer-dominant at 54.94%, suggesting cautious investor participation amid lower market activity.
Target Prices
Analysts set a robust target consensus for Cummins Inc., reflecting strong confidence in its outlook.
| Target Low | Target High | Consensus |
|---|---|---|
| 540 | 703 | 618.4 |
The target range spans from 540 to 703, with a consensus near 618, indicating optimistic growth expectations among leading analysts.

Don’t Let Luck Decide Your Entry Point
Optimize your entry points with our advanced ProRealTime indicators. You’ll get efficient buy signals with precise price targets for maximum performance. Start outperforming now!
Analyst & Consumer Opinions
This section examines analyst ratings and consumer feedback on Cummins Inc. to provide a balanced performance overview.
Stock Grades
Here are the latest verified stock grades for Cummins Inc. from established financial firms:
| Grading Company | Action | New Grade | Date |
|---|---|---|---|
| Raymond James | Maintain | Outperform | 2026-02-09 |
| Truist Securities | Maintain | Buy | 2026-02-06 |
| Wolfe Research | Downgrade | Peer Perform | 2026-01-26 |
| Barclays | Maintain | Overweight | 2026-01-23 |
| Wells Fargo | Maintain | Overweight | 2026-01-23 |
| JP Morgan | Maintain | Neutral | 2026-01-14 |
| Citigroup | Maintain | Buy | 2026-01-13 |
| Raymond James | Upgrade | Outperform | 2025-12-22 |
| Barclays | Upgrade | Overweight | 2025-12-19 |
| Truist Securities | Maintain | Buy | 2025-12-18 |
The consensus leans toward a Buy rating, reflecting steady confidence with minor downgrades. Most firms maintain favorable views, signaling stable analyst support for Cummins Inc.
Consumer Opinions
Consumers show a mixed but generally positive sentiment toward Cummins Inc., emphasizing product reliability amid some service challenges.
| Positive Reviews | Negative Reviews |
|---|---|
| Engines deliver consistent power and durability. | Customer service response times lag. |
| High fuel efficiency reduces operational costs. | Some parts are costly and hard to find. |
| Robust build quality suits heavy-duty applications. | Warranty claims process can be slow. |
Overall, customers praise Cummins for durable, fuel-efficient engines. However, recurring complaints on service speed and parts availability suggest areas needing improvement.
Risk Analysis
The following table summarizes key risks facing Cummins Inc., highlighting their likelihood and potential impact:
| Category | Description | Probability | Impact |
|---|---|---|---|
| Market Volatility | Stock price swings due to economic cycles and industrial sector sensitivity. | Medium | Medium |
| Valuation Concerns | High price-to-book ratio signals possible overvaluation relative to peers and historical norms. | High | Medium |
| Debt Levels | Moderate debt-to-equity ratio may pressure financial flexibility if interest rates rise. | Medium | Medium |
| Technological Shift | Transition to electrified powertrains demands heavy R&D investment and execution risk. | Medium | High |
| Supply Chain Disruptions | Global supply chain constraints could affect production and delivery timelines. | Medium | Medium |
| Regulatory Changes | Emission standards tightening could increase compliance costs or limit product applicability. | Medium | High |
Cummins operates in a cyclical industrial sector, historically vulnerable to economic downturns. Its elevated price-to-book ratio (5.7) signals valuation risk amid market corrections. The company’s safe Altman Z-score (4.96) reduces bankruptcy concerns. However, electrification and regulatory shifts pose significant strategic challenges requiring vigilant capital allocation.
Should You Buy Cummins Inc.?
Cummins Inc. appears to be a moderately profitable company with a slightly favorable moat, creating value despite declining returns. Its leverage profile suggests manageable debt, yet valuation metrics signal caution. Overall, the firm could be seen as a B-rated investment with moderate financial strength.
Strength & Efficiency Pillars
Cummins Inc. demonstrates solid operational efficiency with an ROE of 23.02% and an ROIC of 12.01%, both favorable indicators. Importantly, its ROIC exceeds the WACC of 8.51%, confirming that the company is a clear value creator. Margins remain stable, with a net margin of 8.44% and an EBIT margin of 12.75%. These metrics reflect disciplined capital allocation and effective cost management in a competitive industrial sector.
Weaknesses and Drawbacks
Cummins faces valuation challenges, including an unfavorable price-to-book ratio of 5.7, suggesting a premium market valuation that may limit upside. The price-to-earnings ratio at 24.76 is moderate but leans toward overvaluation compared to industry averages. Leverage remains neutral with a debt-to-equity ratio of 0.59, yet investors should watch liquidity carefully despite a comfortable current ratio of 1.76. Market sentiment is supportive with 62.41% buyer volume overall, reducing short-term selling pressure risk.
Our Final Verdict about Cummins Inc.
Cummins’ long-term fundamentals appear attractive, supported by value creation and strong profitability metrics. The bullish overall trend and sustained buyer dominance, albeit slightly reduced recently at 54.94%, suggest cautious optimism. Despite the elevated valuation multiples, the profile might appeal to investors seeking exposure to industrial value creators with moderate growth prospects. A wait-and-see approach may be prudent to optimize entry timing in light of recent market dynamics.
Disclaimer: This content is for informational purposes only and does not constitute financial, investment, or other professional advice. Investing in financial markets involves a significant risk of loss, and past performance is not indicative of future results.
Additional Resources
- Cummins Inc. Declares Quarterly Common Stock Dividend – Cummins (Feb 10, 2026)
- Cummins Inc. (NYSE:CMI) is largely controlled by institutional shareholders who own 86% of the company – Yahoo Finance (Feb 10, 2026)
- Applied Finance Capital Management LLC Sells 4,448 Shares of Cummins Inc. $CMI – MarketBeat (Feb 10, 2026)
- CUMMINS INC SEC 10-K Report – TradingView (Feb 10, 2026)
- Cummins Reports Strong Fourth Quarter and Full-Year 2025 Results, Records Charges Associated with Electrolyzer Business Strategic Review – Cummins (Feb 05, 2026)
For more information about Cummins Inc., please visit the official website: cummins.com