Home > Analyses > Industrials > CSX Corporation
CSX Corporation powers the backbone of North America’s freight movement, connecting industries and communities with unmatched rail logistics. As a dominant player in the railroad sector, CSX operates a vast 19,500-mile network, transporting everything from automotive parts to agricultural goods. Its reputation for efficiency and innovation drives critical supply chains across 23 states and beyond. The key question: does CSX’s robust infrastructure and market position still justify its current valuation and growth outlook?
Table of contents
Business Model & Company Overview
CSX Corporation, founded in 1978 and headquartered in Jacksonville, Florida, commands a dominant position in the railroads industry. Its vast ecosystem integrates rail-based freight transportation, intermodal container services, and complementary logistics solutions. The company’s network spans 19,500 route miles across 23 eastern states and parts of Canada, connecting industrial hubs with key markets and facilitating efficient bulk and consumer goods movement.
CSX generates revenue through a balanced mix of rail freight, intermodal services, and drayage operations. It operates approximately 3,500 locomotives and 30 terminals, serving sectors from automotive to agriculture across the Americas. This strategic footprint, coupled with its extensive infrastructure, creates a competitive advantage that fortifies its economic moat and shapes North America’s freight transportation landscape.
Financial Performance & Fundamental Metrics
I analyze CSX Corporation’s income statement, key financial ratios, and dividend payout policy to reveal its operational efficiency and shareholder returns.
Income Statement
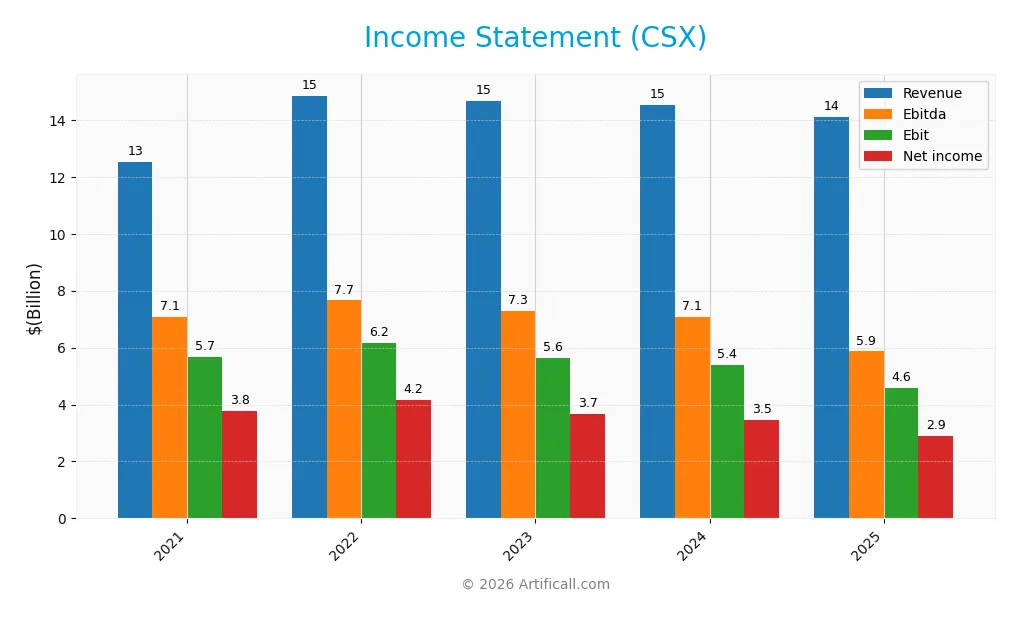
This table summarizes CSX Corporation’s key income statement figures for fiscal years 2021 through 2025, providing a clear view of its revenue, expenses, and profitability trends.
| 2021 | 2022 | 2023 | 2024 | 2025 | |
|---|---|---|---|---|---|
| Revenue | 12.5B | 14.9B | 14.7B | 14.5B | 14.1B |
| Cost of Revenue | 7.2B | 8.9B | 9.1B | 9.0B | 9.4B |
| Operating Expenses | 130M | 143M | 136M | 140M | 164M |
| Gross Profit | 5.3B | 5.9B | 5.6B | 5.5B | 4.7B |
| EBITDA | 7.1B | 7.7B | 7.3B | 7.1B | 5.9B |
| EBIT | 5.7B | 6.2B | 5.6B | 5.4B | 4.6B |
| Interest Expense | 722M | 742M | 809M | 832M | 844M |
| Net Income | 3.8B | 4.2B | 3.7B | 3.5B | 2.9B |
| EPS | 1.68 | 1.95 | 1.83 | 1.79 | 1.54 |
| Filing Date | 2022-02-16 | 2023-02-15 | 2024-02-14 | 2025-02-27 | 2026-02-12 |
Income Statement Evolution
CSX’s revenue grew 12.5% from 2021 to 2025 but declined 3.1% in the last year. Net income fell 23.6% over the full period and dropped 14.1% in 2025. Margins weakened overall; net margin declined by 32.1% over five years despite a still favorable gross margin near 33%. Operating expenses remained stable relative to revenue.
Is the Income Statement Favorable?
In 2025, CSX posted $14B revenue and $2.9B net income, yielding a 20.5% net margin, considered favorable. EBIT margin stood at 32.6%, reflecting solid operating efficiency despite a 6% interest expense ratio. However, the recent year’s declines in revenue, EBIT, and net margin signal unfavorable income statement trends, indicating caution in performance sustainability.
Financial Ratios
The following table summarizes key financial ratios for CSX Corporation over the past five fiscal years, reflecting profitability, valuation, liquidity, leverage, efficiency, and dividend performance:
| Ratios | 2021 | 2022 | 2023 | 2024 | 2025 |
|---|---|---|---|---|---|
| Net Margin | 30% | 28% | 25% | 24% | 21% |
| ROE | 28% | 33% | 31% | 28% | 22% |
| ROIC | 10% | 11% | 10% | 10% | 4% |
| P/E | 22.4 | 15.9 | 19.0 | 18.0 | 23.4 |
| P/B | 6.27 | 5.24 | 5.81 | 5.00 | 5.13 |
| Current Ratio | 1.73 | 1.56 | 1.04 | 0.86 | 0.22 |
| Quick Ratio | 1.58 | 1.42 | 0.91 | 0.73 | 0.22 |
| D/E | 1.25 | 1.47 | 1.59 | 1.52 | 1.43 |
| Debt-to-Assets | 42% | 44% | 45% | 44% | 43% |
| Interest Coverage | 7.15 | 7.80 | 6.76 | 6.45 | 5.36 |
| Asset Turnover | 0.31 | 0.35 | 0.35 | 0.34 | 0.32 |
| Fixed Asset Turnover | 0.37 | 0.43 | 0.42 | 0.40 | – |
| Dividend Yield | 1.0% | 1.3% | 1.3% | 1.5% | 1.4% |
Evolution of Financial Ratios
CSX’s Return on Equity (ROE) declined from a peak of 33% in 2022 to 22% in 2025, signaling reduced profitability. The Current Ratio dropped sharply below 1.0 by 2025, indicating deteriorating liquidity. Debt-to-Equity remained elevated around 1.4 to 1.6, reflecting sustained leverage with limited improvement in financial stability.
Are the Financial Ratios Fovorable?
In 2025, profitability ratios like net margin (20.5%) and ROE (21.95%) remain favorable, supported by an interest coverage ratio above 5. Liquidity ratios, including current and quick ratios near 0.22, raise red flags. Asset turnover and price-to-book ratios are unfavorable. Overall, ratios suggest a slightly unfavorable financial position, with leverage and liquidity as key concerns.
Shareholder Return Policy
CSX Corporation maintains a consistent dividend payout, with a 2025 payout ratio of 33.6% and a 1.44% yield. Dividend per share rose steadily from $0.37 in 2021 to $0.52 in 2025. The dividend is covered by free cash flow, though coverage ratios declined slightly.
The company also engages in share buybacks, complementing dividends to return capital. This balanced approach supports sustainable long-term shareholder value, assuming cash flow stability persists amid leverage levels and operating cash flow coverage.
Score analysis
The radar chart below highlights CSX Corporation’s key financial scores, providing a snapshot of its valuation and performance metrics:
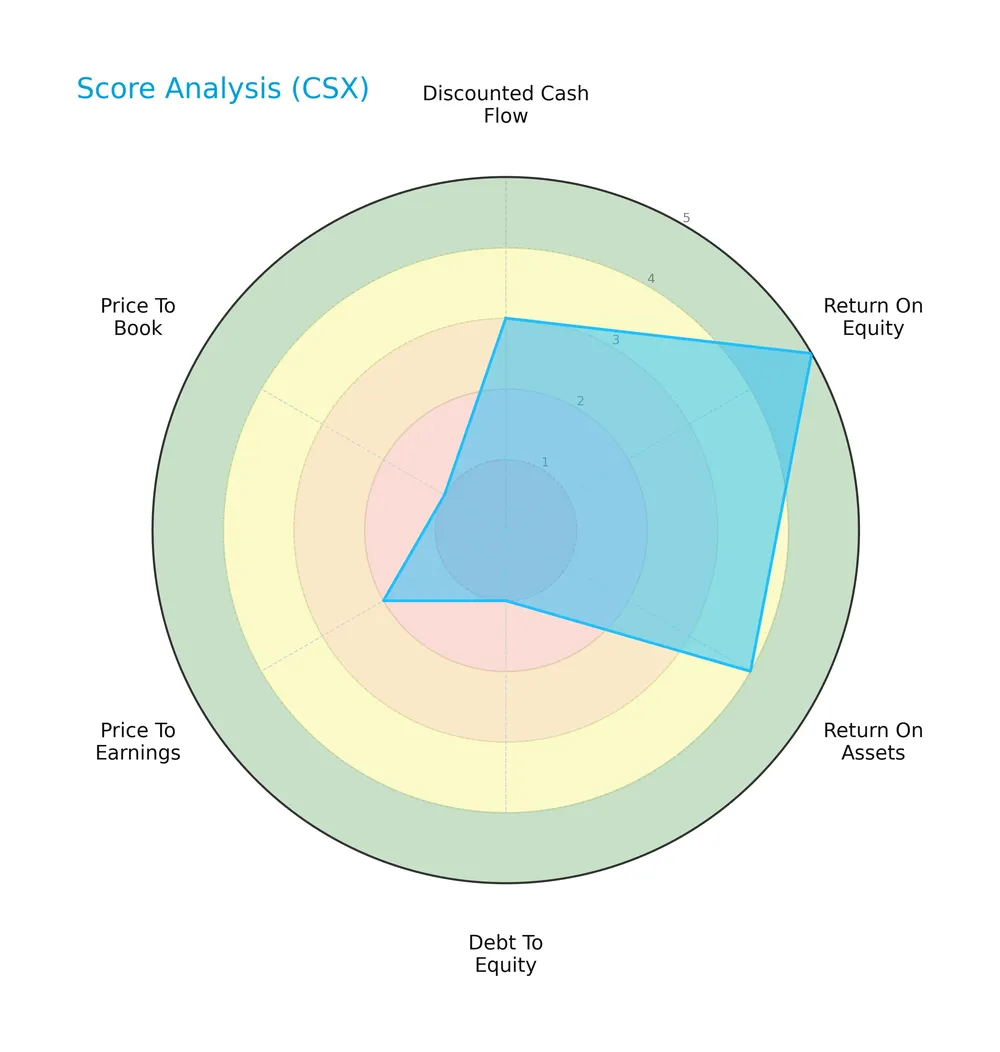
CSX’s return on equity scores very favorably at 5, with return on assets also strong at 4. However, debt-to-equity and price-to-book ratios score poorly at 1, signaling leverage and valuation concerns. Discounted cash flow and price-to-earnings metrics fall in the moderate to unfavorable range.
Analysis of the company’s bankruptcy risk
CSX Corporation’s Altman Z-Score places it in the grey zone, indicating a moderate risk of financial distress and bankruptcy in the near term:

Is the company in good financial health?
The Piotroski diagram below illustrates CSX’s financial health based on key profitability, liquidity, and efficiency criteria:

With a Piotroski Score of 5, CSX is in average financial health. This score suggests the company has a balanced mix of strengths and weaknesses, without clear dominance in financial robustness.
Competitive Landscape & Sector Positioning
This sector analysis examines CSX Corporation’s strategic positioning, revenue segments, key products, and main competitors. I will assess if CSX holds a competitive advantage over its peers in the railroads industry.
Strategic Positioning
CSX Corporation concentrates on rail-based freight with a diversified product portfolio including chemicals, coal, intermodal, and merchandise segments. Its geographic focus spans 23 eastern US states plus Ontario and Quebec, operating a 19,500 route-mile network to serve multiple industrial sectors.
Revenue by Segment
This pie chart illustrates CSX Corporation’s revenue distribution by segment for the fiscal year 2024, highlighting the company’s key business drivers.
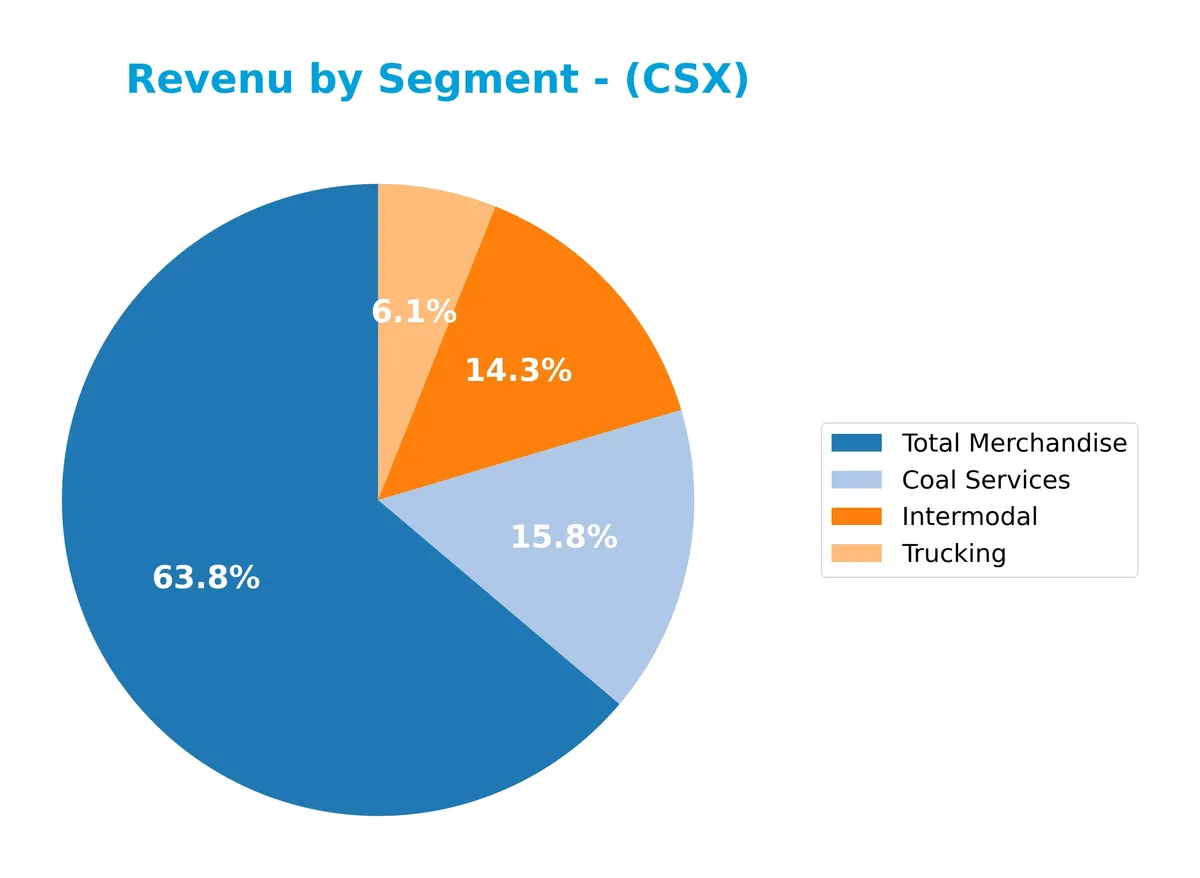
In 2024, Total Merchandise leads with $8.9B, demonstrating its dominance in CSX’s portfolio. Coal Services and Intermodal follow closely at $2.2B and $2B, respectively, showing relative stability. Trucking, though smaller at $844M, adds important diversification. The data indicates a concentration in merchandise transport, with Coal Services slightly declining, signaling a cautious shift in segment reliance for future growth.
Key Products & Brands
CSX Corporation’s key products and brands across its freight transportation services include:
| Product | Description |
|---|---|
| Coal Services | Transporting coal, coke, and iron ore to power plants, steel manufacturers, industrial plants, and exports. |
| Intermodal | Network of ~30 terminals for containerized freight, including drayage and rail-to-truck transfers. |
| Total Merchandise | Broad category encompassing chemicals, agricultural and food products, automotive, minerals, and more. |
| Trucking | Drayage services including pickup and delivery of intermodal shipments and connections to non-rail customers. |
| Chemicals | Transport of chemical products across CSX’s rail network. |
| Agricultural and Food Products | Rail freight services for agriculture and food sectors. |
| Automotive | Distribution centers and storage services supporting automotive industry logistics. |
| Fertilizers | Transportation of fertilizers as part of merchandise freight. |
| Forest Products | Rail transport of forest-related products. |
| Metals and Equipment | Freight services for metals and industrial equipment. |
| Minerals | Transportation of various minerals. |
| Other Services | Additional freight and logistics services beyond core segments. |
CSX’s diversified product portfolio spans critical freight categories, with a strong intermodal network and specialized services supporting industrial and consumer goods sectors across the eastern U.S. and parts of Canada.
Main Competitors
There are 4 competitors in the Industrials Railroads sector; the table shows the top 4 leaders by market capitalization:
| Competitor | Market Cap. |
|---|---|
| Union Pacific Corporation | 138B |
| CSX Corporation | 68B |
| Norfolk Southern Corporation | 65B |
| Westinghouse Air Brake Technologies Corporation | 37B |
CSX Corporation ranks 2nd among its competitors. It holds 55.1% of the market cap of the sector leader, Union Pacific. CSX’s valuation sits below the average market cap of the top 10 peers (77B) but above the sector median (66B). The company maintains a significant 81.5% market cap gap from the closest rival above it.
Comparisons with competitors
Check out how we compare the company to its competitors:
Does CSX have a competitive advantage?
CSX demonstrates a clear competitive advantage, with a very favorable moat status driven by a ROIC vastly exceeding its WACC. Its growing ROIC trend signals efficient capital allocation and sustained value creation.
Looking ahead, CSX’s extensive rail network and diversified freight services position it well to capitalize on evolving transportation demands. Opportunities include expanding intermodal services and leveraging its strategic presence in key U.S. and Canadian markets.
SWOT Analysis
This SWOT analysis highlights CSX Corporation’s key strategic factors shaping its current market position and future prospects.
Strengths
- strong moat with ROIC far above WACC
- favorable profitability margins
- extensive rail network across strategic US and Canadian regions
Weaknesses
- weak liquidity with low current and quick ratios
- high debt-to-equity ratio signaling leverage risk
- recent decline in revenue and profit growth
Opportunities
- expanding intermodal and logistics services
- increasing demand for sustainable freight solutions
- potential to optimize capital allocation and reduce debt
Threats
- economic slowdown reducing freight volumes
- rising interest rates increasing financing costs
- competitive pressure from trucking and alternative transport modes
CSX’s robust competitive advantage and profitability underpin its resilience. However, liquidity constraints and leverage pose risks that require prudent capital management. Growth hinges on leveraging logistics trends and managing external economic pressures.
Stock Price Action Analysis
The weekly stock chart for CSX Corporation shows price movements and volume trends over the past 12 months:
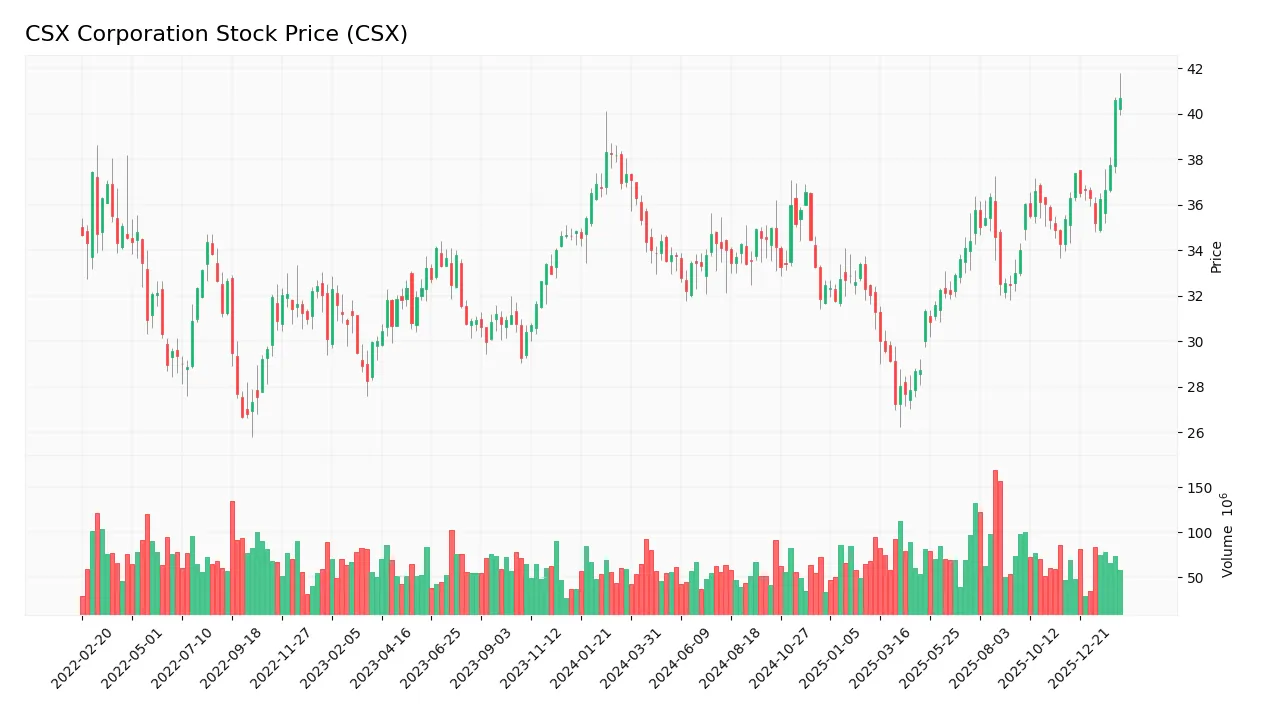
Trend Analysis
Over the past 12 months, CSX stock gained 8.97%, indicating a bullish trend with price acceleration. The price ranged from a low of 27.21 to a high of 40.7, with volatility measured by a 2.44 standard deviation.
Volume Analysis
Trading volume is increasing overall, with nearly balanced buyer (49.11%) and seller (50.89%) participation historically. Recently, buyer dominance surged to 73.12%, signaling strong buying interest and growing market participation.
Target Prices
The consensus target price for CSX Corporation reflects moderate upside potential.
| Target Low | Target High | Consensus |
|---|---|---|
| 30 | 45 | 39.11 |
Analysts expect CSX to trade between $30 and $45, with a consensus around $39, signaling cautious optimism in the stock’s near-term outlook.

Don’t Let Luck Decide Your Entry Point
Optimize your entry points with our advanced ProRealTime indicators. You’ll get efficient buy signals with precise price targets for maximum performance. Start outperforming now!
Analyst & Consumer Opinions
This section examines analyst grades and consumer feedback to provide a balanced view of CSX Corporation’s market perception.
Stock Grades
Here is a summary of recent verified analyst grades for CSX Corporation from leading financial firms:
| Grading Company | Action | New Grade | Date |
|---|---|---|---|
| Bernstein | Maintain | Market Perform | 2026-01-23 |
| Citigroup | Maintain | Buy | 2026-01-23 |
| Evercore ISI Group | Maintain | Outperform | 2026-01-23 |
| JP Morgan | Maintain | Overweight | 2026-01-12 |
| Morgan Stanley | Maintain | Equal Weight | 2025-12-08 |
| JP Morgan | Maintain | Overweight | 2025-10-20 |
| Barclays | Maintain | Overweight | 2025-10-20 |
| Baird | Maintain | Outperform | 2025-10-20 |
| UBS | Maintain | Buy | 2025-10-17 |
| Evercore ISI Group | Maintain | Outperform | 2025-10-17 |
The overall analyst stance remains steady with a bias toward positive outlooks, predominantly “Buy,” “Overweight,” and “Outperform” ratings. No recent downgrades or upgrades indicate consensus stability in CSX’s market position.
Consumer Opinions
CSX Corporation sparks mixed feelings among consumers, reflecting its operational strengths and areas needing improvement.
| Positive Reviews | Negative Reviews |
|---|---|
| Reliable freight service with timely deliveries | Customer service response times lag |
| Efficient logistics network reduces delays | Some complaints about pricing transparency |
| Strong safety record in operations | Occasional equipment breakdowns reported |
Consumers appreciate CSX’s dependable freight operations and safety focus. However, delays in customer support and pricing clarity remain notable pain points.
Risk Analysis
Below is a summary table of key risks facing CSX Corporation, including their likelihood and potential impact:
| Category | Description | Probability | Impact |
|---|---|---|---|
| Liquidity Risk | Extremely low current and quick ratios (0.22) indicate weak short-term liquidity. | High | High |
| Leverage Risk | Debt-to-equity ratio of 1.43 signals significant reliance on debt financing. | Medium | Medium |
| Valuation Risk | Elevated price-to-book ratio (5.13) suggests potential overvaluation compared to peers. | Medium | Medium |
| Operational Risk | Asset turnover of 0.32 implies inefficient use of assets, possibly affecting profitability. | Medium | Medium |
| Market Volatility | Beta of 1.29 shows stock is more volatile than the market, increasing risk in downturns. | High | Medium |
| Bankruptcy Risk | Altman Z-Score of 2.09 places CSX in the grey zone, indicating moderate bankruptcy risk. | Medium | High |
The most pressing risks are liquidity and moderate bankruptcy risk, marked by CSX’s very low current ratio and a grey-zone Altman Z-Score. Despite strong returns on invested capital, the company’s heavy debt and asset inefficiency warrant caution amid market volatility.
Should You Buy CSX Corporation?
CSX appears to be a company with improving profitability and a durable competitive moat, supported by strong value creation through ROIC well above WACC. Despite a challenging leverage profile and moderate overall rating of B, the analytical interpretation suggests cautious optimism.
Strength & Efficiency Pillars
CSX Corporation exhibits robust operational profitability with a net margin of 20.5% and a return on equity of 21.95%. The company is a clear value creator, as its return on invested capital (ROIC) stands at 392.02%, vastly exceeding its weighted average cost of capital (WACC) of 8.5%. This massive spread signals strong capital allocation and sustainable competitive advantage. I note that despite moderate revenue pressures, CSX maintains efficiency in generating returns well above industry costs.
Weaknesses and Drawbacks
CSX currently resides in the Altman Z-Score grey zone with a score of 2.09, indicating moderate bankruptcy risk and warranting caution. The firm’s leverage profile is a concern; debt-to-equity at 1.43 and an extremely low current ratio of 0.22 highlight liquidity stress. Valuation metrics also pose risks: a price-to-book ratio of 5.13 suggests a high premium, while the price-to-earnings ratio of 23.39 is neutral but on the upper side for industrial peers. These factors combined could pressure the stock under adverse market conditions.
Our Final Verdict about CSX Corporation
CSX presents a fundamentally strong profile with exceptional profitability and capital efficiency, but the moderate solvency risk reflected in its Altman Z-Score makes the investment profile somewhat speculative. Despite a bullish overall trend and strong buyer dominance recently, I believe cautious investors may prefer to monitor liquidity improvements before committing. The company’s value creation ability is compelling but tempered by its financial leverage and valuation concerns.
Disclaimer: This content is for informational purposes only and does not constitute financial, investment, or other professional advice. Investing in financial markets involves a significant risk of loss, and past performance is not indicative of future results.
Additional Resources
- CSX President and Chief Executive Officer to Address Barclays Industrial Select Conference – Yahoo Finance Singapore (Feb 12, 2026)
- Cornerstone Investment Partners LLC Sells 47,270 Shares of CSX Corporation $CSX – MarketBeat (Feb 12, 2026)
- CSX Announces $670M Locomotive Fleet Upgrade with Wabtec – Wabtec Corporation (Feb 09, 2026)
- CSX Stock Climbs After Q4 2025 Earnings Miss: What a $46 Target and 12% Upside Mean for Investors – TIKR.com (Feb 10, 2026)
- CSX inks a deal with Wabtec to modernize its fleet (CSX:NASDAQ) – Seeking Alpha (Feb 09, 2026)
For more information about CSX Corporation, please visit the official website: csx.com