In the intricate dance of logistics and transportation, CSX Corporation stands as a vital lifeline, shaping the way goods traverse the eastern United States. As a powerhouse in the railroad industry, CSX not only connects manufacturers and consumers but also drives the economy forward with its innovative rail-based freight services. With a robust network spanning 19,500 miles and a reputation for reliability, I now ponder: do CSX’s impressive fundamentals still align with its current market valuation, or is there untapped growth potential on the horizon?

Table of contents
Company Description
CSX Corporation, established in 1978 and headquartered in Jacksonville, Florida, is a prominent player in the rail transportation industry. The company operates a vast rail network spanning approximately 19,500 route miles across 23 states east of the Mississippi River, as well as parts of Canada. CSX provides a comprehensive range of rail-based freight services, including the transportation of intermodal containers, chemicals, agricultural products, and automotive goods. With a market capitalization of around $68B, CSX is a leader in the railroads sector, leveraging its extensive infrastructure and operational efficiency to cater to diverse customer needs. The company’s commitment to innovation and sustainability positions it as a key influencer in shaping the future of freight transportation.
Fundamental Analysis
In this section, I will analyze CSX Corporation’s income statement, financial ratios, and dividend payout policy to evaluate its investment potential.
Income Statement
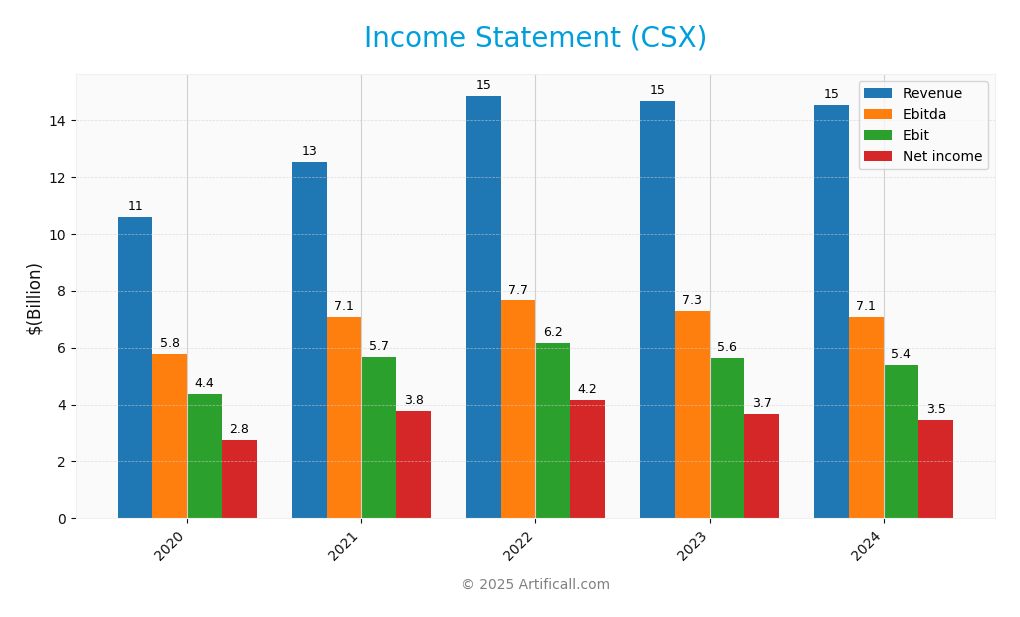
The following table presents the Income Statement for CSX Corporation over the past five fiscal years, showcasing key financial metrics that are crucial for evaluating the company’s performance.
| Metric | 2020 | 2021 | 2022 | 2023 | 2024 |
|---|---|---|---|---|---|
| Revenue | 10.58B | 12.52B | 14.85B | 14.66B | 14.54B |
| Cost of Revenue | 6.14B | 7.23B | 8.93B | 9.05B | 9.03B |
| Operating Expenses | 1.07B | 1.30B | 1.43B | 1.36B | 1.40B |
| Gross Profit | 4.44B | 5.29B | 5.93B | 5.60B | 5.51B |
| EBITDA | 5.76B | 7.09B | 7.66B | 7.27B | 7.07B |
| EBIT | 4.38B | 5.67B | 6.16B | 5.64B | 5.39B |
| Interest Expense | 0.75B | 0.72B | 0.74B | 0.81B | 0.83B |
| Net Income | 2.77B | 3.78B | 4.17B | 3.67B | 3.47B |
| EPS | 1.20 | 1.68 | 1.95 | 1.85 | 1.79 |
| Filing Date | 2021-02-10 | 2022-02-16 | 2023-02-15 | 2024-02-14 | 2025-02-27 |
Interpretation of Income Statement
Over the five-year period, CSX Corporation’s Revenue showed slight fluctuations, peaking in 2022 at 14.85B before declining to 14.54B in 2024. Net Income followed a similar trend, with a high of 4.17B in 2022, decreasing to 3.47B in 2024. Despite these declines, gross profit margins have remained relatively stable, indicating effective cost management. In 2024, the company’s margins faced pressure, yet EBITDA remained robust, showcasing CSX’s operational efficiency. The decrease in both revenue and net income in the recent year suggests a need for strategic adjustments to revitalize growth and enhance profitability.
Financial Ratios
The following table summarizes the financial ratios for CSX Corporation over the most recent years.
| Ratios | 2021 | 2022 | 2023 | 2024 |
|---|---|---|---|---|
| Net Margin | 30.19% | 28.05% | 25.03% | 23.87% |
| ROE | 28.01% | 32.99% | 30.62% | 27.76% |
| ROIC | 10.24% | 11.24% | 10.50% | 10.20% |
| P/E | 22.38 | 15.88 | 18.98 | 18.00 |
| P/B | 6.27 | 5.24 | 5.81 | 4.99 |
| Current Ratio | 1.73 | 1.56 | 1.04 | 0.86 |
| Quick Ratio | 1.58 | 1.42 | 0.91 | 0.73 |
| D/E | 1.25 | 1.47 | 1.59 | – |
| Debt-to-Assets | 41.56% | 44.22% | 45.07% | 44.40% |
| Interest Coverage | 7.15 | 7.80 | 6.76 | 6.45 |
| Asset Turnover | 0.31 | 0.35 | 0.35 | – |
| Fixed Asset Turnover | 0.37 | 0.43 | 0.42 | – |
| Dividend Yield | 0.99% | 1.29% | 1.27% | 1.49% |
Interpretation of Financial Ratios
CSX Corporation’s financial ratios from 2024 indicate a mixed performance. The current ratio stands at 0.861, suggesting liquidity concerns as it is below the ideal threshold of 1. The solvency ratio is 0.170, highlighting a higher level of debt relative to assets, which may pose long-term financial risks. Profitability metrics show a net profit margin of 23.87% and an EBITDA margin of 48.65%, reflecting strong operational efficiency. However, the price-to-earnings (P/E) ratio of 18.00 indicates the stock may be overvalued relative to earnings. Overall, while profitability is solid, liquidity and solvency ratios raise potential concerns for investors.
Evolution of Financial Ratios
Over the past five years, CSX’s financial ratios have shown a downward trend in liquidity, with the current ratio declining from 2.20 in 2020 to 0.861 in 2024. Conversely, profitability ratios have remained relatively stable, indicating a consistent ability to generate profits despite increasing debt levels.
Distribution Policy
CSX Corporation maintains a balanced distribution strategy, with a dividend payout ratio of 26.8% and a dividend yield of approximately 1.49%. The annual dividend per share has shown a steady increase, reflecting a commitment to returning value to shareholders. Additionally, the company engages in share buybacks, which can enhance shareholder value by reducing the number of outstanding shares. While the current distribution policy appears sustainable, potential risks include market volatility and operational challenges that may impact cash flow. Overall, CSX’s distribution strategy supports long-term value creation for shareholders.
Sector Analysis
CSX Corporation operates in the railroads industry, providing essential freight transportation services across the eastern United States, with a robust network and diverse product offerings. Key competitors include Union Pacific and Norfolk Southern, while CSX’s competitive advantages lie in its extensive route network and intermodal capabilities. A SWOT analysis reveals strengths in operational efficiency, weaknesses in dependence on economic cycles, opportunities in expanding intermodal services, and threats from regulatory changes and competition.
Strategic Positioning
CSX Corporation holds a significant position in the rail transportation industry, boasting a strong market share with a rail network of approximately 19,500 route miles across 23 states. As of now, its market cap stands at around $68B. Competitive pressure remains high, with other major railroads vying for market share, particularly in intermodal services. Additionally, technological advancements and disruptions in logistics and transportation are reshaping the landscape, requiring CSX to adapt and innovate. The company’s ability to leverage its extensive network and optimize operations will be crucial in maintaining its competitive edge.
Revenue by Segment
The following pie chart illustrates CSX Corporation’s revenue distribution across various segments for the fiscal year 2024, providing insight into the company’s operational focus.
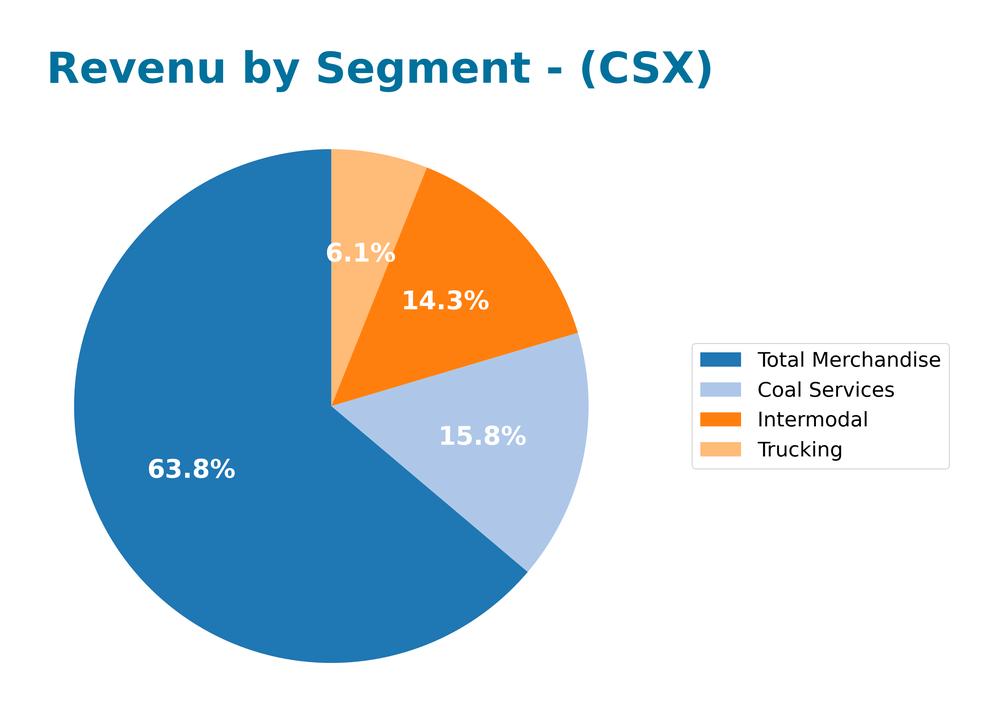
In FY 2024, CSX’s revenue was predominantly driven by its Total Merchandise segment, which accounted for 8.9B. Notably, Coal Services and Intermodal contributed 2.2B and 2B, respectively, indicating their importance in the revenue mix. Compared to FY 2023, where Total Merchandise also led at 8.7B, there was slight growth overall, but Coal Services saw a decline from 2.5B. This reversed trend raises concerns around reliance on coal, particularly in a shifting energy landscape, which could expose the company to margin risks moving forward.
Key Products
CSX Corporation provides a range of rail-based freight transportation services that are essential for various industries. Below is a table summarizing the key products offered by the company:
| Product | Description |
|---|---|
| Rail Freight Transportation | Core service providing transportation of bulk commodities, including chemicals, agricultural products, and metals. |
| Intermodal Container Services | Transportation of intermodal containers and trailers across a network of approximately 30 terminals. |
| Drayage Services | Pickup and delivery of intermodal shipments, connecting rail to truck transport for efficient distribution. |
| Automotive Logistics | Distribution centers and storage locations specifically serving the automotive industry. |
| Bulk Commodity Operations | Transporting coal, coke, and iron ore to power plants and steel manufacturers, including export services. |
| Rail-to-Truck Transfers | Services facilitating the transfer of products like plastics and ethanol from rail to trucks. |
These products are integral to CSX’s operations and contribute significantly to its market presence in the rail transportation industry.
Main Competitors
In the competitive landscape of the rail transportation industry, CSX Corporation is up against several formidable players that impact market dynamics.
| Company | Market Cap |
|---|---|
| Illinois Tool Works Inc. | 73.1B |
| Cummins Inc. | 70.3B |
| Quanta Services, Inc. | 68.4B |
| Canadian Pacific Kansas City Ltd. | 68.2B |
| Republic Services, Inc. | 67.7B |
| Norfolk Southern Corporation | 66.0B |
| FedEx Corporation | 64.7B |
| Canadian National Railway Company | 61.5B |
| Thomson Reuters Corporation | 60.1B |
| United Rentals, Inc. | 51.8B |
| CSX Corporation | 67.6B |
The main competitors in the rail transportation sector include established companies like Norfolk Southern and Canadian Pacific, along with others in related industrial sectors. This market operates primarily in North America, with significant implications for logistics and supply chain management across the region.
Competitive Advantages
CSX Corporation holds several competitive advantages that position it favorably in the railroad industry. With a robust network of approximately 19,500 route miles and a fleet of 3,500 locomotives, CSX efficiently connects key markets across the eastern U.S. The company’s focus on intermodal transportation and diverse freight services, including chemicals and agricultural products, enhances its market presence. Looking ahead, CSX plans to explore new opportunities in emerging markets and invest in innovative technologies to improve operational efficiency, which could drive growth and strengthen its competitive edge in the evolving transportation landscape.
SWOT Analysis
This SWOT analysis evaluates CSX Corporation’s strategic position in the rail transportation industry.
Strengths
- Strong market presence
- Extensive rail network
- Diverse service offerings
Weaknesses
- High operational costs
- Vulnerability to economic downturns
- Aging infrastructure
Opportunities
- Growth in intermodal transportation
- Expansion into new markets
- Increasing demand for rail freight
Threats
- Competition from other transport modes
- Regulatory challenges
- Economic fluctuations
Overall, CSX Corporation possesses robust strengths and significant opportunities that can drive future growth. However, it must effectively manage its weaknesses and external threats to maintain its competitive edge and enhance shareholder value.
Stock Analysis
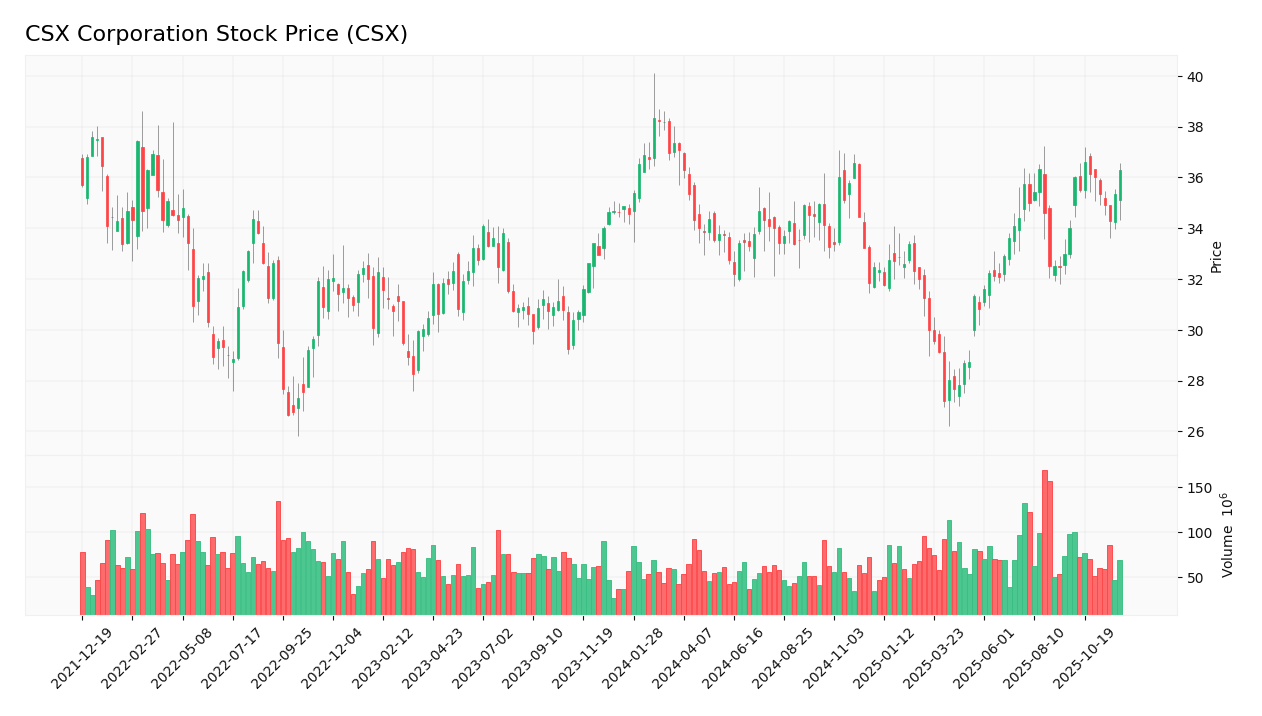
CSX Corporation has exhibited notable price movements over the past year, showcasing a bullish trend characterized by a 4.13% increase in stock price, alongside significant volatility. This dynamic environment has provided traders and investors with key insights into market behavior.
Trend Analysis
Over the past year, CSX’s stock price has increased by 4.13%. This positive change indicates a bullish trend, as it exceeds the +2% threshold. The stock has experienced notable highs of $38.33 and lows of $27.21, with an acceleration in price movement observed in recent months. The standard deviation of 2.31 suggests moderate volatility, reflecting fluctuations that investors should consider when evaluating potential entry points.
Volume Analysis
Analyzing trading volumes over the last three months reveals an increasing volume trend. The total volume during this period reached approximately 7.89B shares, with buyer volume at 3.77B and seller volume at 4.07B. The recent data indicates a slightly buyer-dominant sentiment, with buyers accounting for 53.84% of the recent volume. This suggests a positive investor sentiment, signaling growing interest in CSX shares amidst a competitive market landscape.
Analyst Opinions
Recent recommendations for CSX Corporation (CSX) indicate a strong consensus towards a “buy” rating. Analysts, including those from major firms, have highlighted CSX’s robust return on equity (ROE) and return on assets (ROA), both scoring 5, as key drivers for their positive outlook. The company also received an A- rating overall, reflecting solid fundamentals despite a mixed performance in price-to-earnings and price-to-book ratios. Given these insights, I believe CSX presents a compelling investment opportunity for the current year.
Stock Grades
CSX Corporation has received consistent evaluations from reputable grading companies. Below is a summary of the latest stock grades:
| Grading Company | Action | New Grade | Date |
|---|---|---|---|
| Barclays | Maintain | Overweight | 2025-10-20 |
| JP Morgan | Maintain | Overweight | 2025-10-20 |
| Baird | Maintain | Outperform | 2025-10-20 |
| Raymond James | Maintain | Outperform | 2025-10-17 |
| Jefferies | Maintain | Buy | 2025-10-17 |
| UBS | Maintain | Buy | 2025-10-17 |
| TD Cowen | Maintain | Buy | 2025-10-17 |
| Evercore ISI Group | Maintain | Outperform | 2025-10-17 |
| Citigroup | Maintain | Buy | 2025-10-13 |
| JP Morgan | Maintain | Overweight | 2025-10-08 |
The overall trend in grades for CSX indicates a strong consensus among analysts, with multiple firms maintaining their positive outlooks. Notably, the grades reflect a stable sentiment, particularly with several companies reiterating their “Overweight” and “Buy” ratings, suggesting confidence in the company’s performance moving forward.
Target Prices
The consensus target prices for CSX Corporation indicate a balanced outlook among analysts.
| Target High | Target Low | Consensus |
|---|---|---|
| 45 | 34 | 39.86 |
Analysts expect CSX’s stock to reach a consensus target of approximately 39.86, suggesting a moderate growth potential within a defined range.
Consumer Opinions
Consumer sentiment about CSX Corporation reflects a mix of satisfaction and concern, showcasing both the strengths and challenges faced by the company in the transportation sector.
| Positive Reviews | Negative Reviews |
|---|---|
| “Reliable service with timely deliveries.” | “Customer service needs significant improvement.” |
| “Great efficiency in logistics management.” | “Frequent price increases are frustrating.” |
| “Strong commitment to sustainability initiatives.” | “Limited communication during disruptions.” |
Overall, consumer feedback indicates that CSX Corporation is praised for its reliability and efficiency, while common criticisms revolve around customer service and pricing issues.
Risk Analysis
In evaluating CSX Corporation, it is crucial to understand the various risks that may impact its performance.
| Category | Description | Probability | Impact |
|---|---|---|---|
| Market Volatility | Fluctuations in market demand can affect shipping volumes. | High | High |
| Regulatory Changes | New environmental regulations may increase operational costs. | Medium | High |
| Economic Downturn | A recession could reduce freight demand significantly. | High | Medium |
| Competition | Increased competition from other transport companies could erode market share. | Medium | Medium |
| Technological Disruption | Advances in alternative transport methods may challenge traditional rail services. | Low | High |
Among these risks, market volatility and economic downturns are the most likely and impactful, with potential to significantly affect CSX’s revenue and profitability.
Should You Buy CSX Corporation?
CSX Corporation demonstrates strong profitability with a net profit margin of 23.87% in 2025 and a solid return on invested capital (ROIC) of 10.20%. The company has a significant level of debt, with a debt-to-equity ratio of 1.70, contributing to a weighted average cost of capital (WACC) of 8.47%. The rating of A- indicates solid fundamentals, though the recent trend suggests potential concerns in capital expenditure management, with a negative capital expenditure percentage of -15.40%.
Favorable signals
In the financial assessment of CSX Corporation, there are several favorable elements to highlight. The company shows a strong gross margin of 37.87%, an EBIT margin of 37.05%, and a net margin of 23.87%. Additionally, the return on equity (ROE) stands at a robust 27.76%, and the return on invested capital (ROIC) is at 10.2%, which indicates effective capital utilization. Furthermore, the interest coverage ratio of 6.47 suggests that the company can comfortably meet its interest obligations.
Unfavorable signals
Conversely, there are several unfavorable elements present in the financial data. The revenue growth is negative at -0.8%, and the gross profit growth has also declined by -1.73%. Moreover, the operating expenses compared to revenue growth show a decrease of -0.8%, while EBIT growth is down by -4.45%. The net margin growth is negative at -4.64%, and EPS growth has declined by -3.24%. Additionally, the price-to-book ratio is at 5.0, indicating overvaluation, and the current ratio of 0.86 and quick ratio of 0.73 suggest potential liquidity issues. Lastly, the debt-to-equity ratio stands at 1.52, which may indicate a high debt level.
Conclusion
Overall, the income statement evaluation is unfavorable, while the ratios evaluation also reflects an unfavorable outlook. Given the recent seller volume surpassing the buyer volume, it might be prudent to wait for buyers to return before making any investment decisions regarding CSX Corporation.
Disclaimer: This article is not financial advice. Each investor is responsible for their own investment decisions.
Additional Resources
- Is CSX Corporation Stock Underperforming the S&P 500? – Yahoo Finance (Dec 01, 2025)
- Service with Purpose – CSX.com (Aug 28, 2025)
- How A US$40 Million Derailment Hit At CSX (CSX) Has Changed Its Investment Story – simplywall.st (Dec 05, 2025)
- CSX Corporation $CSX Shares Sold by River Road Asset Management LLC – MarketBeat (Dec 02, 2025)
- Residents Celebrate Small Win in Dunnellon Railroad Tie Dispute – WCJB | TV20 (Dec 05, 2025)
For more information about CSX Corporation, please visit the official website: csx.com