Home > Analyses > Real Estate > Crown Castle Inc.
Crown Castle powers the digital age by connecting millions through its vast network of cell towers and fiber infrastructure. It dominates the U.S. communications landscape with over 40,000 towers and 80,000 route miles of fiber. Renowned for reliability and innovation, Crown Castle fuels essential wireless and data services that drive modern business and daily life. The question now is whether its strong fundamentals still justify its hefty market valuation and growth prospects.
Table of contents
Business Model & Company Overview
Crown Castle Inc., founded in 1998 and headquartered in Houston, TX, dominates the U.S. communications infrastructure sector. It operates a vast ecosystem of over 40,000 cell towers and 80,000 route miles of fiber. This network supports small cells and fiber solutions, seamlessly connecting cities and communities to vital data and wireless services. Crown Castle’s core mission centers on enabling innovation and information flow across the nation.
The company’s revenue engine balances leasing of cell towers with fiber infrastructure services, creating a steady stream of recurring income. Its strategic footprint spans every major U.S. market, positioning it as a critical backbone for wireless connectivity. Crown Castle’s economic moat lies in its expansive, hard-to-replicate infrastructure, which underpins the future of digital communication in America.
Financial Performance & Fundamental Metrics
I analyze Crown Castle Inc.’s income statement, key financial ratios, and dividend payout policy to assess its operational efficiency and shareholder returns.
Income Statement
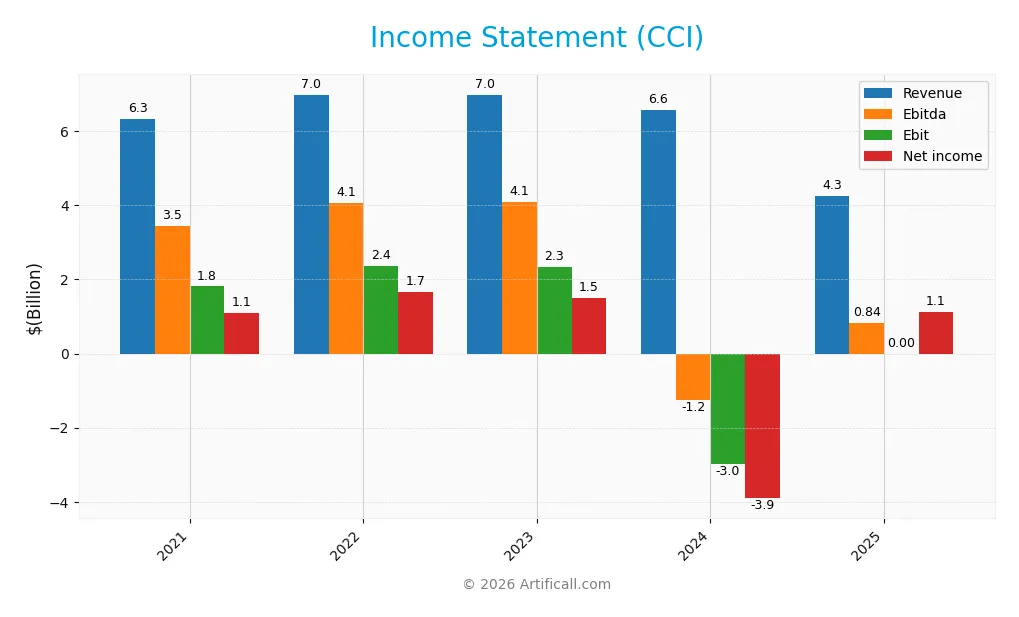
The following table summarizes Crown Castle Inc.’s key income statement figures for fiscal years 2021 through 2025, reported in USD.
| 2021 | 2022 | 2023 | 2024 | 2025 | |
|---|---|---|---|---|---|
| Revenue | 6.34B | 6.99B | 6.98B | 6.57B | 4.27B |
| Cost of Revenue | 1.99B | 2.07B | 1.98B | 1.85B | 1.45B |
| Operating Expenses | 2.35B | 2.49B | 2.63B | 7.66B | 739M |
| Gross Profit | 4.35B | 4.92B | 5.00B | 4.72B | 2.82B |
| EBITDA | 3.46B | 4.07B | 4.10B | -1.24B | 2.77B |
| EBIT | 1.81B | 2.36B | 2.35B | -2.98B | 2.08B |
| Interest Expense | 632M | 673M | 821M | 900M | 959M |
| Net Income | 1.10B | 1.68B | 1.50B | -3.90B | 444M |
| EPS | 2.54 | 3.87 | 3.46 | -8.98 | 1.02 |
| Filing Date | 2022-02-22 | 2023-02-24 | 2024-02-23 | 2025-03-14 | 2026-02-23 |
Income Statement Evolution
From 2021 to 2025, Crown Castle’s revenue declined by 33%, while net income fell nearly 60%. Gross margin remained robust around 66%, but net margin contracted by 40%. The company suffered a steep revenue drop in 2025, shrinking 35% year-over-year, yet achieved a 170% EBIT rebound, suggesting improved operational efficiency despite top-line pressure.
Is the Income Statement Favorable?
In 2025, Crown Castle reported $4.27B revenue with a 10.4% net margin, reflecting a recovery from a prior net loss. EBIT margin of 48.7% signals strong core profitability, but a 22.5% interest burden weighs heavily. The fundamentals show mixed signals: operational improvements counterbalanced by declining sales and significant interest expense, yielding a neutral overall income statement profile.
Financial Ratios
The following table summarizes key financial ratios for Crown Castle Inc. (CCI) over the last five fiscal years:
| Ratios | 2021 | 2022 | 2023 | 2024 | 2025 |
|---|---|---|---|---|---|
| Net Margin | 17% | 24% | 22% | -59% | 10% |
| ROE | 13% | 22% | 24% | 29% | -27% |
| ROIC | 5.3% | 6.4% | 6.3% | -9.3% | 6.8% |
| P/E | 82.3 | 35.1 | 33.3 | -10.1 | 87.1 |
| P/B | 10.9 | 7.9 | 7.8 | -296.2 | -23.6 |
| Current Ratio | 0.62 | 0.45 | 0.40 | 0.50 | 0.26 |
| Quick Ratio | 0.62 | 0.45 | 0.40 | 0.50 | 0.26 |
| D/E | 3.3 | 3.8 | 4.5 | -223.0 | -18.1 |
| Debt-to-Assets | 69% | 72% | 75% | 90% | 94% |
| Interest Coverage | 3.2 | 3.6 | 2.9 | -3.3 | 2.2 |
| Asset Turnover | 0.16 | 0.18 | 0.18 | 0.20 | 0.14 |
| Fixed Asset Turnover | 0.29 | 0.32 | 0.32 | 0.31 | 0.36 |
| Dividend Yield | 2.6% | 4.4% | 5.4% | 6.9% | 5.4% |
Evolution of Financial Ratios
Return on Equity (ROE) showed a steep decline, turning negative by 2025 at -27.16%. The Current Ratio steadily worsened, dropping to a low 0.26, indicating weaker liquidity. Debt-to-Equity ratio improved substantially, turning strongly negative at -18.08, reflecting an unusual capital structure. Profitability margins improved sharply in 2025 after losses in 2024.
Are the Financial Ratios Favorable?
Profitability is mixed; net margin is favorable at 10.41%, but ROE remains deeply negative, signaling shareholder returns issues. Liquidity ratios are unfavorable, with very low current and quick ratios, posing short-term risk. Leverage metrics are concerning, showing high debt-to-assets (93.81%) despite a favorable debt-to-equity ratio. Efficiency ratios like asset turnover are weak. Overall, the financial ratios appear slightly unfavorable for 2025.
Shareholder Return Policy
Crown Castle Inc. pays dividends with a low payout ratio near 5%, supporting a stable annual yield around 5.4%. Dividend payments align well with free cash flow, indicating coverage by operational cash generation. The company also engages in share buybacks, complementing its capital return strategy.
Despite high debt levels, the dividend and buyback policy appears sustainable given consistent free cash flow. This approach balances rewarding shareholders while maintaining financial flexibility. However, the low current ratio and leverage warrant monitoring to ensure long-term value preservation.
Score analysis
The radar chart below highlights key financial metrics for Crown Castle Inc. to provide a snapshot of its valuation and profitability scores:
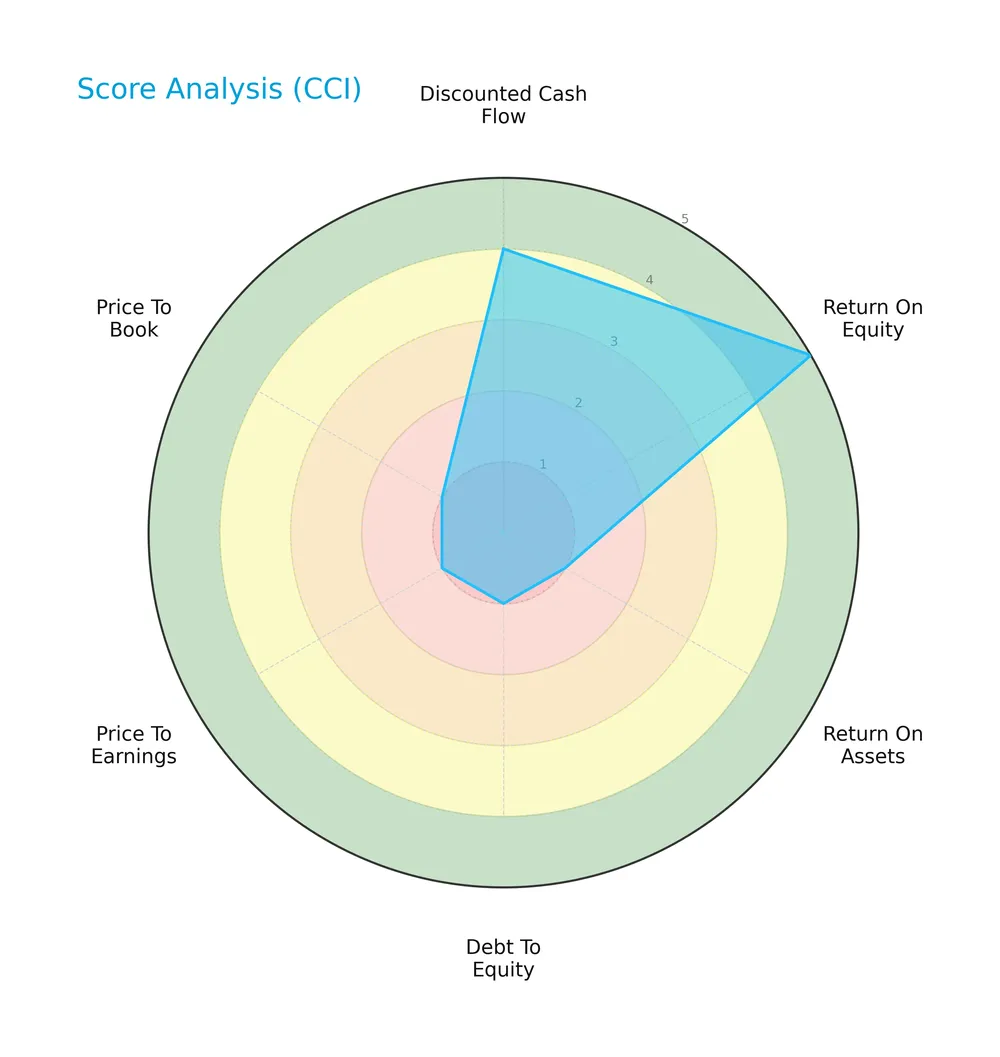
Crown Castle’s scores reveal significant challenges: discounted cash flow ranks moderate at 3, but return on equity, debt to equity, price to earnings, and price to book scores all register very unfavorable at 1. Return on assets is slightly better but still unfavorable at 2.
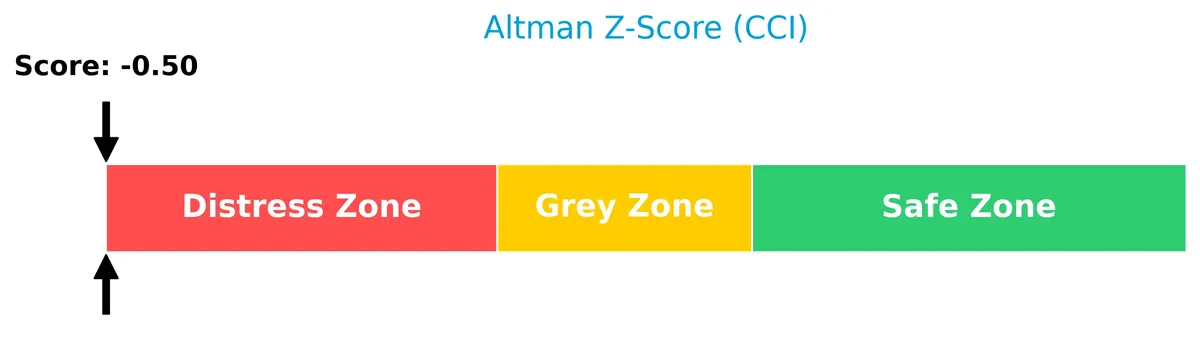
Analysis of the company’s bankruptcy risk
The Altman Z-Score places Crown Castle firmly in the distress zone, signaling a very high risk of financial distress and potential bankruptcy:
Is the company in good financial health?
The Piotroski Score diagram summarizes Crown Castle’s financial health based on nine key criteria:
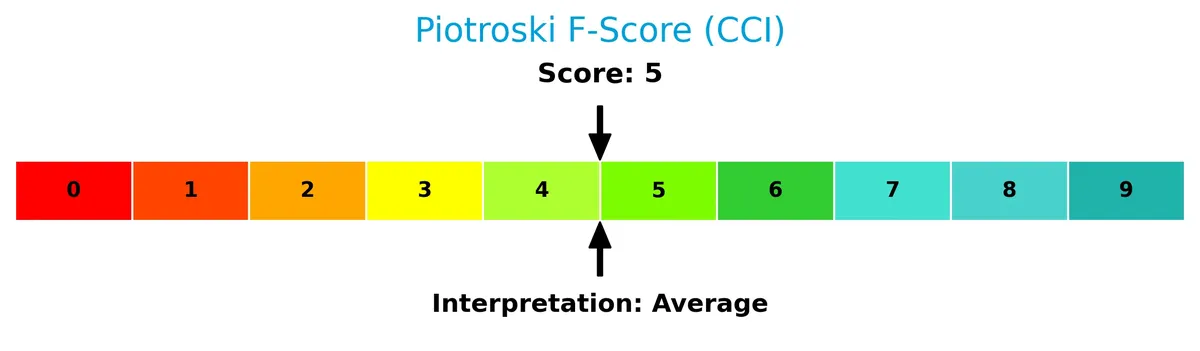
A score of 5 positions the company in the average range, indicating mixed financial signals with neither strong strength nor critical weakness in operational and financial efficiency.
Competitive Landscape & Sector Positioning
This section examines Crown Castle Inc.’s strategic positioning, revenue segments, and key products within its sector. I will analyze the company’s main competitors and assess its competitive advantages. The goal is to determine whether Crown Castle holds a sustainable edge over peers in the specialty REIT industry.
Strategic Positioning
Crown Castle concentrates its portfolio in the U.S., owning 40K+ cell towers and 80K route miles of fiber. It balances revenue between Towers (~$4.5B) and Fiber (~$2.1B), reflecting a focused yet diversified infrastructure strategy within American telecom markets.
Revenue by Segment
This pie chart breaks down Crown Castle Inc.’s revenue by business segments for fiscal year 2024, highlighting the contribution of Fiber and Towers to overall income.
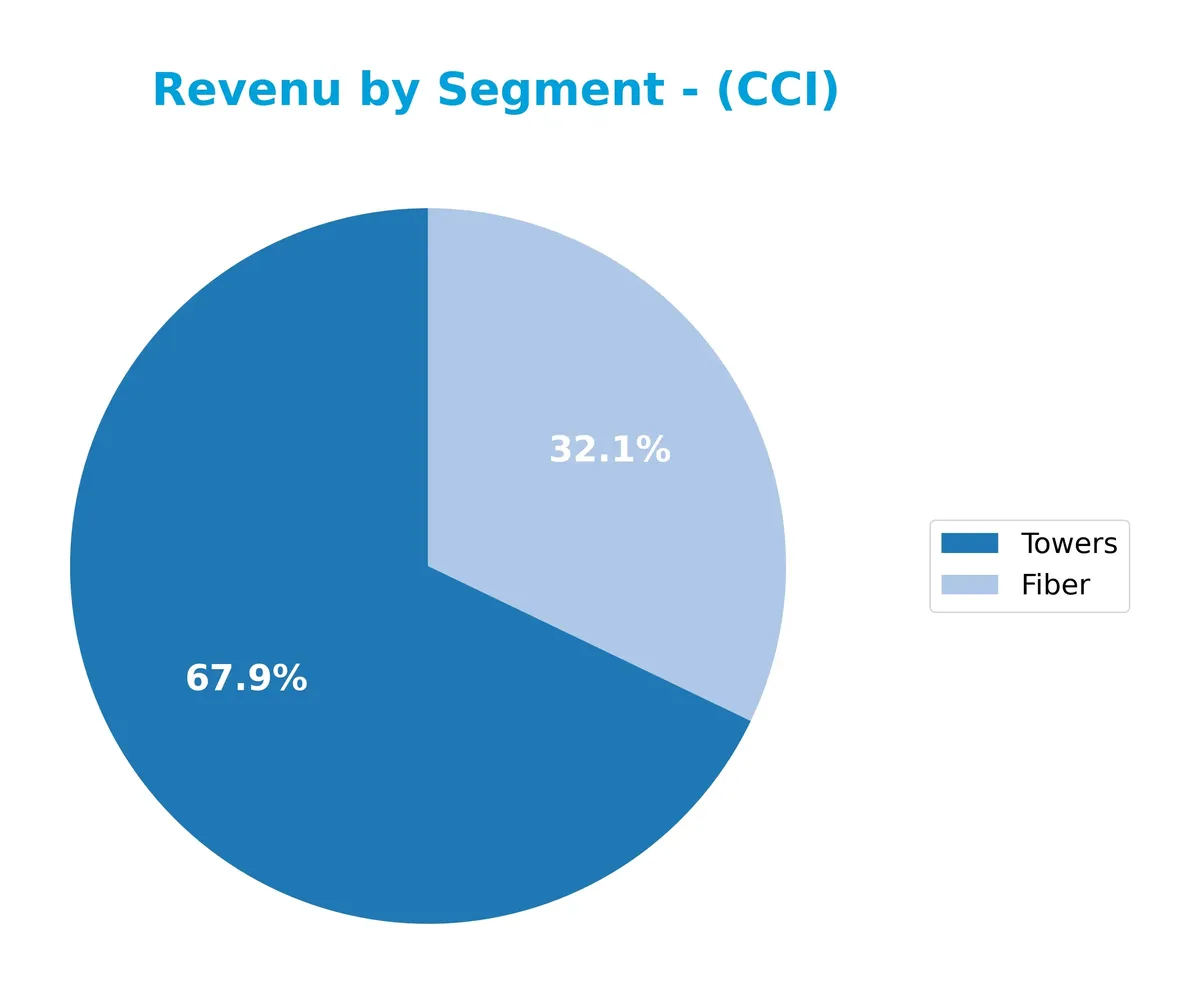
Towers dominate Crown Castle’s revenue with $4.46B in 2024, though this segment shows a gradual decline since 2022’s $5B peak. Fiber, generating $2.11B, has steadily grown from $1.72B in 2019 but slipped slightly last year. The firm’s reliance on Towers remains significant, signaling concentration risk if tower demand wanes. Fiber’s growth indicates diversification, but recent data suggest a need to monitor momentum closely.
Key Products & Brands
The following table summarizes Crown Castle Inc.’s primary products and brands generating revenue:
| Product | Description |
|---|---|
| Towers | More than 40,000 cell towers leased and operated, providing wireless infrastructure nationwide. |
| Fiber | Approximately 80,000 route miles of fiber supporting small cells and fiber solutions. |
| Small Cells | Distributed antenna systems enhancing wireless coverage and capacity in urban areas. |
Crown Castle’s revenue mainly derives from leasing cell towers and fiber networks. Towers remain the largest segment, while fiber and small cells complement the company’s infrastructure strategy.
Main Competitors
There are 6 competitors in total, with the table below listing the top 6 leaders by market capitalization:
| Competitor | Market Cap. |
|---|---|
| American Tower Corporation | 81.8B |
| Equinix, Inc. | 74.5B |
| Crown Castle Inc. | 38.6B |
| Iron Mountain Incorporated | 24.6B |
| SBA Communications Corporation | 20.7B |
| Weyerhaeuser Company | 17.2B |
Crown Castle Inc. ranks 3rd among its competitors with a market cap 46.7% that of the sector leader, American Tower Corporation. The company sits below the average market cap of the top 10 competitors (43B) but above the median sector market cap (31.6B). It maintains a significant 95.16% gap from the next competitor above, highlighting a notable scale difference within the top tier.
Comparisons with competitors
Check out how we compare the company to its competitors:
Does CCI have a competitive advantage?
Crown Castle Inc. does not yet demonstrate a clear competitive advantage, as its ROIC remains below WACC, indicating value is being shed despite a growing profitability trend. I observe the company’s profitability improving, but it still faces challenges in generating returns that exceed its cost of capital.
Looking ahead, Crown Castle’s extensive portfolio of over 40,000 cell towers and 80,000 route miles of fiber positions it well to capitalize on expanding wireless infrastructure demand across major U.S. markets. Opportunities may arise from new technology deployments and increased data connectivity needs, potentially supporting future value creation.
SWOT Analysis
This analysis highlights Crown Castle Inc.’s key internal and external factors to guide strategic decisions.
Strengths
- extensive U.S. network with 40,000+ towers
- strong EBIT margin at 48.7%
- growing ROIC trend
Weaknesses
- high debt-to-assets ratio at 93.8%
- weak liquidity with 0.26 current ratio
- negative ROE at -27.2%
Opportunities
- expanding 5G and fiber demand
- potential to improve capital structure
- growing small cell market
Threats
- intense competition in telecom infrastructure
- regulatory risks in U.S. markets
- rising interest expenses at 22.5% of revenue
Crown Castle’s robust infrastructure and profitability growth offer a solid foundation. However, heavy leverage and weak liquidity pose significant risks. Strategic focus must balance growth opportunities with prudent debt management.
Stock Price Action Analysis
The weekly stock chart below illustrates Crown Castle Inc.’s price movements and volatility over the past 12 months:
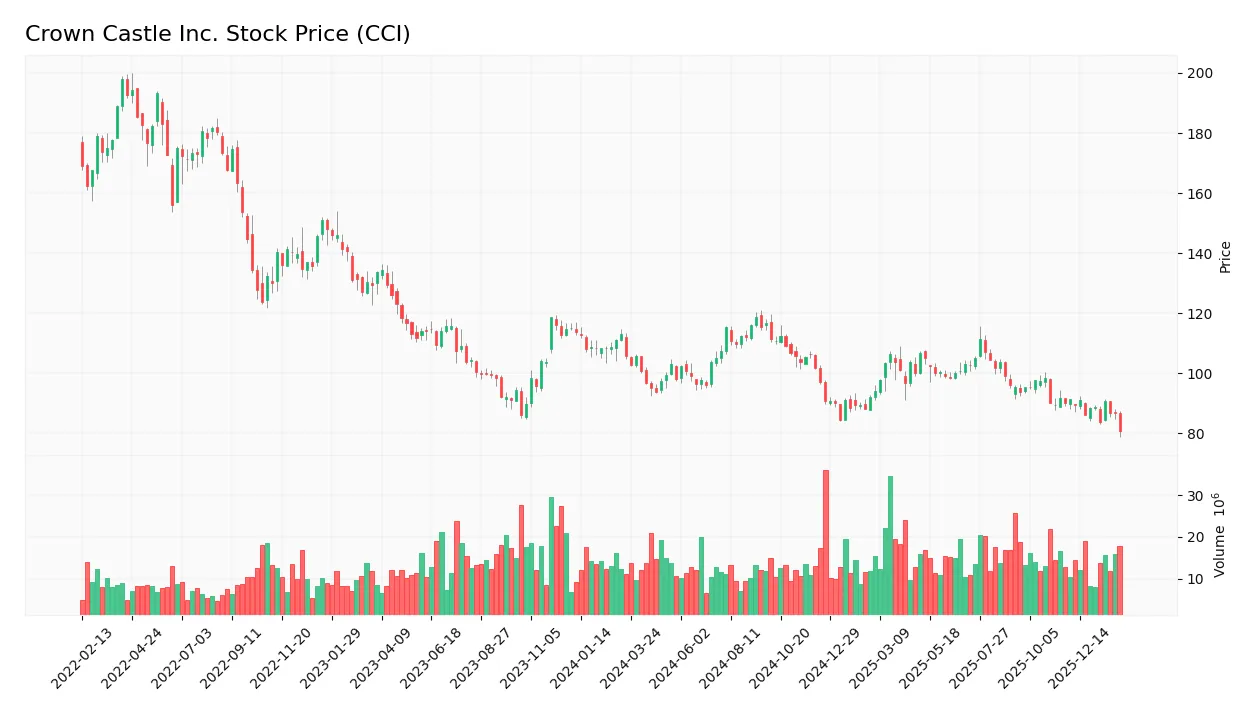
Trend Analysis
Over the past year, CCI’s stock declined by 12.98%, confirming a bearish trend with accelerating downward momentum. The price ranged between a high of 118.85 and a low of 80.88. Recent three-month data shows a further 3.58% drop, reflecting a continued but decelerating negative slope of -0.13.
Volume Analysis
Trading volume has increased, totaling 1.74B shares with 44.18% buyer participation overall. In the recent period, sellers slightly dominate with 46.04% buyer volume. This modest seller bias amid rising volume indicates cautious investor sentiment and higher market engagement.
Target Prices
Analysts set a clear target price consensus for Crown Castle Inc., reflecting moderate upside potential.
| Target Low | Target High | Consensus |
|---|---|---|
| 91 | 127 | 106.5 |
The target range suggests cautious optimism, with analysts expecting the stock to trade around 106.5 in the medium term.

Don’t Let Luck Decide Your Entry Point
Optimize your entry points with our advanced ProRealTime indicators. You’ll get efficient buy signals with precise price targets for maximum performance. Start outperforming now!
Analyst & Consumer Opinions
This section reviews recent analyst grades and consumer feedback to gauge market sentiment on Crown Castle Inc.
Stock Grades
Here are the latest verified analyst grades for Crown Castle Inc., reflecting current market sentiment:
| Grading Company | Action | New Grade | Date |
|---|---|---|---|
| Barclays | Maintain | Equal Weight | 2026-02-17 |
| Citigroup | Maintain | Buy | 2026-02-06 |
| Scotiabank | Maintain | Sector Perform | 2026-02-05 |
| JP Morgan | Maintain | Neutral | 2026-02-05 |
| Wells Fargo | Maintain | Overweight | 2026-02-05 |
| UBS | Maintain | Buy | 2026-02-05 |
| Jefferies | Maintain | Buy | 2026-02-04 |
| Keybanc | Maintain | Overweight | 2026-01-21 |
| Goldman Sachs | Maintain | Neutral | 2026-01-20 |
| UBS | Maintain | Buy | 2026-01-20 |
The consensus shows a strong bias toward Buy ratings, with no Sell recommendations. Most firms maintain their previous positions, indicating steady confidence in the stock’s outlook.
Consumer Opinions
Consumer sentiment on Crown Castle Inc. reflects a mix of strong infrastructure reliability and occasional service frustrations.
| Positive Reviews | Negative Reviews |
|---|---|
| Network uptime is consistently excellent, supporting seamless connectivity. | Customer service response times can be slow during peak periods. |
| Infrastructure quality is top-tier, enabling robust 5G rollout. | Pricing transparency could improve; some fees seem unclear. |
| Installation processes are efficient and minimally disruptive. | Occasional technical glitches reported in rural coverage areas. |
Overall, consumers praise Crown Castle’s infrastructure strength and network reliability. However, service speed and pricing clarity remain areas for improvement.
Risk Analysis
Below is a detailed table highlighting key risks Crown Castle Inc. faces, with their likelihood and potential impact:
| Category | Description | Probability | Impact |
|---|---|---|---|
| Financial Health | Altman Z-Score indicates high bankruptcy risk, currently in distress zone. | High | Severe |
| Leverage | Debt to assets ratio at 93.8%, indicating heavy reliance on debt financing. | High | Severe |
| Liquidity | Current and quick ratios are both 0.26, signaling poor short-term liquidity. | High | High |
| Profitability | Negative ROE at -27.16%, showing inefficient equity use. | Medium | Moderate |
| Valuation | Extremely high P/E at 87.07, suggesting overvaluation risk. | Medium | Moderate |
| Operational Efficiency | Low asset and fixed asset turnover, reflecting weak asset utilization. | Medium | Moderate |
| Interest Coverage | Coverage ratio of 2.17, only moderately cushioning against interest expense. | Medium | Moderate |
The most critical risks lie in Crown Castle’s financial distress signs—its Altman Z-Score signals bankruptcy risk, compounded by excessive leverage and poor liquidity. These factors overshadow its stable dividend yield and fiber infrastructure moat. Investors should weigh these red flags carefully against the sector’s average financial health.
Should You Buy Crown Castle Inc.?
Crown Castle appears to have improving operational efficiency but is shedding value with a slightly favorable moat. Despite substantial leverage and distress signals from solvency scores, its overall rating remains very favorable, suggesting a complex risk-return profile.
Strength & Efficiency Pillars
Crown Castle Inc. maintains solid operational margins with a gross margin of 66.07% and an EBIT margin of 48.72%. The net margin stands at a favorable 10.41%, reflecting effective cost control despite headwinds. However, the company’s return on invested capital (ROIC) is 6.81%, slightly above its weighted average cost of capital (WACC) at 5.99%, indicating modest value creation. Yet, the negative return on equity (-27.16%) signals inefficiencies in equity utilization.
Weaknesses and Drawbacks
The Altman Z-Score of 0.02 places Crown Castle firmly in the distress zone, signaling a high bankruptcy risk. This critical red flag overshadows any positive margins. Additionally, the company suffers from a very high price-to-earnings ratio of 87.07, indicating an overly premium valuation. Liquidity is strained with a current ratio of 0.26, well below the safe threshold of 1.0. The debt-to-assets ratio at 93.81% highlights a heavy leverage burden, compounding financial vulnerability.
Our Final Verdict about Crown Castle Inc.
Despite some operational strengths, Crown Castle’s solvency risk as indicated by its distress-zone Altman Z-Score makes it a highly speculative investment. The company’s precarious financial health and elevated leverage suggest it is too risky for conservative capital. Investors must weigh the potential for operational recovery against significant bankruptcy risk before considering exposure.
Disclaimer: This content is for informational purposes only and does not constitute financial, investment, or other professional advice. Investing in financial markets involves a significant risk of loss, and past performance is not indicative of future results.
Additional Resources
- Decoding Crown Castle Inc (CCI): A Strategic SWOT Insight – GuruFocus (Feb 24, 2026)
- Crown Castle (NYSE: CCI) pivots to towers with $8.5B fiber sale – Stock Titan (Feb 23, 2026)
- CROWN CASTLE INC. SEC 10-K Report – TradingView (Feb 23, 2026)
- Crown Castle (CCI) Price Target Cut as Barclays Adjusts Outlook after Results – Yahoo Finance (Feb 21, 2026)
- Equitable Trust Co. Sells 14,876 Shares of Crown Castle Inc. $CCI – MarketBeat (Feb 23, 2026)
For more information about Crown Castle Inc., please visit the official website: crowncastle.com