Home > Analyses > Basic Materials > CRH plc
CRH plc constructs the foundation of modern infrastructure, shaping cities and communities worldwide. As a global powerhouse in construction materials, it leads with innovative solutions spanning aggregates, cement, asphalt, and precast concrete. Its extensive footprint across the Americas and Europe underpins critical utilities and commercial projects. I’m keen to explore whether CRH’s robust market presence and diverse portfolio continue to justify its premium valuation and growth outlook in today’s evolving construction landscape.

Table of contents
Business Model & Company Overview
CRH plc, founded in 1936 and headquartered in Dublin, Ireland, stands as a global leader in construction materials. The company operates a comprehensive ecosystem spanning building materials, infrastructure solutions, and outdoor living products. Its integrated approach serves public infrastructure, commercial and residential markets, delivering value through a broad product suite including aggregates, cement, and precast concrete.
CRH’s revenue engine balances raw materials with value-added engineered solutions across the Americas, Europe, and Asia. Its three segments—Americas Materials, Americas Building, and International Solutions—drive diversified cash flow streams. I see CRH’s wide geographic reach and extensive product portfolio as a formidable economic moat, positioning it to shape the built environment’s future across multiple critical sectors.
Financial Performance & Fundamental Metrics
I will analyze CRH plc’s income statement, key financial ratios, and dividend payout policy to assess its operational efficiency and shareholder returns.
Income Statement
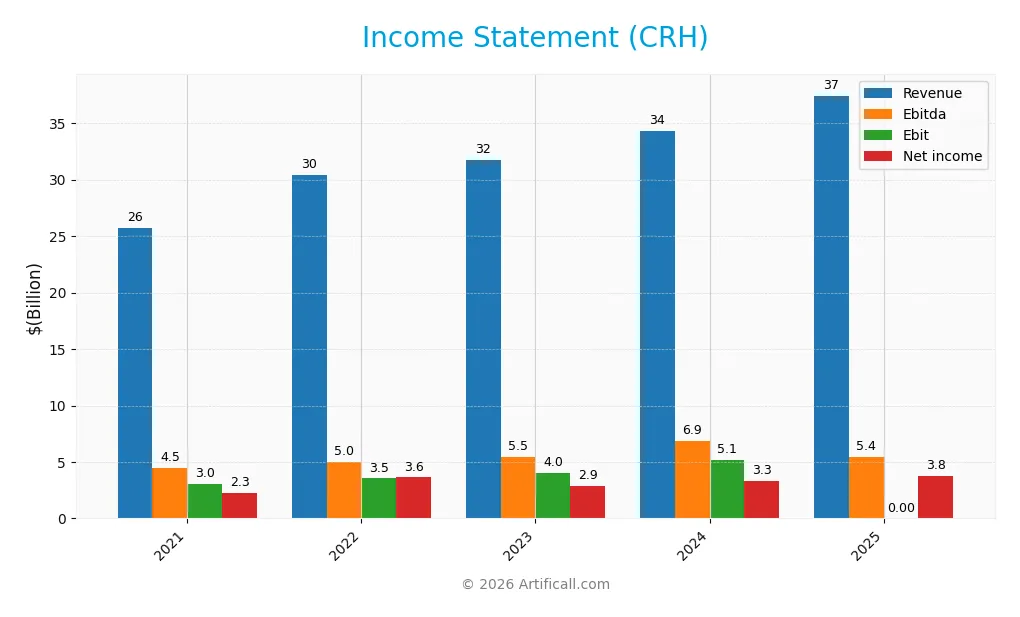
This table summarizes CRH plc’s key income statement figures over the past five fiscal years, illustrating revenue growth and profitability trends.
| 2021 | 2022 | 2023 | 2024 | 2025 | |
|---|---|---|---|---|---|
| Revenue | 25.8B | 30.4B | 31.8B | 34.4B | 37.4B |
| Cost of Revenue | 17.3B | 20.4B | 20.9B | 22.1B | 23.9B |
| Operating Expenses | 5.5B | 6.6B | 6.8B | 7.5B | 8.3B |
| Gross Profit | 8.4B | 10.1B | 10.9B | 12.3B | 13.5B |
| EBITDA | 4.5B | 5.0B | 5.5B | 6.9B | 5.4B |
| EBIT | 3.0B | 3.5B | 4.0B | 5.1B | 0 |
| Interest Expense | 349M | 320M | 342M | 591M | 810M |
| Net Income | 2.3B | 3.6B | 2.9B | 3.3B | 3.8B |
| EPS | 3.29 | 4.78 | 4.36 | 5.06 | 5.54 |
| Filing Date | 2022-03-11 | 2023-03-10 | 2024-02-29 | 2025-02-26 | 2026-02-18 |
Income Statement Evolution
CRH plc’s revenue rose steadily from $25.8B in 2021 to $37.4B in 2025, a 45.4% increase. Net income grew even faster, reaching $3.75B in 2025, up 65.9%. Gross margin improved to 36.1%, reflecting better cost control, though EBIT margin dropped sharply to zero in 2025, signaling operational challenges despite stable net margin growth.
Is the Income Statement Favorable?
The 2025 income statement shows revenue and gross profit growth outpacing operating expenses, although EBIT fell to zero. Interest expenses remain manageable, contributing positively to overall margins. Net margin at 10% and EPS growth near 10% indicate solid bottom-line strength. However, the EBIT margin decline marks a notable weakness in operating profitability. Overall, fundamentals appear generally favorable with some operational risk.
Financial Ratios
The following table summarizes key financial ratios for CRH plc over the last five fiscal years, illustrating profitability, liquidity, leverage, and valuation metrics:
| Ratios | 2021 | 2022 | 2023 | 2024 | 2025 |
|---|---|---|---|---|---|
| Net Margin | 8.8% | 11.9% | 9.0% | 9.7% | 10.0% |
| ROE | 12.7% | 17.6% | 15.1% | 16.0% | 15.6% |
| ROIC | 6.9% | 7.5% | 8.7% | 8.6% | 10.7% |
| P/E | 18.2 | 8.3 | 17.5 | 18.9 | 22.4 |
| P/B | 2.3 | 1.5 | 2.6 | 3.0 | 3.5 |
| Current Ratio | 1.85 | 1.84 | 1.69 | 1.37 | 1.74 |
| Quick Ratio | 1.38 | 1.32 | 1.26 | 0.91 | 1.14 |
| D/E | 0.60 | 0.49 | 0.62 | 0.71 | 0.80 |
| Debt-to-Assets | 27.2% | 24.0% | 27.4% | 30.2% | 32.9% |
| Interest Coverage | 8.4x | 10.9x | 11.9x | 8.0x | -6.7x |
| Asset Turnover | 0.65 | 0.72 | 0.74 | 0.70 | 0.64 |
| Fixed Asset Turnover | 1.50 | 1.73 | 1.83 | 1.57 | 1.42 |
| Dividend Yield | 1.9% | 2.8% | 1.7% | 2.6% | 1.2% |
Evolution of Financial Ratios
From 2021 to 2025, CRH plc’s Return on Equity (ROE) showed a steady improvement, peaking at 15.63% in 2025. The Current Ratio fluctuated but remained above 1.3, indicating consistent liquidity. Debt-to-Equity rose moderately to 0.8 by 2025, reflecting stable leverage. Profitability margins gradually improved, with net profit margin reaching 10.02% in 2025.
Are the Financial Ratios Fovorable?
In 2025, CRH presents favorable profitability metrics, including ROE and net margin, both above industry averages. Liquidity ratios like Current and Quick Ratios are solid, supporting operational stability. Leverage ratios, including Debt-to-Equity and Debt-to-Assets, appear neutral, suggesting manageable risk. However, the interest coverage ratio is unfavorable, signaling potential concerns in meeting interest obligations. Overall, the ratios are slightly favorable.
Shareholder Return Policy
CRH plc maintains a consistent dividend payout ratio around 26-35%, with dividends per share rising from $1.02 in 2021 to $1.48 in 2025. The annual dividend yield averaged near 1.2%, supported by share buybacks, reflecting a balanced capital return approach.
Free cash flow comfortably covers dividends plus capex, indicating sustainable distributions. This policy aligns well with prudent capital allocation, supporting long-term shareholder value without overextending financial leverage or risking cash flow constraints.
Score analysis
The radar chart below highlights CRH plc’s key financial metrics and valuation scores:
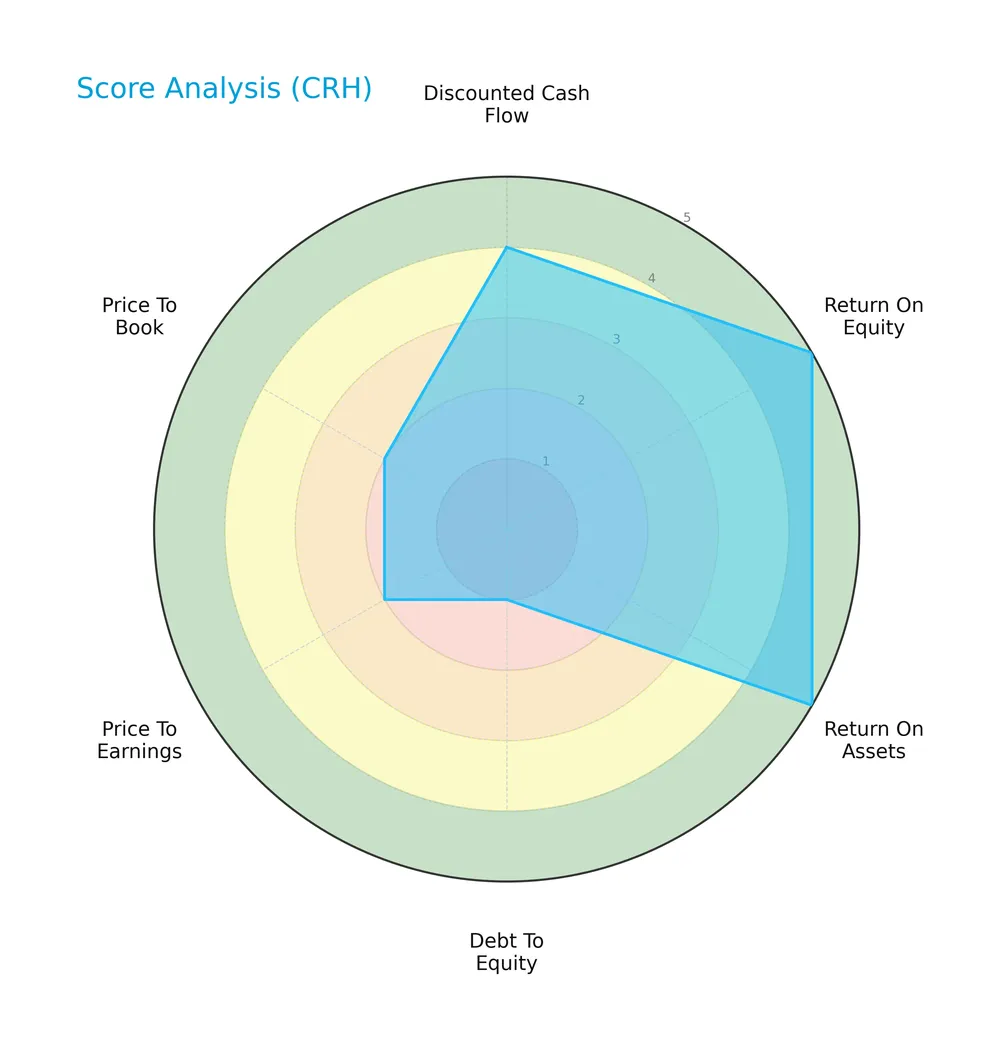
CRH scores very favorably on return on equity and assets, indicating strong profitability and efficient asset use. The discounted cash flow score is favorable. However, debt-to-equity and valuation multiples lag, signaling potential concerns. Overall, the score is moderate.
Analysis of the company’s bankruptcy risk
CRH plc’s Altman Z-Score places it firmly in the safe zone, suggesting low bankruptcy risk and solid financial stability:

Is the company in good financial health?
The Piotroski Score diagram illustrates CRH’s robust financial condition based on nine key criteria:

With a strong score of 7, CRH demonstrates notable financial strength, reflecting sound profitability, liquidity, and operational efficiency. This signals a well-managed company with a solid foundation.
Competitive Landscape & Sector Positioning
This analysis explores CRH plc’s strategic positioning, revenue streams, and key products within the construction materials sector. I will assess whether CRH holds a competitive advantage over its main competitors.
Strategic Positioning
CRH plc maintains a diversified product portfolio, with 2025 revenues of €28.8B in products and €8.7B in services. It spans multiple geographies, notably the US (€21.8B in 2024), Rest of Europe (€7.4B in 2025), and the UK, reflecting broad exposure across construction materials and infrastructure sectors.
Revenue by Segment
This pie chart illustrates CRH plc’s revenue distribution across product and service segments for the fiscal year 2025.
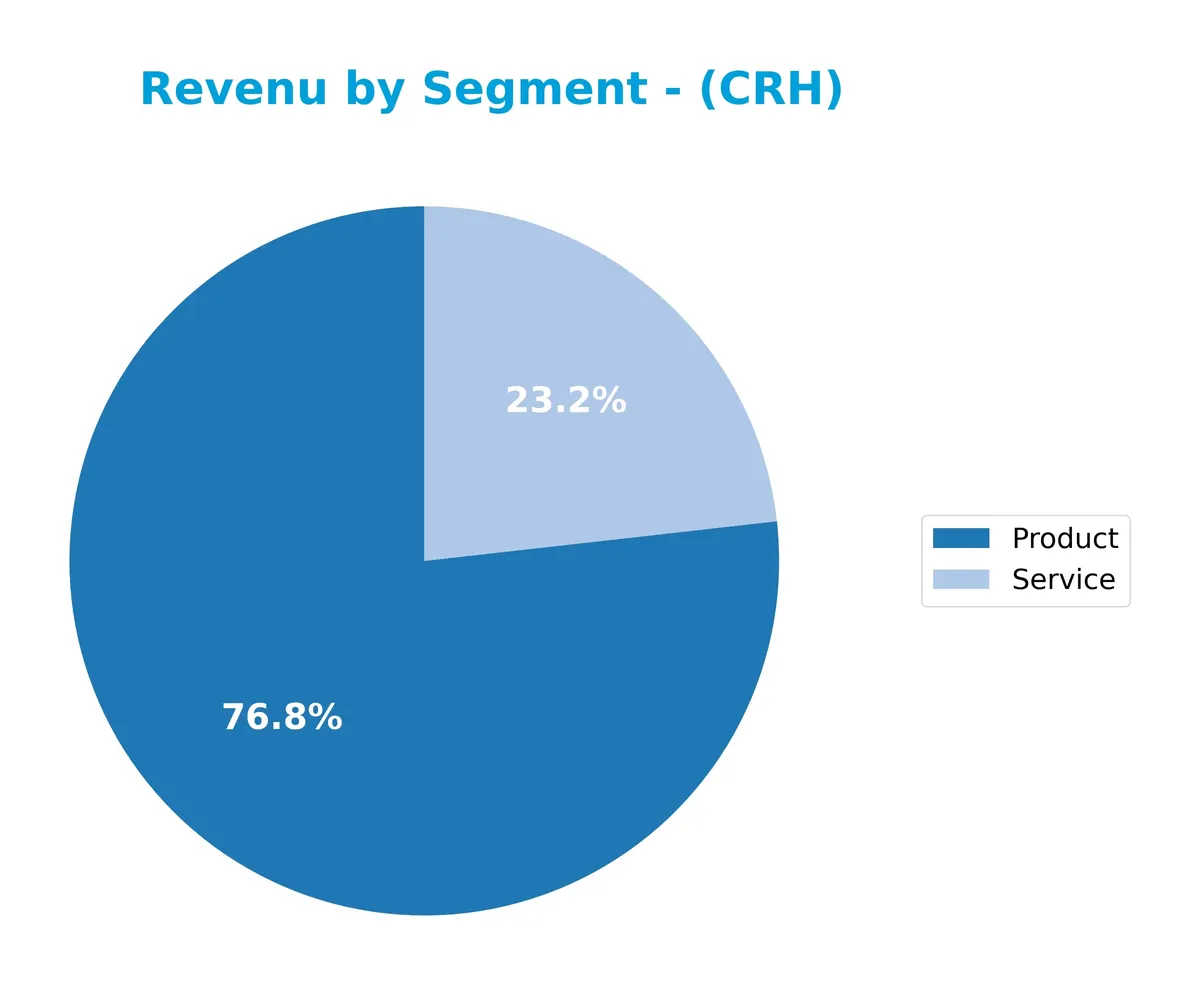
In 2025, CRH’s revenue is heavily driven by the Product segment, which accounts for €28.8B, showing steady growth from €26.7B in 2024. The Service segment contributes €8.7B, reflecting a slight decline from the previous year. This signals a concentration in product sales with a minor slowdown in services, highlighting CRH’s reliance on its core product offerings amid a stable market environment.
Key Products & Brands
CRH plc offers a diverse portfolio of construction materials and services essential to infrastructure and building projects:
| Product | Description |
|---|---|
| Building Materials | Aggregates, cement, ready-mixed concrete, mortars, and asphalt for construction and maintenance. |
| Precast and Pre-stressed Concrete Products | Floor and wall elements, beams, vaults, pipes, and manholes for utility and infrastructure use. |
| Concrete and Polymer-based Products | Underground vaults, drainage systems, enclosures, and modular precast structures for water, energy, telecom, and railroad markets. |
| Crushed Stone, Sand, and Gravel | Basic raw materials used in construction and landscaping projects. |
| Engineered Steel and Polymer-based Solutions | Anchoring, fixing, and connecting solutions for new-build construction applications. |
| Concrete Masonry and Hardscape Products | Pavers, blocks, curbs, retaining walls, slabs, fencing, railing systems, and composite decking. |
| Outdoor Living Products | Lawn and garden products and packaged concrete mixes for residential and commercial outdoor spaces. |
| Construction and Renovation Services | Paving and construction services supporting infrastructure, commercial, and residential projects. |
CRH’s product range spans essential raw materials to specialized concrete and polymer solutions, supporting diverse construction needs across multiple markets. The company balances product sales with value-added construction services.
Main Competitors
There are 3 competitors in the Construction Materials industry; the table below lists the top 3 leaders by market capitalization:
| Competitor | Market Cap. |
|---|---|
| CRH plc | 84.8B |
| Vulcan Materials Company | 38.7B |
| Martin Marietta Materials, Inc. | 38.3B |
CRH plc ranks 1st among its 3 competitors with a market cap nearly equal to the sector leader, at 98.3% of the top player’s scale. It stands above both the average market cap of the top 10 competitors (54B) and the median sector value (38.7B). The company holds a significant lead over its closest rival, Vulcan Materials, with a market cap gap exceeding 115%.
Comparisons with competitors
Check out how we compare the company to its competitors:
Does CRH have a competitive advantage?
CRH demonstrates a sustainable competitive advantage, consistently generating returns on invested capital (ROIC) that exceed its cost of capital by 2.7%. I observe a strong upward ROIC trend of 53.6% from 2021 to 2025, signaling increasing profitability and efficient capital use.
Looking ahead, CRH’s diversified product portfolio and geographic reach across Europe, the Americas, and international markets position it well for growth. Opportunities in critical infrastructure and value-added building solutions provide avenues to expand market share and enhance returns.
SWOT Analysis
This SWOT analysis highlights CRH plc’s strategic position to guide investors on its strengths, weaknesses, opportunities, and threats.
Strengths
- diversified geographic footprint
- strong revenue and net income growth
- sustainable competitive advantage with growing ROIC
Weaknesses
- unfavorable EBIT margin in recent year
- moderate debt-to-equity ratio
- valuation metrics (PB ratio) indicate premium pricing
Opportunities
- expansion in emerging markets
- infrastructure spending boost in Americas
- innovation in value-added building solutions
Threats
- raw material cost volatility
- regulatory changes in construction sector
- competitive pressure in key markets
CRH’s solid growth and moat underpin a robust strategic foundation. However, its recent EBIT weakness and debt levels require cautious monitoring. The company must leverage market expansion while managing cost and regulatory risks.
Stock Price Action Analysis
The weekly stock price chart for CRH plc reveals recent fluctuations and long-term movement patterns:
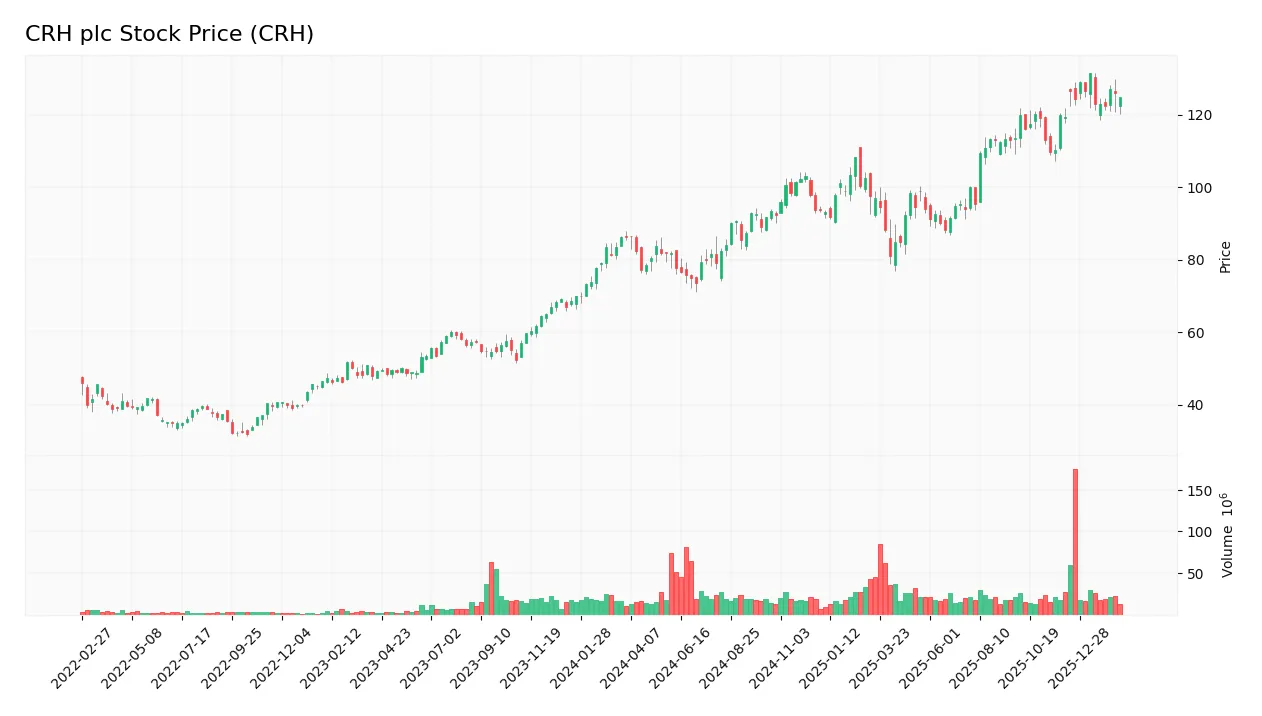
Trend Analysis
Over the past 12 months, CRH’s stock price rose 44.62%, indicating a bullish trend. The trend shows deceleration despite this strong gain. Price volatility is high, with a 15.07% standard deviation. The stock peaked at 131.38 and bottomed at 73.67 during this period.
Volume Analysis
Trading volumes over the last three months are increasing but remain seller-driven, with sellers accounting for 71.12% of activity. This seller dominance suggests cautious or profit-taking behavior. Rising volume alongside selling indicates heightened market participation amid some downward pressure.
Target Prices
Analysts present a well-defined target consensus for CRH plc.
| Target Low | Target High | Consensus |
|---|---|---|
| 131 | 147 | 138 |
The target range indicates moderate upside potential. Analysts expect CRH shares to trade around 138, signaling steady confidence in the company’s growth.

Don’t Let Luck Decide Your Entry Point
Optimize your entry points with our advanced ProRealTime indicators. You’ll get efficient buy signals with precise price targets for maximum performance. Start outperforming now!
Analyst & Consumer Opinions
This section reviews analyst grades and consumer feedback to provide insight into CRH plc’s market perception.
Stock Grades
Here are the latest verified stock grades for CRH plc from reputable financial institutions:
| Grading Company | Action | New Grade | Date |
|---|---|---|---|
| Wells Fargo | Maintain | Equal Weight | 2026-01-29 |
| Wells Fargo | Downgrade | Equal Weight | 2026-01-13 |
| Citigroup | Maintain | Buy | 2026-01-08 |
| UBS | Maintain | Buy | 2026-01-08 |
| Morgan Stanley | Maintain | Overweight | 2025-12-10 |
| DA Davidson | Maintain | Neutral | 2025-11-12 |
| JP Morgan | Maintain | Overweight | 2025-11-11 |
| Wells Fargo | Maintain | Overweight | 2025-11-07 |
| RBC Capital | Maintain | Outperform | 2025-11-07 |
| Barclays | Maintain | Overweight | 2025-10-20 |
The consensus shows a clear tilt toward positive sentiment, with multiple firms maintaining buy and overweight ratings. Notably, Wells Fargo recently downgraded to equal weight, suggesting some caution amid otherwise constructive views.
Consumer Opinions
Consumer sentiment for CRH plc reflects mixed but insightful perspectives on its products and services.
| Positive Reviews | Negative Reviews |
|---|---|
| “Reliable quality in construction materials.” | “Delivery delays impacted project timelines.” |
| “Strong customer support and technical advice.” | “Pricing higher than some competitors.” |
| “Consistent product performance over time.” | “Limited availability in some regions.” |
Overall, customers praise CRH’s product reliability and support. However, logistical issues and pricing remain areas for improvement, indicating a need for enhanced supply chain efficiency and competitive pricing strategies.
Risk Analysis
Below is a table summarizing key risks facing CRH plc, categorized by their likelihood and potential impact:
| Category | Description | Probability | Impact |
|---|---|---|---|
| Market Volatility | Cyclical demand shifts in construction materials due to economic downturns | Medium | High |
| Leverage Risk | Debt-to-equity ratio at 0.8 signals moderate leverage, raising refinancing risk | Medium | Medium |
| Interest Coverage | Negative interest coverage warns of weak ability to service debt costs | High | High |
| Valuation Concerns | Price-to-book ratio at 3.5 is elevated, possibly limiting upside | Medium | Medium |
| Operational Risk | Supply chain disruptions in raw materials impacting production | Medium | Medium |
The most concerning risk is CRH’s unfavorable interest coverage, which signals stress in meeting interest expenses despite a strong Altman Z-Score in the safe zone. This mismatch could pressure cash flows if borrowing costs rise. Market cyclicality remains a constant threat given its construction focus, especially with a beta above 1.1. Investors should watch refinancing conditions closely amid moderate leverage.
Should You Buy CRH plc?
CRH plc appears to be a profitable company with robust and growing returns on invested capital, indicating strong value creation and a durable moat. Despite a challenging leverage profile, its overall rating of B+ suggests a very favorable financial health outlook.
Strength & Efficiency Pillars
CRH plc demonstrates solid profitability with a net margin of 10.02% and a return on equity (ROE) of 15.63%, signaling operational efficiency. Its return on invested capital (ROIC) stands at 10.66%, comfortably above the weighted average cost of capital (WACC) of 7.93%, confirming the company as a clear value creator. The firm’s growing ROIC trend and a strong Piotroski Score of 7 further reinforce its sustainable competitive advantage and effective capital allocation.
Weaknesses and Drawbacks
CRH faces valuation and leverage concerns. The price-to-book ratio of 3.5 is unfavorable, indicating premium pricing relative to book value. Interest coverage is weak, flagged as unfavorable, which could stress the company’s ability to service debt. Despite a moderate debt-to-equity ratio of 0.8, these leverage indicators warrant caution. The recent seller dominance at 28.88% introduces near-term market pressure, suggesting increased volatility and investor skepticism.
Our Final Verdict about CRH plc
The company’s fundamentals appear robust, supported by a safe Altman Z-Score of 3.27, indicating low bankruptcy risk. Despite a bullish long-term trend, recent seller dominance advises a wait-and-see approach for a more favorable entry point. CRH may appear attractive for investors seeking exposure to a value creator with solid profitability, but short-term market dynamics could temper immediate enthusiasm.
Disclaimer: This content is for informational purposes only and does not constitute financial, investment, or other professional advice. Investing in financial markets involves a significant risk of loss, and past performance is not indicative of future results.
Additional Resources
- CRH Plc Hits Record $37.4 Billion Revenue as S&P 500 Inclusion Fuels Growth Surge – FinancialContent (Feb 18, 2026)
- CRH: Q4 Earnings Snapshot – KVUE (Feb 18, 2026)
- Decoding CRH PLC (CRH): A Strategic SWOT Insight – GuruFocus (Feb 19, 2026)
- CRH 2025 Annual Report on Form 10-K – Business Wire (Feb 18, 2026)
- CRH Extends Capital Returns With New $0.3 Billion Share Buyback – TipRanks (Feb 19, 2026)
For more information about CRH plc, please visit the official website: crh.com