Home > Analyses > Technology > Credo Technology Group Holding Ltd
Credo Technology Group Holding Ltd powers the backbone of modern high-speed communication, enabling seamless data transfer across global networks. As a key player in the communication equipment industry, Credo excels with its cutting-edge integrated circuits, active electrical cables, and advanced SerDes chiplets. Renowned for innovation and quality, the company shapes next-generation Ethernet solutions from its San Jose base. The critical question now is whether Credo’s robust technology and market presence justify its current valuation and growth prospects.
Table of contents
Business Model & Company Overview
Credo Technology Group Holding Ltd, founded in 2008 and headquartered in San Jose, California, stands as a dominant player in the communication equipment industry. The company delivers a cohesive ecosystem of high-speed connectivity solutions tailored for optical and electrical Ethernet applications. Its portfolio spans integrated circuits, active electrical cables, and SerDes chiplets, all built on proprietary serializer/deserializer and digital signal processor technologies, reflecting a core mission to advance data transmission efficiency globally.
The company’s revenue engine hinges on a balanced mix of hardware products and intellectual property licensing, such as SerDes IP, fueling recurring income streams. Credo’s strategic footprint covers key global markets, including the United States, Mexico, Mainland China, and Hong Kong, enabling diversified growth opportunities. This expansive reach, combined with cutting-edge technology, fortifies its economic moat and positions it as a key architect shaping the future of high-speed connectivity.
Financial Performance & Fundamental Metrics
In this section, I analyze Credo Technology Group Holding Ltd’s income statement, key financial ratios, and dividend payout policy to assess its financial health and investment potential.
Income Statement
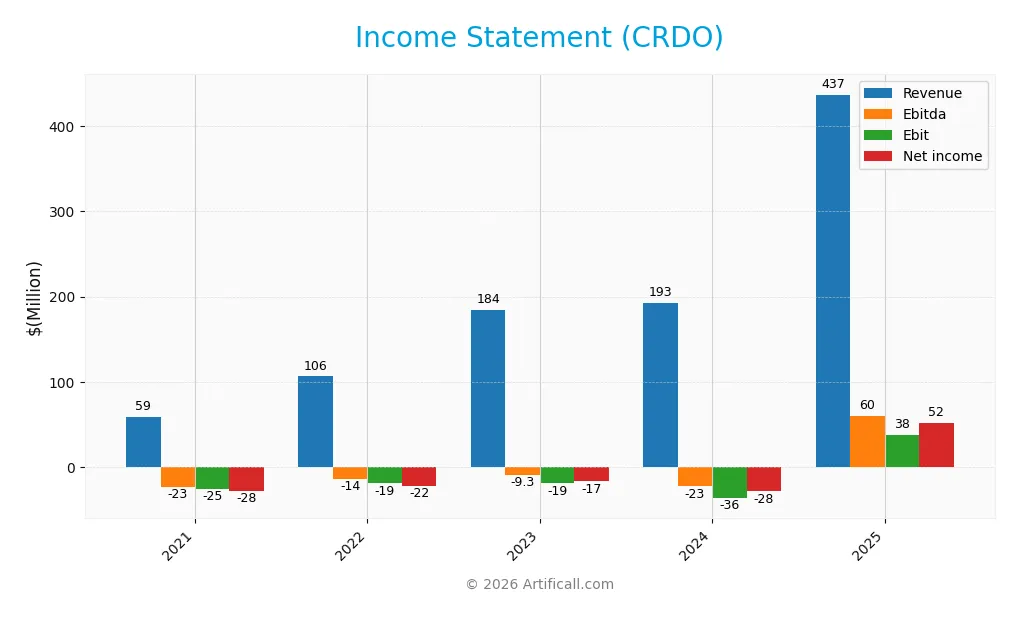
The table below summarizes Credo Technology Group Holding Ltd’s annual income statement figures from 2021 to 2025, expressed in USD.
| 2021 | 2022 | 2023 | 2024 | 2025 | |
|---|---|---|---|---|---|
| Revenue | 58.7M | 106.5M | 184.2M | 193.0M | 436.8M |
| Cost of Revenue | 20.4M | 42.5M | 78.0M | 73.5M | 153.9M |
| Operating Expenses | 63.5M | 86.0M | 127.4M | 156.5M | 245.8M |
| Gross Profit | 38.3M | 64.0M | 106.2M | 119.4M | 282.9M |
| EBITDA | -23.0M | -14.0M | -9.3M | -22.5M | 59.9M |
| EBIT | -25.2M | -18.8M | -18.8M | -36.3M | 38.0M |
| Interest Expense | 0 | 0 | 0 | 0 | 0 |
| Net Income | -27.5M | -22.2M | -16.5M | -28.4M | 52.2M |
| EPS | -0.20 | -0.16 | -0.11 | -0.18 | 0.31 |
| Filing Date | 2021-04-30 | 2022-06-08 | 2023-06-23 | 2024-06-24 | 2025-07-02 |
Income Statement Evolution
From 2021 to 2025, Credo Technology Group Holding Ltd experienced strong revenue growth, soaring 644% overall and doubling in the latest year alone. Net income followed suit, improving by nearly 290% over the period. Gross margin remained favorable at 64.8%, while EBIT margin showed a neutral stance at 8.7%, indicating some pressure on operating profitability despite rapid top-line expansion.
Is the Income Statement Favorable?
In 2025, fundamentals appear generally favorable with revenue reaching $437M and net income at $52.2M, yielding a healthy net margin of 12%. Operating expenses scaled proportionately with revenue, supporting sustained margin expansion. The absence of interest expense and a positive EBIT growth of 205% reinforce the company’s improving profitability profile, though EBIT margin neutrality suggests room for operational efficiency gains.
Financial Ratios
The table below presents key financial ratios for Credo Technology Group Holding Ltd (ticker: CRDO) over the fiscal years 2021 to 2025:
| Ratios | 2021 | 2022 | 2023 | 2024 | 2025 |
|---|---|---|---|---|---|
| Net Margin | -47% | -21% | -9% | -15% | 12% |
| ROE | 50% | -7% | -5% | -5% | 8% |
| ROIC | -18% | -6% | -5% | -7% | 5% |
| P/E | -59 | -71 | -72 | -98 | 138 |
| P/B | -29 | 4.7 | 3.4 | 5.1 | 11 |
| Current Ratio | 11.0 | 12.5 | 10.6 | 11.9 | 6.6 |
| Quick Ratio | 10.4 | 11.5 | 9.1 | 11.3 | 5.8 |
| D/E | 0.00 | 0.05 | 0.04 | 0.03 | 0.02 |
| Debt-to-Assets | 0.00 | 0.05 | 0.04 | 0.02 | 0.02 |
| Interest Coverage | 0 | 0 | 0 | 0 | 0 |
| Asset Turnover | 0.38 | 0.28 | 0.46 | 0.32 | 0.54 |
| Fixed Asset Turnover | 4.1 | 2.7 | 3.3 | 3.4 | 5.5 |
| Dividend Yield | 0 | 0 | 0 | 0 | 0 |
Evolution of Financial Ratios
From 2021 to 2025, Credo Technology Group Holding Ltd (CRDO) showed a recovery in profitability with net profit margin improving from -46.87% in 2021 to 11.95% in 2025. Return on Equity (ROE) increased but remained modest at 7.66% in 2025, indicating limited growth in shareholder returns. The Current Ratio declined from a very high level above 10 to 6.62, suggesting reduced but still strong liquidity. Debt-to-Equity Ratio remained consistently low, near 0.02, reflecting minimal leverage.
Are the Financial Ratios Favorable?
In 2025, CRDO’s profitability is mixed: net margin is favorable at 11.95%, but ROE and WACC are unfavorable, indicating challenges in generating returns above capital costs. Liquidity is ambivalent with a high Current Ratio deemed unfavorable, but a favorable Quick Ratio confirms good short-term financial health. Low debt ratios and infinite interest coverage reflect strong solvency. Efficiency ratios like fixed asset turnover are favorable, while market multiples such as P/E and P/B remain high and unfavorable. Overall, the ratio profile is neutral, balancing positives and negatives.
Shareholder Return Policy
Credo Technology Group Holding Ltd does not pay dividends, reflecting a reinvestment strategy consistent with its recent transition from losses to profitability. The company maintains strong liquidity and low debt, supporting operational needs without shareholder distributions. While no share buyback programs are reported, this approach aligns with prioritizing long-term growth.
This lack of direct shareholder returns suggests a focus on value creation through business expansion and innovation rather than immediate income. Given the improving margins and positive net income in 2025, this policy may support sustainable shareholder value, provided the company continues generating free cash flow to fund growth initiatives responsibly.
Score analysis
The following radar chart illustrates Credo Technology Group Holding Ltd’s key financial scores across multiple valuation and performance metrics:
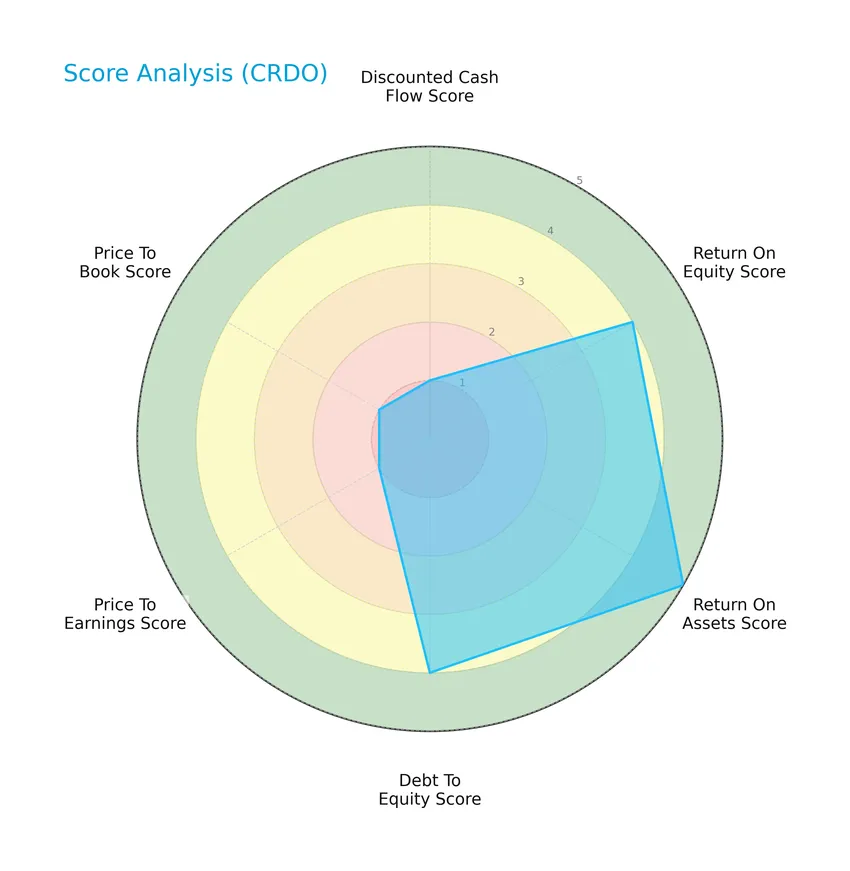
Credo shows strong performance in return on assets (5) and favorable scores in return on equity (4) and debt to equity (4). However, discounted cash flow, price to earnings, and price to book scores are very unfavorable at 1 each, indicating valuation concerns despite operational strengths.
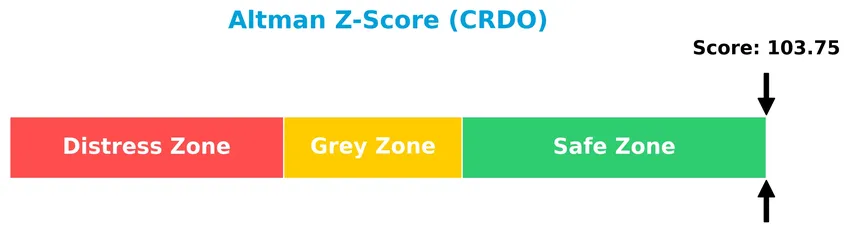
Analysis of the company’s bankruptcy risk
The Altman Z-Score indicates that Credo Technology Group Holding Ltd is in the safe zone, suggesting a very low risk of bankruptcy:
Is the company in good financial health?
The Piotroski Score diagram provides insight into Credo Technology Group Holding Ltd’s financial health based on nine accounting criteria:

With a Piotroski Score of 5, the company is in average financial health, reflecting a moderate level of strength but room for improvement to reach a stronger financial position.
Competitive Landscape & Sector Positioning
This section presents a detailed sector analysis of Credo Technology Group Holding Ltd, focusing on its strategic positioning and market dynamics. I will examine whether Credo holds a competitive advantage over its main industry rivals.
Strategic Positioning
Credo Technology Group Holding Ltd focuses predominantly on high-speed connectivity products, with product sales reaching $412M in 2025, complemented by licensing and engineering services. Geographically, it has diversified exposure, generating significant revenue in Hong Kong ($244M), China ($80M), and the United States ($65M), indicating a broad international footprint.
Revenue by Segment
This pie chart illustrates Credo Technology Group Holding Ltd’s revenue distribution by segment for the fiscal year 2025, highlighting the company’s business focus areas in USD.
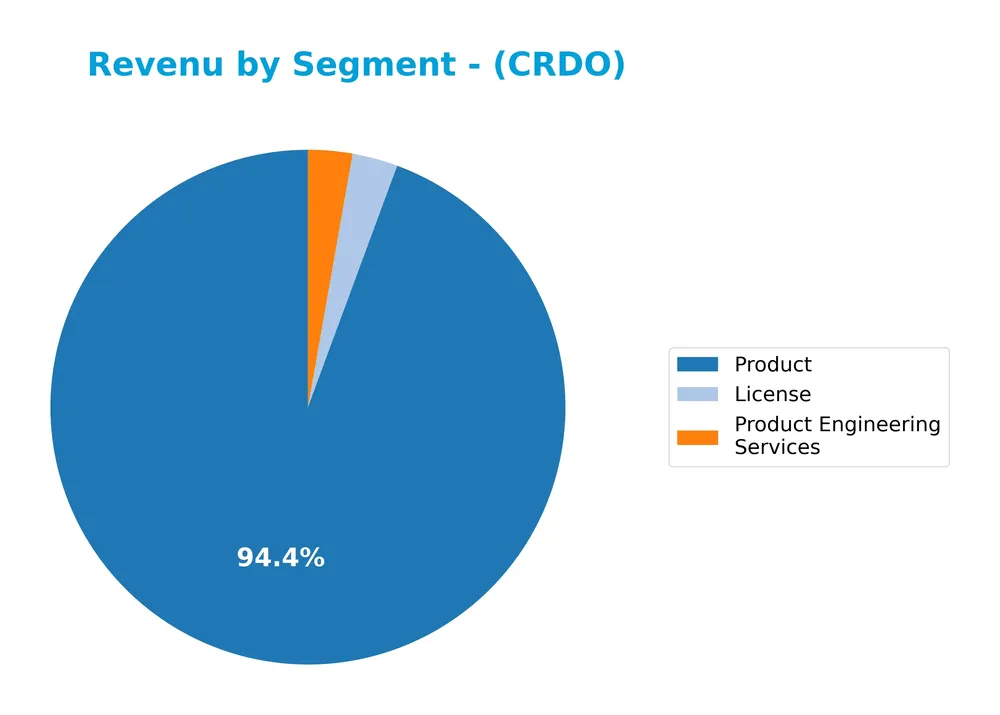
In 2025, the Product segment overwhelmingly dominates revenue at 412.2M, showing significant growth compared to previous years. License revenue declined sharply to 12.5M from 28.0M in 2024, while Product Engineering Services also decreased to 12.1M. The concentration in Product revenue suggests a strategic emphasis but also introduces concentration risk if this segment faces headwinds. Overall, the company’s revenue profile shows a marked shift towards product sales, with services playing a smaller role.
Key Products & Brands
The table below provides an overview of Credo Technology Group Holding Ltd’s main product lines and brand offerings:
| Product | Description |
|---|---|
| Integrated Circuits | High-speed connectivity chips designed for optical and electrical Ethernet applications. |
| Active Electrical Cables | Cables enhanced with integrated technology for improved data transmission in networking environments. |
| SerDes Chiplets | Components based on serializer/deserializer and digital signal processor technologies for connectivity. |
| SerDes IP Licensing | Intellectual property solutions offering SerDes technology licensing to other companies. |
| Product Engineering Services | Services supporting the design and development of connectivity products. |
| Licenses | Revenue generated from licensing technology and intellectual property rights. |
Credo Technology’s product portfolio centers on advanced connectivity solutions, including integrated circuits and cables, supported by engineering services and IP licensing, reflecting its focus on high-speed data transmission technologies.
Main Competitors
There are 7 main competitors in the Communication Equipment industry; below is a table of the top 10 leaders by market capitalization:
| Competitor | Market Cap. |
|---|---|
| Cisco Systems, Inc. | 300B |
| Motorola Solutions, Inc. | 63B |
| Nokia Oyj | 35B |
| Hewlett Packard Enterprise Company | 32B |
| Credo Technology Group Holding Ltd | 25B |
| Zebra Technologies Corporation | 13B |
| AudioCodes Ltd. | 255M |
Credo Technology Group Holding Ltd ranks 5th among its competitors, with a market cap approximately 8.0% that of the leader, Cisco Systems. The company is positioned below both the average market cap of the top 10 competitors (67B) and the median sector market cap (32B). It maintains a 33.05% market cap gap with the next competitor above it, indicating a moderate distance from its closest rival.
Comparisons with competitors
Check out how we compare the company to its competitors:
Does CRDO have a competitive advantage?
Credo Technology Group Holding Ltd currently does not present a strong competitive advantage, as its return on invested capital (ROIC) is below its weighted average cost of capital (WACC), indicating value destruction despite improving profitability. The company’s gross margin of 64.77% and net margin of 11.95% are favorable, with significant revenue and earnings growth over the past years, reflecting operational strength.
Looking ahead, Credo’s presence in key markets including the US, China, Hong Kong, and Mexico, along with its portfolio of high-speed connectivity products and intellectual property solutions, offers potential growth opportunities. The company’s growing ROIC trend suggests improving efficiency, which may enhance its competitive positioning if sustained.
SWOT Analysis
This SWOT analysis highlights Credo Technology Group Holding Ltd’s key internal and external factors to aid investors in assessing its strategic position.
Strengths
- strong revenue growth (126% in 1 year)
- favorable net margin (11.95%)
- low debt levels (D/E 0.02)
Weaknesses
- high valuation multiples (PE 138, PB 10.58)
- moderate ROE (7.66%)
- concentrated geographic revenue
Opportunities
- expanding global demand for high-speed connectivity
- growing profitability trend (ROIC improving)
- potential IP licensing growth
Threats
- intense competition in communication equipment
- geopolitical risks in China and Hong Kong
- technology obsolescence risk
Overall, Credo demonstrates robust growth and profitability with solid financial health, but faces valuation concerns and geographic concentration risks. Strategic focus should balance growth opportunities with valuation discipline and risk mitigation.
Stock Price Action Analysis
The following weekly chart presents Credo Technology Group Holding Ltd’s stock price movements over the past 12 months, highlighting key fluctuations and trend shifts:
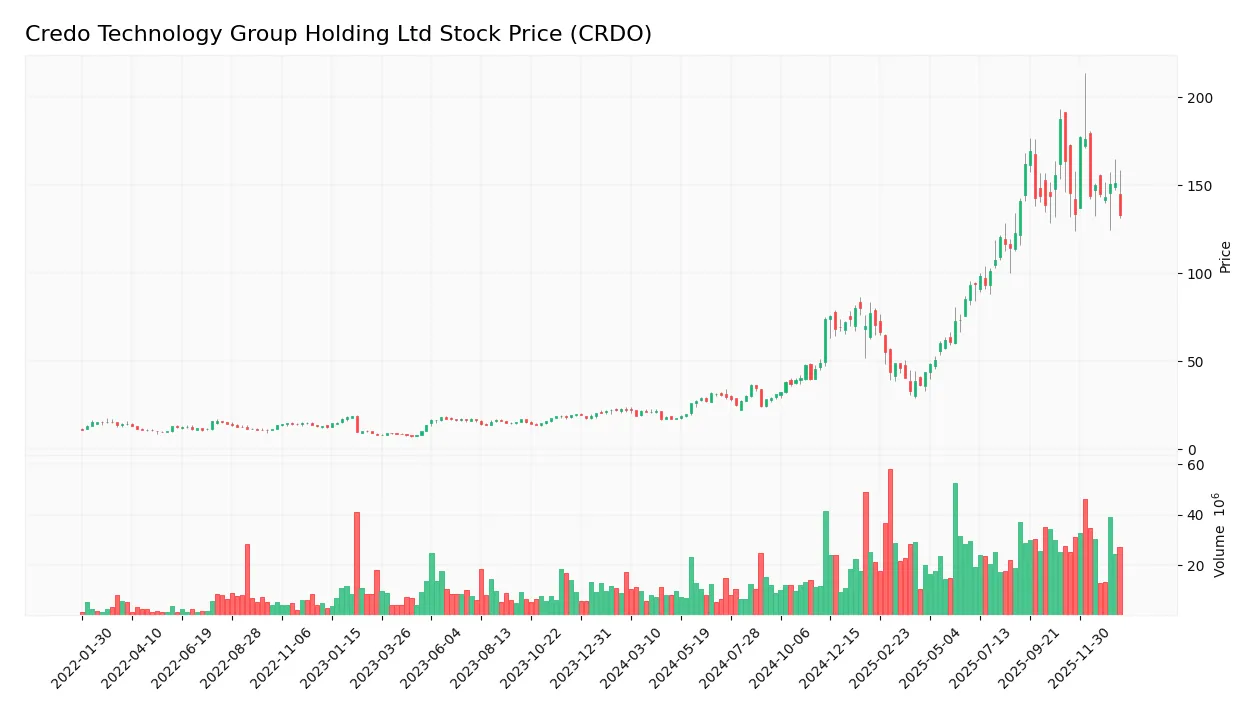
Trend Analysis
Over the past 12 months, CRDO’s stock price increased by 492.61%, indicating a strong bullish trend. The trend shows deceleration despite this significant gain. Price volatility remains elevated with a standard deviation of 48.92. The highest price reached 187.62 and the lowest was 16.92, marking substantial range expansion during this period.
Volume Analysis
Over the last three months, trading volume has increased, with total volumes rising and a buyer percentage at 59.7% historically. However, recent activity from November 2025 to January 2026 is seller-dominant, with buyers accounting for only 36.67%. This shift suggests growing selling pressure and cautious investor sentiment in the short term.
Target Prices
The consensus target prices for Credo Technology Group Holding Ltd indicate a moderately optimistic outlook.
| Target High | Target Low | Consensus |
|---|---|---|
| 260 | 160 | 222.5 |
Analysts expect the stock to trade between 160 and 260, with an average consensus target of 222.5, suggesting potential upside from current levels.

Don’t Let Luck Decide Your Entry Point
Optimize your entry points with our advanced ProRealTime indicators. You’ll get efficient buy signals with precise price targets for maximum performance. Start outperforming now!
Analyst & Consumer Opinions
This section examines the latest analyst ratings and consumer feedback regarding Credo Technology Group Holding Ltd (CRDO).
Stock Grades
Here is a summary of recent stock grades assigned to Credo Technology Group Holding Ltd by recognized financial institutions:
| Grading Company | Action | New Grade | Date |
|---|---|---|---|
| B of A Securities | Maintain | Buy | 2025-12-02 |
| Needham | Maintain | Buy | 2025-12-02 |
| Mizuho | Maintain | Outperform | 2025-12-02 |
| Roth Capital | Maintain | Buy | 2025-12-02 |
| Barclays | Maintain | Overweight | 2025-12-02 |
| Susquehanna | Maintain | Positive | 2025-10-22 |
| Barclays | Maintain | Overweight | 2025-10-07 |
| Barclays | Maintain | Overweight | 2025-09-04 |
| TD Cowen | Maintain | Buy | 2025-09-04 |
| Needham | Maintain | Buy | 2025-09-04 |
The consensus among these established firms strongly favors a buy stance, with no downgrades recorded in the past several months. Most grades indicate confidence in the stock’s potential, reflecting a stable positive outlook.
Consumer Opinions
Consumer sentiment around Credo Technology Group Holding Ltd (CRDO) reflects a mix of enthusiasm for its innovative product lineup and concerns about customer service responsiveness.
| Positive Reviews | Negative Reviews |
|---|---|
| “Credo’s technology is cutting-edge and reliable.” | “Support response times can be slow.” |
| “Great value for the price, with consistent performance.” | “Occasional software glitches need fixing.” |
| “User-friendly interfaces make adoption easy.” | “Documentation lacks some depth and clarity.” |
Overall, consumers appreciate Credo’s innovative and user-friendly products but often point to customer service and technical support as areas needing improvement. This balance is crucial for potential investors to consider.
Risk Analysis
Below is a table summarizing the key risks associated with investing in Credo Technology Group Holding Ltd (CRDO):
| Category | Description | Probability | Impact |
|---|---|---|---|
| Market Volatility | High beta of 2.66 indicates sensitivity to market swings, leading to share price fluctuations | High | High |
| Valuation Risk | Elevated P/E ratio of 138.19 and P/B ratio of 10.58 suggest potential overvaluation | Medium | High |
| Profitability | Moderate ROE of 7.66% and ROIC of 5.01% may limit returns compared to peers | Medium | Medium |
| Liquidity | High current ratio (6.62) but unfavorable status suggests possible concerns in asset quality | Low | Medium |
| Dividend Policy | No dividend yield, which may deter income-focused investors | Low | Low |
| Debt Levels | Low debt-to-equity (0.02) and debt-to-assets (1.98%) ratios indicate minimal leverage risk | Low | Low |
| Financial Health | Strong Altman Z-Score (103.75) places company in safe zone, reducing bankruptcy risk | Low | Low |
The most pressing risks for CRDO stem from its high market volatility and stretched valuation metrics, which could lead to significant price corrections. Despite solid financial health and low leverage, cautious monitoring of profitability trends and market conditions is advisable.
Should You Buy Credo Technology Group Holding Ltd?
Credo Technology Group Holding Ltd appears to be improving profitability with growing ROIC despite a slightly unfavorable moat indicating value erosion. Supported by a manageable debt profile and an overall B rating, the company suggests a moderate but cautiously favorable investment profile.
Strength & Efficiency Pillars
Credo Technology Group Holding Ltd exhibits robust profitability with a net margin of 11.95%, signaling efficient cost management. The company’s Altman Z-score of 103.75 places it comfortably in the safe zone, reflecting strong financial health and low bankruptcy risk. Despite a modest ROIC of 5.01% trailing its WACC of 16.38%, indicating value erosion, the firm benefits from a strong Piotroski score of 5, denoting average operational strength. Favorable debt metrics, with a debt-to-equity ratio of 0.02 and interest coverage at infinity, further underscore its conservative leverage and solid balance sheet management.
Weaknesses and Drawbacks
Significant valuation concerns arise from a lofty P/E ratio of 138.19 and a P/B ratio of 10.58, suggesting the stock trades at a substantial premium, which may pressure future returns. The current ratio of 6.62, while seemingly strong, is flagged as unfavorable, possibly reflecting inefficient asset utilization or excessive liquidity that can dampen returns. Moreover, recent market dynamics are seller-dominant, with buyers representing only 36.67% of volume since November 2025, coinciding with an 18.61% price decline, indicating short-term headwinds and volatility risks.
Our Verdict about Credo Technology Group Holding Ltd
The company’s long-term fundamental profile is moderately favorable due to strong profitability and a resilient financial position but tempered by valuation excesses and value destruction relative to capital costs. Although the overall stock trend remains bullish, recent seller dominance and price softness suggest a wait-and-see approach for a more attractive entry point. This profile may appear suitable for investors with a high risk tolerance seeking exposure to growth but calls for caution given the premium valuation and recent market pressures.
Disclaimer: This content is for informational purposes only and does not constitute financial, investment, or other professional advice. Investing in financial markets involves a significant risk of loss, and past performance is not indicative of future results.
Additional Resources
- Credo Technology Group Holding Ltd. (NASDAQ:CRDO) Receives Average Recommendation of “Buy” from Analysts – MarketBeat (Jan 24, 2026)
- Barclays Remains a Buy on Credo Technology Group Holding Ltd (CRDO) – Yahoo Finance (Jan 23, 2026)
- Credo’s Next Phase Begins (NASDAQ:CRDO) – Seeking Alpha (Jan 23, 2026)
- Rosenblatt Initiates Coverage of Credo Technology Group Holding (CRDO) with Neutral Recommendation – Nasdaq (Jan 21, 2026)
- How Is The Market Feeling About Credo Technology Group Holding Ltd? – Benzinga (Jan 23, 2026)
For more information about Credo Technology Group Holding Ltd, please visit the official website: credosemi.com