Home > Analyses > Consumer Defensive > Coty Inc.
Coty Inc. shapes the beauty industry by delivering iconic fragrances, skincare, and cosmetics that define personal style worldwide. With a portfolio featuring prestigious names like Gucci, Calvin Klein, and Kylie Jenner, Coty commands a strong presence across both luxury and mass markets. Renowned for its innovation and extensive global reach, the company influences consumer habits daily. As we dive into its financials, the key question remains: does Coty’s current valuation reflect its growth potential in a competitive market?

Table of contents
Business Model & Company Overview
Coty Inc., founded in 1904 and headquartered in New York City, stands as a leader in the Household & Personal Products industry. It operates a comprehensive ecosystem of beauty products, spanning prestige fragrances, skin care, and color cosmetics across a wide range of iconic brands. The company’s portfolio connects with consumers via diverse channels—from high-end perfumeries and department stores to mass-market retailers and e-commerce platforms.
The company’s revenue engine thrives on a balanced mix of prestige and mass-market offerings, distributed through an extensive global network covering the Americas, Europe, and Asia. Coty leverages its strong brand portfolio and multi-channel distribution to generate steady sales across approximately 150 countries. This global presence, combined with deep consumer engagement, forms a robust economic moat that helps Coty shape the future of beauty retailing worldwide.
Financial Performance & Fundamental Metrics
In this section, I analyze Coty Inc.’s income statement, key financial ratios, and dividend payout policy to assess its financial health and investment potential.
Income Statement
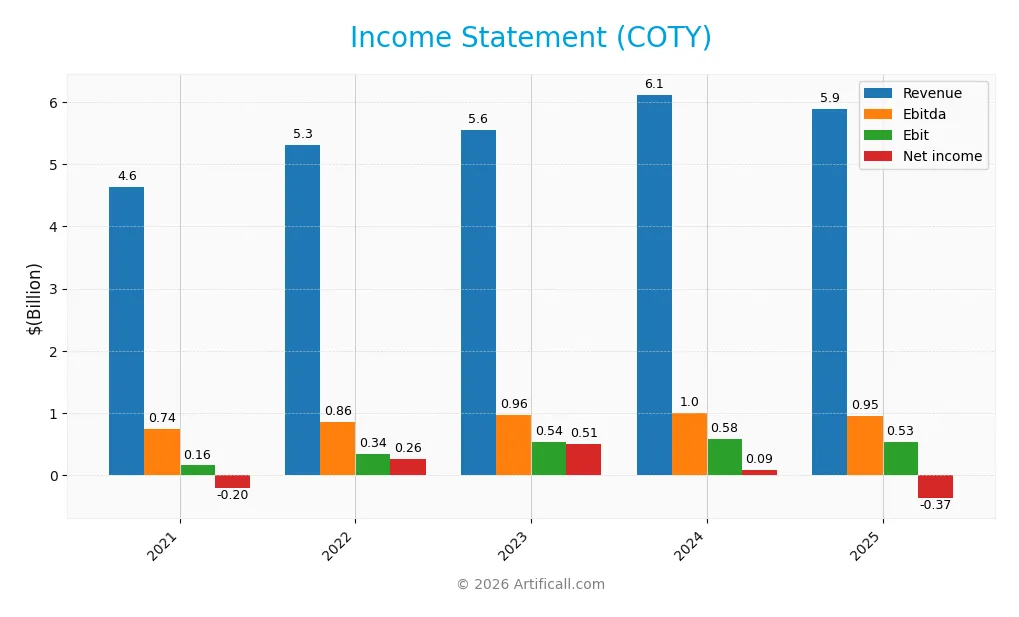
The table below presents Coty Inc.’s key income statement figures for fiscal years 2021 through 2025, reported in USD.
| 2021 | 2022 | 2023 | 2024 | 2025 | |
|---|---|---|---|---|---|
| Revenue | 4.63B | 5.30B | 5.55B | 6.12B | 5.89B |
| Cost of Revenue | 1.85B | 1.92B | 2.01B | 2.18B | 2.07B |
| Operating Expenses | 2.83B | 3.14B | 3.00B | 3.39B | 3.58B |
| Gross Profit | 2.78B | 3.38B | 3.55B | 3.94B | 3.82B |
| EBITDA | 744.5M | 856.3M | 964.9M | 1.00B | 949.9M |
| EBIT | 159.2M | 339.9M | 538.2M | 582.9M | 529.9M |
| Interest Expense | 231.8M | 241.2M | 261.1M | 251.6M | 227.0M |
| Net Income | -201.3M | 259.5M | 508.2M | 89.4M | -367.9M |
| EPS | -0.0887 | 0.32 | 0.58 | 0.0871 | -0.44 |
| Filing Date | 2021-08-26 | 2022-08-25 | 2023-08-22 | 2024-08-20 | 2025-08-21 |
Income Statement Evolution
From 2021 to 2025, Coty Inc.’s revenue grew by 27.3%, showing long-term expansion, but revenue declined by 3.7% in the latest year. Gross profit followed a similar pattern, decreasing 3.0% recently after steady growth. Margins saw mixed trends: gross margin remained favorable at 64.8%, while EBIT margin held neutral at 9.0%, but net margin deteriorated to -6.2%, reflecting rising costs or other pressures.
Is the Income Statement Favorable?
The 2025 income statement reveals challenges, with net income at -$368M and a negative net margin of 6.2%, signaling an unfavorable bottom line. Despite a solid gross margin and controlled interest expenses, EBIT fell 9.1% year-over-year to $530M, and overall profitability declined sharply. The fundamentals currently appear unfavorable due to shrinking earnings and margin compression despite stable operational efficiency.
Financial Ratios
The following table summarizes key financial ratios for Coty Inc. over the past five fiscal years, providing an overview of profitability, valuation, liquidity, leverage, and operational efficiency:
| Ratios | 2021 | 2022 | 2023 | 2024 | 2025 |
|---|---|---|---|---|---|
| Net Margin | -4.3% | 4.9% | 9.1% | 1.5% | -6.2% |
| ROE | -5.2% | 7.9% | 12.9% | 2.3% | -10.0% |
| ROIC | -0.1% | 1.5% | 4.0% | 3.1% | 2.6% |
| P/E | -35.5 | 25.3 | 20.5 | 95.5 | -11.0 |
| P/B | 1.83 | 1.99 | 2.64 | 2.15 | 1.10 |
| Current Ratio | 0.74 | 0.66 | 0.75 | 0.75 | 0.77 |
| Quick Ratio | 0.47 | 0.40 | 0.44 | 0.46 | 0.46 |
| D/E | 1.49 | 1.45 | 1.15 | 1.04 | 1.15 |
| Debt-to-Assets | 42.3% | 39.5% | 35.9% | 34.1% | 35.7% |
| Interest Coverage | -0.21 | 1.00 | 2.08 | 2.17 | 1.06 |
| Asset Turnover | 0.34 | 0.44 | 0.44 | 0.51 | 0.49 |
| Fixed Asset Turnover | 3.74 | 5.12 | 5.56 | 6.28 | 6.04 |
| Dividend Yield | 0.36% | 0.87% | 0.13% | 0.16% | 0.33% |
Evolution of Financial Ratios
Over the period from 2021 to 2025, Coty Inc. experienced a decline in profitability as reflected in the decreasing Return on Equity (ROE), which turned negative at -9.98% in 2025. The Current Ratio remained below 1, indicating liquidity concerns, with a slight increase to 0.77 in 2025. The Debt-to-Equity Ratio stayed elevated around 1.15 by 2025, showing persistent leverage. Overall, profitability weakened significantly in recent years.
Are the Financial Ratios Favorable?
In 2025, Coty’s financial ratios show a generally unfavorable profile. Profitability metrics such as net margin (-6.24%) and ROE (-9.98%) are negative, while Return on Invested Capital (2.55%) is low. Liquidity ratios, including the current ratio (0.77) and quick ratio (0.46), are below standard thresholds. Leverage remains high with a debt-to-equity ratio of 1.15, though debt-to-assets is neutral at 35.65%. Efficiency shows mixed signals with a favorable fixed asset turnover (6.04) but an unfavorable asset turnover (0.49). Market valuation ratios like price-to-earnings (-11.02) and price-to-book (1.10) are favorable, yet overall the financial health appears weak.
Shareholder Return Policy
Coty Inc. maintains a modest dividend policy with a dividend per share around $0.015 in 2025, accompanied by a very low dividend yield of 0.33%. The dividend payout ratio is negative due to recent net losses, indicating dividends are not fully supported by earnings. There is no explicit mention of share buybacks.
The company’s approach reflects cautious distribution amid negative net income and free cash flow constraints. This restrained dividend combined with limited buybacks suggests a focus on balancing shareholder returns with financial stability, supporting a sustainable long-term value creation strategy under current conditions.
Score analysis
Here is the radar chart presenting key financial scores that outline various valuation and performance metrics:
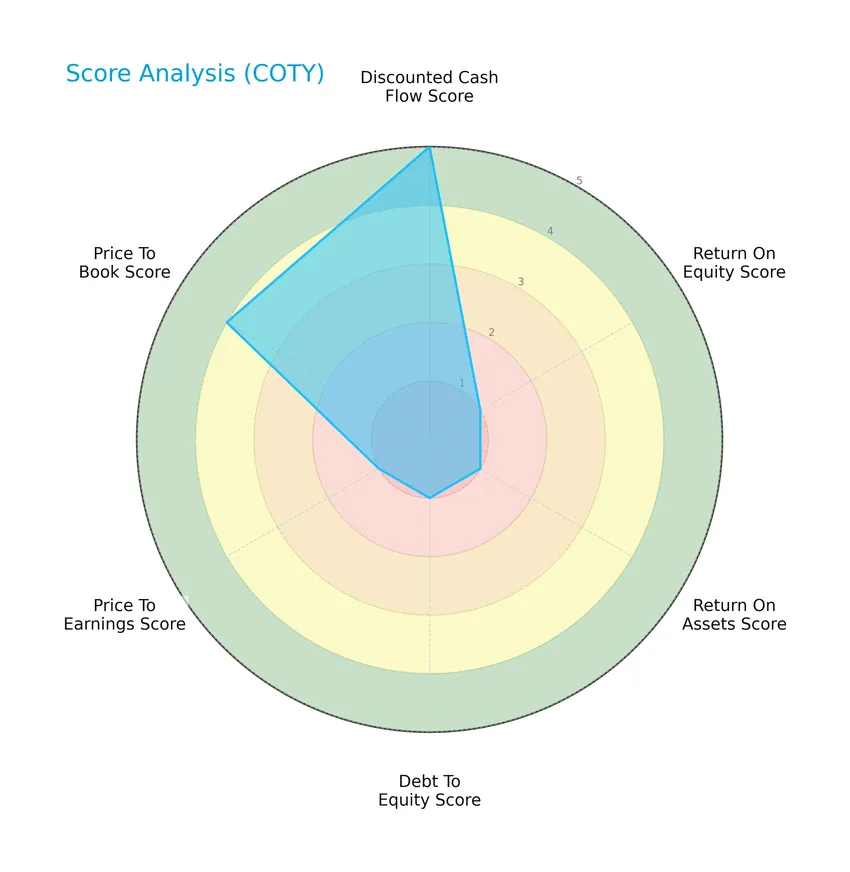
The discounted cash flow score is very favorable at 5, while return on equity, return on assets, debt-to-equity, and price-to-earnings scores are all very unfavorable at 1. The price-to-book score is favorable at 4, reflecting mixed financial signals overall.
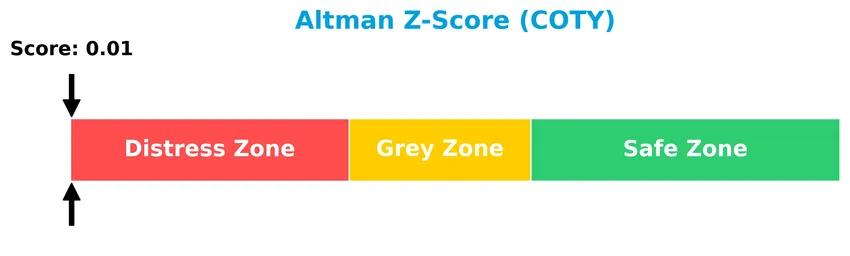
Analysis of the company’s bankruptcy risk
The Altman Z-Score indicates that the company is in the distress zone, suggesting a high risk of financial distress and potential bankruptcy:
Is the company in good financial health?
The Piotroski Score diagram provides insight into the company’s financial health status:
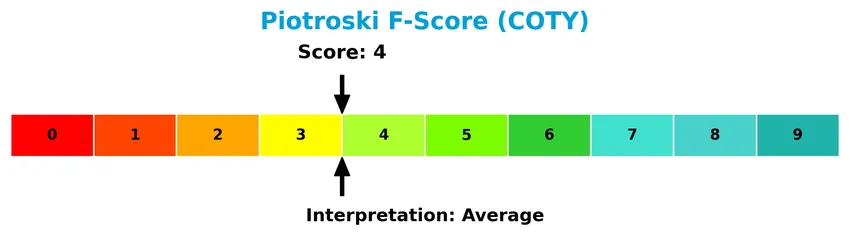
With a Piotroski Score of 4 classified as average, the company demonstrates moderate financial health, indicating neither strong nor weak fundamentals at this time.
Competitive Landscape & Sector Positioning
This section presents an analysis of Coty Inc.’s position within the Household & Personal Products sector, focusing on its strategic and competitive dynamics. I will examine whether Coty holds a competitive advantage relative to its main industry peers.
Strategic Positioning
Coty Inc. operates with a diversified product portfolio, focusing on prestige fragrances and consumer beauty with over $5.9B combined revenue in 2025, while maintaining broad geographic exposure across approximately 150 countries, notably the Americas, EMEA, and Asia Pacific regions.
Revenue by Segment
The pie chart illustrates Coty Inc.’s revenue distribution by product segment for fiscal year 2025, highlighting the Consumer Beauty and Prestige segments.
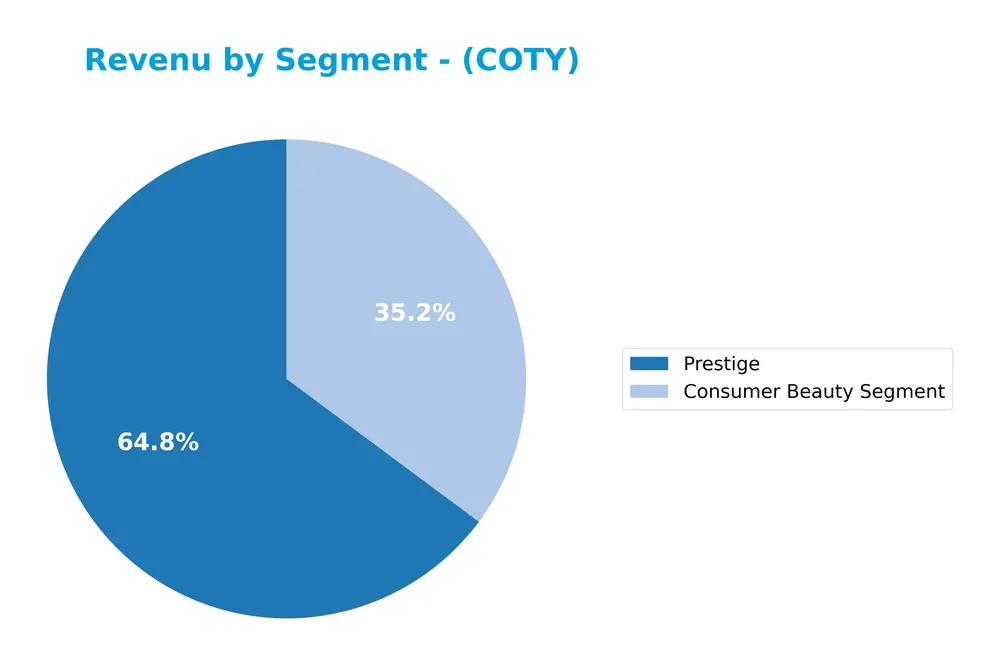
In 2025, Coty’s revenue was primarily driven by the Prestige segment at 3.82B and the Consumer Beauty segment at 2.07B. Compared to previous years, Prestige remains the dominant segment but shows a slight decline since 2024’s 3.86B. Consumer Beauty has decreased more noticeably from 2.26B in 2024, indicating a mild slowdown. The company’s focus appears concentrated on these two segments, with Prestige maintaining its lead despite recent pressure.
Key Products & Brands
Below is a summary of Coty Inc.’s key products and brands categorized by market segments and brand positioning:
| Product | Description |
|---|---|
| Prestige Brands | High-end fragrances, skin care, and color cosmetics sold through perfumeries, department stores, e-retailers, and direct websites. Includes Alexander McQueen, Burberry, Calvin Klein, Gucci, Kylie Jenner, Tiffany & Co., and others. |
| Consumer Beauty Segment | Mass market color cosmetics, fragrances, skin care, and body care products distributed mainly via hypermarkets, supermarkets, drug stores, pharmacies, and e-commerce. Brands include Adidas, CoverGirl, Max Factor, Rimmel, Sally Hansen, and 007 James Bond. |
| Luxury Segment | (Reported historically until 2019) Focused on premium beauty products, contributing significant revenue in earlier years. |
| Professional Beauty Segment | (Reported historically until 2019) Products designed for professional use in salons and similar outlets. |
| Color Cosmetics | (Reported historically until 2016) Makeup products including foundations, lipsticks, and eye products. |
| Fragrances | (Reported historically until 2016) Perfumes and colognes across various brands and segments. |
| Skin and Body Care | (Reported historically until 2016) Products for skin hygiene, moisturizing, and body treatment. |
Coty’s product portfolio spans prestige and mass-market beauty categories, with a wide array of well-known brands targeting different consumer segments globally. The company’s revenue mix has evolved, focusing recently on the Prestige and Consumer Beauty segments.
Main Competitors
Coty Inc. faces competition from 17 companies, with the table below listing the top 10 leaders by market capitalization:
| Competitor | Market Cap. |
|---|---|
| The Procter & Gamble Company | 331.3B |
| Unilever PLC | 143.2B |
| Colgate-Palmolive Company | 62.6B |
| The Estée Lauder Companies Inc. | 38.5B |
| Kimberly-Clark Corporation | 33.7B |
| Kenvue Inc. | 33.2B |
| Church & Dwight Co., Inc. | 20.2B |
| The Clorox Company | 12.3B |
| e.l.f. Beauty, Inc. | 4.3B |
| Inter Parfums, Inc. | 2.7B |
Coty Inc. ranks 11th among its 17 competitors, with a market cap roughly 0.9% that of the sector leader, The Procter & Gamble Company. The company is positioned below both the average market cap of the top 10 competitors (68.2B) and the median market cap of the sector (4.3B). The gap to its closest competitor above is approximately 7.34%, indicating a moderate distance to climb toward the top 10.
Comparisons with competitors
Check out how we compare the company to its competitors:
Does COTY have a competitive advantage?
Coty Inc. currently exhibits a slightly unfavorable competitive advantage as it is destroying value, with a ROIC below its WACC by approximately 3.1%, despite a growing ROIC trend. The company’s overall income statement evaluation is unfavorable, marked by declining net margin and earnings per share, signaling challenges in profitability.
Looking ahead, Coty benefits from a diverse portfolio of prestige and mass-market beauty brands distributed globally across approximately 150 countries, providing opportunities for expansion in emerging markets and e-commerce channels. Continued development of new products and leveraging its strong presence in household and personal products could support future growth prospects.
SWOT Analysis
This SWOT analysis highlights Coty Inc.’s key internal strengths and weaknesses alongside external opportunities and threats to guide investment decisions.
Strengths
- Strong brand portfolio with luxury and mass-market labels
- Global distribution across 150 countries
- Favorable gross margin at 64.8%
Weaknesses
- Negative net margin at -6.24%
- Declining revenue and net income trends
- Weak liquidity ratios and high debt-to-equity
Opportunities
- Growing beauty market in emerging regions
- Expansion of e-commerce channels
- Potential margin improvement from operational efficiencies
Threats
- Intense competition in beauty industry
- Economic downturns impacting consumer spending
- Rising raw material and supply chain costs
Coty shows solid brand strength and global reach but faces profitability and liquidity challenges. Strategic focus on operational efficiency and market expansion could mitigate risks and unlock value.
Stock Price Action Analysis
The following weekly stock chart illustrates Coty Inc.’s price movements over the last 12 months:
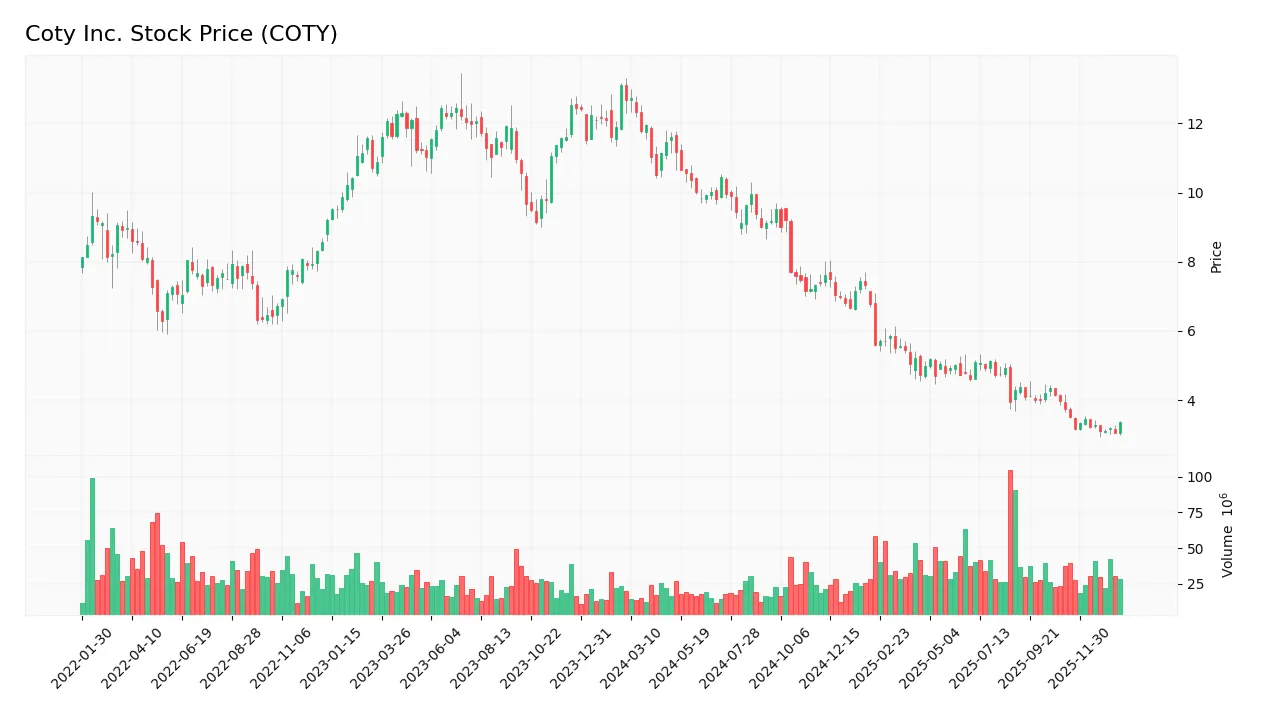
Trend Analysis
Over the past 12 months, Coty Inc.’s stock price declined by 73.48%, indicating a bearish trend. The price showed acceleration in its downward movement, with notable highs at 12.73 and lows near 3.05. The volatility is moderate, with a standard deviation of 2.78, confirming sustained selling pressure.
Volume Analysis
In the last three months, trading volume in Coty Inc. has been increasing, with 47.3% buyer dominance but a slight seller bias overall. This neutral buyer behavior alongside rising volume suggests cautious participation, reflecting balanced but tense investor sentiment amid continuing price weakness.
Target Prices
Analysts present a cautious but optimistic consensus on Coty Inc.’s stock price outlook.
| Target High | Target Low | Consensus |
|---|---|---|
| 10 | 3 | 4.83 |
The target prices suggest moderate upside potential, with a consensus around $4.83 indicating expectations of gradual recovery or growth. Investors should consider this range alongside market conditions and company performance.

Don’t Let Luck Decide Your Entry Point
Optimize your entry points with our advanced ProRealTime indicators. You’ll get efficient buy signals with precise price targets for maximum performance. Start outperforming now!
Analyst & Consumer Opinions
This section examines the latest analyst ratings and consumer feedback regarding Coty Inc.’s market performance and products.
Stock Grades
Here is the latest overview of Coty Inc.’s stock grades from recognized financial analysts and rating firms:
| Grading Company | Action | New Grade | Date |
|---|---|---|---|
| TD Cowen | Maintain | Hold | 2026-01-21 |
| Evercore ISI Group | Downgrade | In Line | 2025-12-23 |
| Citigroup | Maintain | Neutral | 2025-12-17 |
| TD Cowen | Maintain | Hold | 2025-12-12 |
| Berenberg | Downgrade | Hold | 2025-09-10 |
| Morgan Stanley | Maintain | Equal Weight | 2025-08-25 |
| Barclays | Maintain | Underweight | 2025-08-22 |
| Canaccord Genuity | Maintain | Hold | 2025-08-22 |
| Wells Fargo | Maintain | Equal Weight | 2025-08-22 |
| RBC Capital | Maintain | Outperform | 2025-08-22 |
Most analysts maintain a cautious stance with predominant Hold and Equal Weight ratings. Notably, some downgrades occurred in late 2025, reflecting tempered optimism amid mixed sentiment.
Consumer Opinions
Consumers of Coty Inc. have shared a mix of enthusiasm and concerns, reflecting varied experiences with the brand’s products and services.
| Positive Reviews | Negative Reviews |
|---|---|
| High-quality fragrances with lasting scent. | Packaging often feels cheap and flimsy. |
| Wide variety of products catering to all ages. | Customer service response times can be slow. |
| Affordable luxury compared to competitors. | Some products cause skin irritation. |
Overall, consumers appreciate Coty’s diverse and affordable product range, especially their fragrances. However, recurring issues include packaging quality and inconsistent customer support, which may impact brand loyalty.
Risk Analysis
Below is a table summarizing the key risks facing Coty Inc., including their likelihood and potential impact on the company:
| Category | Description | Probability | Impact |
|---|---|---|---|
| Financial Health | Low profitability with negative net margin and ROE; distressed Altman Z-Score indicates bankruptcy risk | High | High |
| Liquidity | Current ratio (0.77) and quick ratio (0.46) both unfavorable, signaling liquidity constraints | Medium | Medium |
| Debt Management | High debt-to-equity ratio (1.15) and moderate interest coverage, increasing financial leverage risk | Medium | Medium |
| Market Volatility | Stock price range wide ($2.94-$7.71) with beta near 1, indicating sensitivity to market swings | Medium | Medium |
| Competitive Pressure | Operating in highly competitive beauty products sector with shifting consumer preferences | Medium | Medium |
| Dividend Policy | No recent dividend payments, which may affect investor sentiment | Low | Low |
The most urgent risks for Coty are its weak financial health and liquidity challenges, highlighted by a distress-zone Altman Z-Score and negative profitability metrics in 2025. These factors raise concerns about solvency and operational stability, requiring cautious risk management.
Should You Buy Coty Inc.?
Coty Inc. appears to be navigating a challenging profile with improving operational efficiency but an eroding competitive moat as value is being shed. Despite significant leverage and liquidity concerns, the overall rating could be seen as moderate, suggesting cautious interpretation of its value creation potential.
Strength & Efficiency Pillars
Coty Inc. exhibits some operational strengths, notably with a robust gross margin of 64.84% and a favorable weighted average cost of capital (WACC) at 5.7%. While its return on invested capital (ROIC) at 2.55% remains below WACC, indicating the company is currently not a value creator, there are positive signs in asset utilization such as a fixed asset turnover of 6.04, which suggests some efficiency in capital deployment. The Piotroski score of 4 reflects an average financial health, though the Altman Z-Score of 0.007 places the company in distress zone, signaling caution on financial stability.
Weaknesses and Drawbacks
The company faces significant headwinds, with a bearish overall stock trend marked by a 73.48% price decline and recent seller dominance (52.7% sellers). Profitability metrics are concerning: a negative net margin of -6.24% and negative ROE of -9.98% highlight ongoing losses. Financial leverage is high with a debt-to-equity ratio of 1.15 and low liquidity ratios (current ratio 0.77, quick ratio 0.46), indicating short-term solvency risks. Valuation signals are mixed but include a favorable P/E of -11.02 due to losses and a modest P/B of 1.1, which may not fully reflect underlying risks.
Our Verdict about Coty Inc.
The fundamental profile of Coty Inc. appears unfavorable given its financial distress signals, weak profitability, and deteriorating market performance. However, despite the bearish long-term trend and recent seller dominance, the increasing volume trend and neutral buyer behavior might suggest stabilization attempts. Therefore, while the profile may appear to hold some recovery potential, it might be prudent to adopt a cautious, wait-and-see stance before considering exposure to this equity.
Disclaimer: This content is for informational purposes only and does not constitute financial, investment, or other professional advice. Investing in financial markets involves a significant risk of loss, and past performance is not indicative of future results.
Additional Resources
- TD Cowen Trims Coty Inc. (COTY) Target Ahead of Q4, Keeps Hold Rating – Yahoo Finance Singapore (Jan 24, 2026)
- Coty’s Supply Chain Transformation – Forbes (Dec 11, 2025)
- TD Cowen Lowers Price Target for COTY to USD 3.40; Rating Held a – GuruFocus (Jan 21, 2026)
- Coty (NYSE:COTY) Given Consensus Recommendation of “Reduce” by Brokerages – MarketBeat (Jan 23, 2026)
- Coty chair, CEO may exit as owner JAB plans leadership shake-up, FT reports – Reuters (Dec 12, 2025)
For more information about Coty Inc., please visit the official website: coty.com