Home > Analyses > Energy > Coterra Energy Inc.
Coterra Energy powers American homes and industries through vast natural gas and oil production. With commanding positions in the Marcellus Shale, Permian, and Anadarko Basins, it shapes energy supply across key U.S. regions. The company’s blend of innovative exploration and efficient operations cements its industry influence. As the energy landscape evolves, I ask: do Coterra’s fundamentals sustain its valuation and growth in today’s market?

Table of contents
Business Model & Company Overview
Coterra Energy Inc., founded in 1989 and headquartered in Houston, Texas, stands as a key player in the oil and gas exploration and production industry. The company operates a cohesive energy ecosystem focused on developing and producing oil, natural gas, and natural gas liquids across major U.S. basins. Coterra’s core assets include 177K net acres in Pennsylvania’s Marcellus Shale, 306K acres in the Permian Basin, and 182K acres in the Anadarko Basin, forming a diversified footprint that fuels its production engine.
Coterra generates revenue primarily through the extraction and sale of hydrocarbons to industrial users, local distribution firms, and energy marketers. Its balance of natural gas and liquids, supported by gathering and disposal systems in Texas, underpins stable cash flow across the Americas. This strategic mix, combined with a low beta of 0.36, gives Coterra a competitive advantage in volatile markets. The company’s scale and asset quality create a durable economic moat that shapes the future of U.S. energy supply.
Financial Performance & Fundamental Metrics
I analyze Coterra Energy Inc.’s income statement, key financial ratios, and dividend payout policy to assess its operational efficiency and shareholder value.
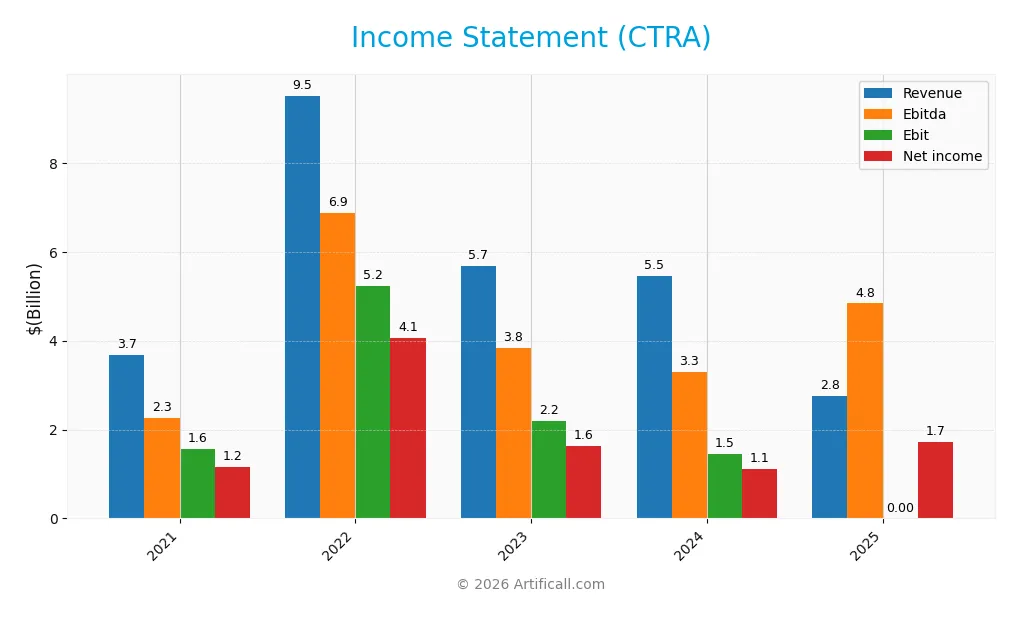
Income Statement
This table summarizes Coterra Energy Inc.’s annual income statement figures from 2021 through 2025 in USD.
| 2021 | 2022 | 2023 | 2024 | 2025 | |
|---|---|---|---|---|---|
| Revenue | 3.67B | 9.51B | 5.68B | 5.46B | 2.75B |
| Cost of Revenue | 1.61B | 3.45B | 3.48B | 3.77B | 1.09B |
| Operating Expenses | 164M | 327M | 279M | 302M | 260M |
| Gross Profit | 2.06B | 6.07B | 2.20B | 1.69B | 1.66B |
| EBITDA | 2.26B | 6.87B | 3.84B | 3.30B | 4.84B |
| EBIT | 1.56B | 5.24B | 2.20B | 1.45B | 0 |
| Interest Expense | 62M | 70M | 73M | 106M | 205M |
| Net Income | 1.16B | 4.07B | 1.63B | 1.12B | 1.72B |
| EPS | 2.30 | 5.10 | 2.14 | 1.51 | 2.25 |
| Filing Date | 2022-03-01 | 2023-02-27 | 2024-02-23 | 2025-02-25 | 2026-02-26 |
Income Statement Evolution
Coterra Energy’s revenue declined sharply by 50% from 2024 to 2025, continuing a downward trend since 2021. Despite this, net income rose 53% in the same period, reflecting improved net margins. Gross profit remained relatively stable, though margins compressed slightly. Operating expenses declined proportionally with revenue, maintaining expense discipline amid volatility.
Is the Income Statement Favorable?
In 2025, Coterra reported a strong net margin of 62.4%, favorable compared to industry standards, despite zero EBIT margin, indicating depreciation and amortization heavily impacted operating profit. Interest expense remained moderate at 7.45% of revenue. The mixed signals—robust net income but no EBIT—suggest cautious fundamentals, with significant non-cash charges affecting profitability metrics.
Financial Ratios
The following table summarizes key financial ratios for Coterra Energy Inc. over recent fiscal years, providing insight into profitability, liquidity, leverage, and valuation:
| Ratios | 2021 | 2022 | 2023 | 2024 | 2025 |
|---|---|---|---|---|---|
| Net Margin | 31.6% | 42.7% | 28.6% | 20.5% | 62.4% |
| ROE | 9.9% | 32.1% | 12.5% | 8.5% | 10.0% |
| ROIC | 7.8% | 23.7% | 7.6% | 5.6% | 8.8% |
| P/E | 8.3 | 4.8 | 11.9 | 16.9 | 11.7 |
| P/B | 0.81 | 1.54 | 1.48 | 1.44 | 1.17 |
| Current Ratio | 1.75 | 1.85 | 1.21 | 2.92 | 0.09 |
| Quick Ratio | 1.72 | 1.80 | 1.18 | 2.88 | 0.09 |
| D/E | 0.30 | 0.21 | 0.19 | 0.29 | 0.01 |
| Debt-to-Assets | 17.4% | 12.9% | 12.4% | 17.6% | 1.1% |
| Interest Coverage | 30.5 | 82.0 | 26.4 | 13.1 | 12.0 |
| Asset Turnover | 0.18 | 0.47 | 0.28 | 0.25 | 0.12 |
| Fixed Asset Turnover | 0.21 | 0.53 | 0.31 | 0.30 | 0.12 |
| Dividend Yield | 8.2% | 10.2% | 4.6% | 3.3% | 3.4% |
Evolution of Financial Ratios
Over the period, Coterra Energy’s Return on Equity (ROE) showed variability, peaking at 32.1% in 2022 and declining to 10.0% by 2025. The Current Ratio declined sharply from around 1.75 in 2021 to 0.09 in 2025, signaling deteriorating liquidity. The Debt-to-Equity ratio improved significantly, dropping from 0.30 in 2021 to 0.01 in 2025, indicating reduced leverage. Profitability fluctuated but remained relatively strong in 2025.
Are the Financial Ratios Fovorable?
In 2025, profitability ratios such as net margin (62.4%) and valuation multiples (P/E 11.7, P/B 1.17) are favorable, reflecting efficient cost control and reasonable market pricing. However, liquidity ratios are weak, with the Current and Quick ratios at 0.09, raising concerns about short-term obligations. Leverage is minimal, with a Debt-to-Equity ratio of 0.01 and low debt-to-assets. Asset turnover is low, suggesting operational inefficiency. Overall, the ratios are slightly favorable but require caution.
Shareholder Return Policy
Coterra Energy pays a consistent dividend with a payout ratio around 40%, supported by free cash flow coverage. The annual dividend yield stands near 3.4%, complemented by share buybacks, indicating a balanced capital return approach.
This distribution policy aligns with sustainable value creation, given the company’s strong cash flow and prudent payout ratio. However, investors should monitor potential risks if dividend growth outpaces cash generation or buybacks become excessive.
Score analysis
The radar chart below displays Coterra Energy Inc.’s key financial scores and valuation metrics:
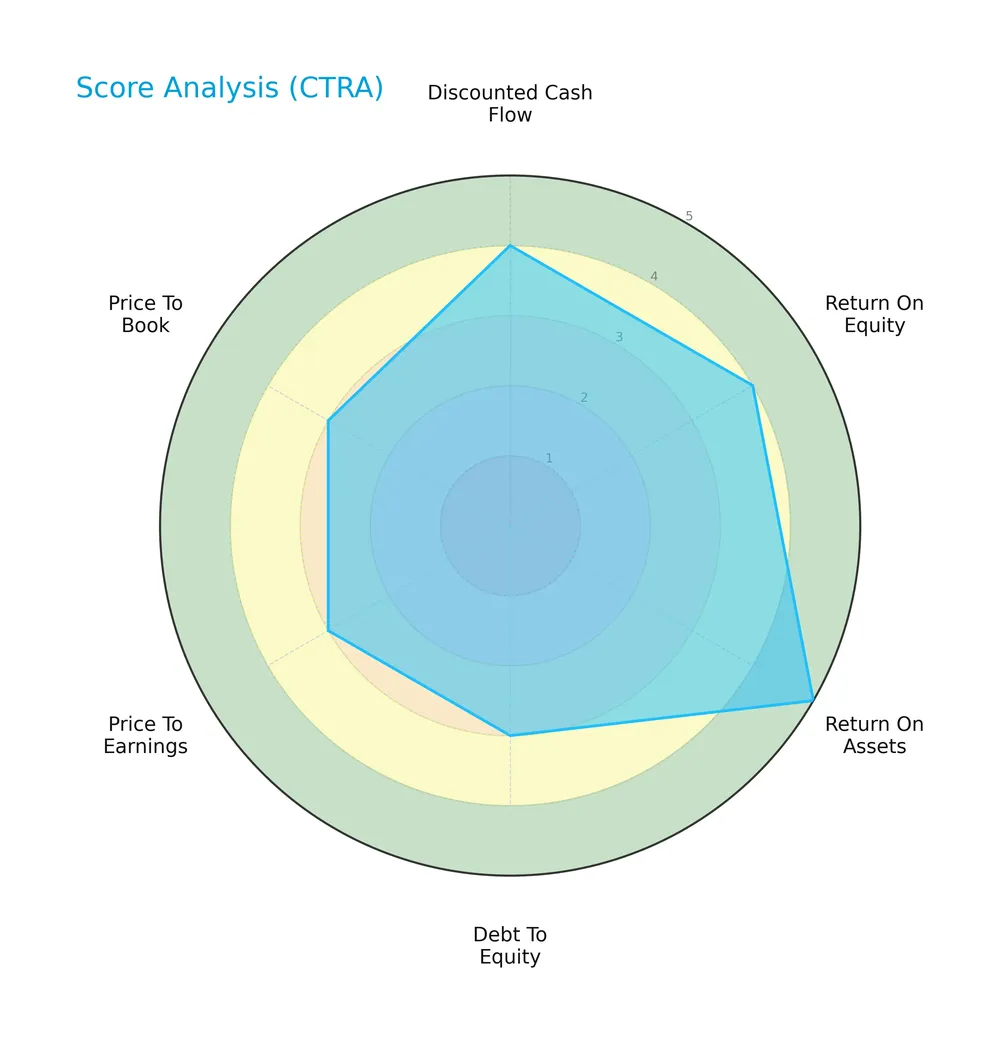
Coterra Energy scores favorably on discounted cash flow, return on equity, and return on assets, with a very favorable ROA score of 5. Debt-to-equity, price-to-earnings, and price-to-book ratios present moderate scores of 3, indicating balanced leverage and valuation levels.
Analysis of the company’s bankruptcy risk
The Altman Z-Score places Coterra Energy within the safe zone, signaling low bankruptcy risk based on its current financial ratios:

Is the company in good financial health?
The Piotroski Score chart illustrates Coterra Energy’s moderate financial health status:

With a Piotroski Score of 5, the company shows average financial strength. This score reflects a mix of positive and neutral signals regarding profitability, leverage, and operational efficiency.
Competitive Landscape & Sector Positioning
This sector analysis examines Coterra Energy Inc.’s strategic positioning, revenue segments, key products, and main competitors. I will assess whether Coterra holds a competitive advantage over its peers in the oil and gas exploration and production industry.
Strategic Positioning
Coterra Energy Inc. concentrates on oil, natural gas liquids, and condensate production in key U.S. basins: Marcellus Shale, Permian, and Anadarko. Its portfolio is geographically diversified across 665K net acres, with a clear focus on upstream exploration and production.
Revenue by Segment
This pie chart breaks down Coterra Energy Inc.’s revenue by segment for fiscal year 2024, highlighting contributions from Oil and Condensate.

Oil and Condensate clearly dominates Coterra’s revenue stream with 2.95B in 2024. Natural Gas Liquids showed notable volatility, peaking in 2022 at 964M before disappearing from the latest year’s data. Earlier years reveal minimal contributions from other segments. The concentration in Oil and Condensate suggests dependency risk but also reflects the company’s core operational strength. The 2024 data indicates stabilization after recent fluctuations.
Key Products & Brands
The following table summarizes Coterra Energy Inc.’s principal products and their descriptions:
| Product | Description |
|---|---|
| Oil and Condensate | Extracted hydrocarbons including crude oil and condensate, generating multi-billion-dollar annual revenues. |
| Natural Gas Liquids | Hydrocarbon liquids separated from natural gas, contributing hundreds of millions in yearly sales. |
| Oil And Gas, Other | Miscellaneous oil and gas products with minimal revenue contribution in recent years. |
Coterra Energy focuses on oil and condensate as its core revenue driver, supported by natural gas liquids. Other oil and gas products represent a marginal share. This portfolio reflects the company’s emphasis on liquid hydrocarbons in its U.S. shale operations.
Main Competitors
There are 10 main competitors in the Oil & Gas Exploration & Production industry; below are the top 10 leaders by market capitalization:
| Competitor | Market Cap. |
|---|---|
| ConocoPhillips | 120.5B |
| EOG Resources, Inc. | 58.8B |
| Diamondback Energy, Inc. | 44.3B |
| Occidental Petroleum Corporation | 41.8B |
| EQT Corporation | 33.4B |
| Expand Energy Corporation | 26.1B |
| Devon Energy Corporation | 24.2B |
| Texas Pacific Land Corporation | 20.5B |
| Coterra Energy Inc. | 20.3B |
| APA Corporation | 9.0B |
Coterra Energy ranks 9th among its top 10 competitors by market cap. Its scale is approximately 19% of the leader, ConocoPhillips. The company sits below both the average market cap of 39.9B and the sector median of 29.8B. It is about 10% smaller than the next competitor above, Texas Pacific Land Corporation, indicating a moderate gap in scale.
Comparisons with competitors
Check out how we compare the company to its competitors:
Does Coterra Energy Inc. have a competitive advantage?
Coterra Energy demonstrates a sustainable competitive advantage by consistently generating returns on invested capital (ROIC) 2.9% above its cost of capital (WACC). Its ROIC trend shows a 13.3% growth, signaling effective capital allocation and value creation in the oil and gas exploration sector.
Looking ahead, Coterra’s extensive acreage in key U.S. basins, including the Marcellus Shale, Permian, and Anadarko, supports future production growth. The company’s operations in natural gas and saltwater disposal systems also offer opportunities to enhance cash flow amid evolving energy demand.
SWOT Analysis
This analysis highlights Coterra Energy’s key internal and external factors shaping its competitive position.
Strengths
- strong net margin at 62%
- very favorable moat with ROIC above WACC
- low debt levels with debt-to-assets at 1.13%
Weaknesses
- poor liquidity with current ratio at 0.09
- declining revenue trend over 5 years
- low asset turnover signals inefficiency
Opportunities
- growth potential in Marcellus, Permian, Anadarko basins
- rising natural gas demand
- dividend yield attractive at 3.4%
Threats
- commodity price volatility
- regulatory risks in energy sector
- operational risks due to low asset utilization
Coterra’s robust profitability and competitive moat support value creation. However, liquidity constraints and revenue declines demand strategic focus on operational efficiency and capital allocation to mitigate external risks.
Stock Price Action Analysis
The weekly stock chart for Coterra Energy Inc. (CTRA) illustrates price movements and momentum over the past 12 months:

Trend Analysis
Over the past 12 months, CTRA’s stock price increased by 5.97%, indicating a bullish trend with acceleration. The stock ranged between 22.71 and 31.37, showing moderate volatility (1.99 std deviation). Recent months strengthened the uptrend, with a 14.24% rise and a slope of 0.59.
Volume Analysis
Trading volume has been increasing, with buyers accounting for 54.67% overall and 66.12% recently. Buyer dominance suggests strong demand and positive investor sentiment. The total volume exceeds 4B shares, reflecting heightened market participation and confidence in the stock’s upward momentum.
Target Prices
Analysts set a clear consensus target price for Coterra Energy Inc., reflecting moderate upside potential.
| Target Low | Target High | Consensus |
|---|---|---|
| 28 | 36 | 32.4 |
The target range between $28 and $36 signals cautious optimism. The consensus of $32.4 suggests analysts expect steady appreciation but with some volatility.

Don’t Let Luck Decide Your Entry Point
Optimize your entry points with our advanced ProRealTime indicators. You’ll get efficient buy signals with precise price targets for maximum performance. Start outperforming now!
Analyst & Consumer Opinions
This section examines analyst grades and consumer feedback to provide a balanced view of Coterra Energy Inc. (CTRA).
Stock Grades
Here are the latest verified analyst grades for Coterra Energy Inc. from recognized financial institutions:
| Grading Company | Action | New Grade | Date |
|---|---|---|---|
| Scotiabank | Downgrade | Sector Perform | 2026-02-03 |
| Susquehanna | Maintain | Positive | 2026-02-03 |
| Piper Sandler | Maintain | Overweight | 2026-01-28 |
| Susquehanna | Maintain | Positive | 2026-01-26 |
| Barclays | Maintain | Overweight | 2026-01-21 |
| JP Morgan | Maintain | Overweight | 2026-01-12 |
| UBS | Maintain | Buy | 2025-12-12 |
| Piper Sandler | Maintain | Overweight | 2025-11-18 |
| Piper Sandler | Maintain | Overweight | 2025-10-21 |
| Susquehanna | Maintain | Positive | 2025-10-20 |
Most analysts maintain a positive stance, predominantly rating Coterra as Overweight or Buy. The sole downgrade from Scotiabank to Sector Perform slightly tempers the otherwise consistent bullish sentiment.
Consumer Opinions
Consumer sentiment around Coterra Energy Inc. reflects a mix of appreciation for operational efficiency and concerns about market volatility.
| Positive Reviews | Negative Reviews |
|---|---|
| Strong operational focus drives consistent production. | Stock price volatility worries long-term investors. |
| Transparent communication builds shareholder trust. | Environmental concerns remain a frequent critique. |
| Effective cost management boosts profitability. | Dividend cuts in past cycles raise income doubts. |
Overall, consumers praise Coterra’s operational discipline and transparency. However, recurring concerns about environmental impact and stock volatility suggest caution for risk-averse investors.
Risk Analysis
Below is a summary table of key risks facing Coterra Energy Inc., highlighting their likelihood and potential impact:
| Category | Description | Probability | Impact |
|---|---|---|---|
| Liquidity Risk | Extremely low current and quick ratios at 0.09 pose cash flow strains. | High | High |
| Interest Coverage | Zero interest coverage signals inability to meet interest expenses. | High | High |
| Operational Risk | Exposure to commodity price volatility in oil and natural gas markets. | Medium | High |
| Asset Efficiency | Low asset turnover (0.12) suggests underutilized assets, limiting growth. | Medium | Medium |
| Financial Health | Altman Z-Score at 3.16 indicates safety, but Piotroski Score of 5 is only average. | Low | Medium |
Liquidity and interest coverage risks stand out as the most critical. The near-zero current ratio warns of tight short-term liquidity, while zero interest coverage raises solvency concerns. These weaknesses contrast with favorable leverage metrics and a solid Altman Z-Score, underscoring operational cash flow challenges amid a volatile energy sector.
Should You Buy Coterra Energy Inc.?
Coterra Energy appears to be in a very favorable position, with robust profitability and a durable moat supported by growing ROIC well above WACC. Despite a moderate leverage profile, its overall rating of A suggests strong value creation and operational efficiency.
Strength & Efficiency Pillars
Coterra Energy Inc. demonstrates strong operational efficiency with a net margin of 62.41% and a return on equity of 10.0%. Its return on invested capital (ROIC) stands at 8.81%, exceeding the weighted average cost of capital (WACC) at 5.91%, confirming the company as a value creator. The growing ROIC trend further signals a sustainable competitive advantage. Despite mixed margin trends, Coterra sustains a favorable moat and exhibits disciplined capital allocation.
Weaknesses and Drawbacks
Coterra faces challenges with liquidity, reflected in a critically low current ratio of 0.09, flagging potential short-term solvency issues. Interest coverage at zero indicates difficulty servicing debt through operating income, raising caution. While valuation metrics like P/E (11.67) and P/B (1.17) appear reasonable, the company’s asset turnover is weak at 0.12, suggesting underutilization of assets. These factors require careful monitoring despite a safe Altman Z-Score of 3.16.
Our Final Verdict about Coterra Energy Inc.
Coterra’s profile suggests a fundamentally sound company with a strong competitive position and value creation. The bullish long-term stock trend and buyer dominance further support its appeal. However, liquidity constraints and operational inefficiencies advise a cautious stance. This company may appear attractive for investors focused on long-term growth but could require patience for improvement in asset utilization and balance sheet strength.
Disclaimer: This content is for informational purposes only and does not constitute financial, investment, or other professional advice. Investing in financial markets involves a significant risk of loss, and past performance is not indicative of future results.
Additional Resources
- Coterra Energy Inc. Profit Rises In Q4 – Nasdaq (Feb 26, 2026)
- Coterra Energy (CTRA) Q4 Earnings Lag Estimates – Yahoo Finance (Feb 26, 2026)
- Coterra Energy (NYSE: CTRA) posts cash-rich 2025 and details all-stock Devon merger – Stock Titan (Feb 26, 2026)
- Coterra Energy (CTRA) Announces Dividend and Mixed Earnings Resu – GuruFocus (Feb 27, 2026)
- Coterra Energy (NYSE:CTRA) Posts Quarterly Earnings Results, Misses Estimates By $0.10 EPS – MarketBeat (Feb 26, 2026)
For more information about Coterra Energy Inc., please visit the official website: coterra.com