Home > Analyses > Consumer Defensive > Costco Wholesale Corporation
Costco Wholesale Corporation transforms everyday shopping into a value-driven experience for millions worldwide, redefining retail with its membership warehouse model. As a dominant force in the discount store industry, Costco excels through its extensive range of branded and private-label products, innovative services, and unwavering commitment to quality. Renowned for operational efficiency and customer loyalty, Costco continues to expand globally. The key question for investors now is whether its robust fundamentals and growth strategies sustain its premium market valuation and long-term potential.

Table of contents
Business Model & Company Overview
Costco Wholesale Corporation, founded in 1976 and headquartered in Issaquah, Washington, stands as a dominant player in the discount retail sector. Operating 815 membership warehouses across North America, Europe, and Asia, it delivers a unified ecosystem of branded and private-label goods spanning groceries, electronics, apparel, and specialty services such as pharmacies and gas stations. This extensive footprint supports a mission centered on value and convenience for its members worldwide.
The company’s revenue engine balances high-volume hardware sales through its warehouses with recurring membership fees and growing e-commerce platforms in multiple regions. This blend of physical and digital presence fuels consistent cash flow and customer loyalty. With a market cap exceeding 436B USD, Costco’s competitive advantage lies in its unique membership model and global reach, securing its role as a key architect of the discount retail industry’s future.
Financial Performance & Fundamental Metrics
I will analyze Costco Wholesale Corporation’s income statement, key financial ratios, and dividend payout policy to provide a clear view of its fundamental health.
Income Statement
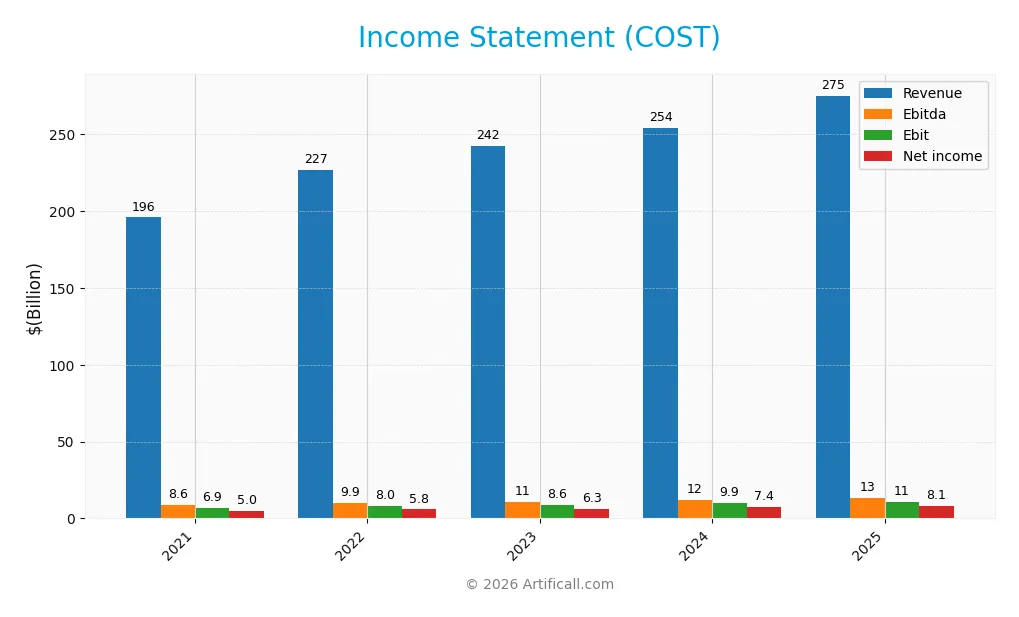
The table below presents Costco Wholesale Corporation’s key income statement figures for the fiscal years 2021 through 2025, reflecting the company’s financial performance.
| 2021 | 2022 | 2023 | 2024 | 2025 | |
|---|---|---|---|---|---|
| Revenue | 196B | 227B | 242B | 254B | 275B |
| Cost of Revenue | 171B | 199B | 213B | 222B | 240B |
| Operating Expenses | 18.5B | 19.8B | 21.6B | 22.8B | 25B |
| Gross Profit | 25.2B | 27.6B | 29.7B | 32.1B | 35.3B |
| EBITDA | 8.6B | 9.9B | 10.7B | 12.1B | 13.4B |
| EBIT | 6.9B | 8.0B | 8.6B | 9.9B | 11.0B |
| Interest Expense | 171M | 158M | 160M | 169M | 154M |
| Net Income | 5.0B | 5.8B | 6.3B | 7.4B | 8.1B |
| EPS | 11.3 | 13.2 | 14.2 | 16.6 | 18.2 |
| Filing Date | 2021-10-06 | 2022-10-05 | 2023-10-11 | 2024-10-09 | 2025-10-08 |
Income Statement Evolution
From 2021 to 2025, Costco Wholesale Corporation exhibited consistent revenue growth, rising from $196B to $275B, a 40.5% increase. Net income expanded even more robustly by 61.8% to $8.1B in 2025. Gross and net margins showed moderate improvement, with gross margin steady at around 12.8% and net margin near 2.9%, reflecting stable profitability despite rising operating expenses.
Is the Income Statement Favorable?
In 2025, Costco reported an 8.2% revenue increase and a 10.7% rise in EBIT, signaling operational strength. Interest expenses remained low at 0.06% of revenue, a favorable factor supporting net income growth of 9.96% in EPS. While operating expenses grew proportionately with revenue, the overall fundamentals, including margin enhancements and strong earnings growth, present a generally favorable income statement profile.
Financial Ratios
The following table presents a selection of key financial ratios for Costco Wholesale Corporation over the last five fiscal years, providing insight into profitability, valuation, liquidity, leverage, and efficiency:
| Ratios | 2021 | 2022 | 2023 | 2024 | 2025 |
|---|---|---|---|---|---|
| Net Margin | 2.56% | 2.57% | 2.60% | 2.90% | 2.94% |
| ROE | 28.51% | 28.31% | 25.11% | 31.19% | 27.77% |
| ROIC | 16.65% | 18.24% | 16.48% | 20.37% | 19.44% |
| P/E | 40.35 | 40.32 | 38.39 | 53.77 | 51.71 |
| P/B | 11.50 | 11.41 | 9.64 | 16.77 | 14.36 |
| Current Ratio | 1.00 | 1.02 | 1.07 | 0.97 | 1.03 |
| Quick Ratio | 0.52 | 0.46 | 0.57 | 0.44 | 0.55 |
| D/E | 0.58 | 0.44 | 0.35 | 0.35 | 0.28 |
| Debt-to-Assets | 17.10% | 14.09% | 12.88% | 11.85% | 10.60% |
| Interest Coverage | 39.23 | 49.32 | 50.71 | 54.94 | 67.42 |
| Asset Turnover | 3.31 | 3.54 | 3.51 | 3.64 | 3.57 |
| Fixed Asset Turnover | 7.43 | 8.28 | 8.24 | 8.04 | 7.95 |
| Dividend Yield | 2.85% | 0.64% | 0.52% | 2.28% | 0.52% |
Evolution of Financial Ratios
From 2021 to 2025, Costco’s Return on Equity (ROE) showed a generally positive trend, peaking at 31.19% in 2024 before slightly declining to 27.77% in 2025. The Current Ratio remained relatively stable, fluctuating near 1.0, indicating consistent liquidity. Meanwhile, the Debt-to-Equity Ratio improved significantly, dropping from 0.58 in 2021 to 0.28 in 2025, reflecting a lower reliance on debt. Profitability margins experienced minor increases, with net profit margin rising modestly to 2.94% in 2025.
Are the Financial Ratios Favorable?
In 2025, Costco demonstrates favorable profitability with ROE at 27.77% and Return on Invested Capital (ROIC) at 19.44%, signaling strong returns relative to equity and invested capital. Liquidity ratios show mixed signals: a neutral Current Ratio of 1.03 contrasts with an unfavorable Quick Ratio of 0.55. Leverage is favorable, with a low Debt-to-Equity of 0.28 and debt-to-assets at 10.6%. Market valuation ratios like Price-to-Earnings (51.71) and Price-to-Book (14.36) are unfavorable, indicating high market expectations. Overall, about half of the key ratios are favorable, suggesting a slightly favorable financial profile.
Shareholder Return Policy
Costco Wholesale Corporation consistently pays dividends with a payout ratio around 27%, a stable dividend per share near $4.92 in 2025, and a low annual yield of about 0.52%. The dividend is well covered by free cash flow, supported by moderate capital expenditures and operating cash flow generation. The company also engages in share buybacks, reinforcing shareholder returns.
This balanced approach of dividends and buybacks, underpinned by solid free cash flow coverage, suggests a sustainable strategy for long-term value creation. Risks from excessive distributions appear limited, given the company’s prudent payout ratio and cash flow strength.
Score analysis
The following radar chart presents an overview of Costco Wholesale Corporation’s key financial scores:
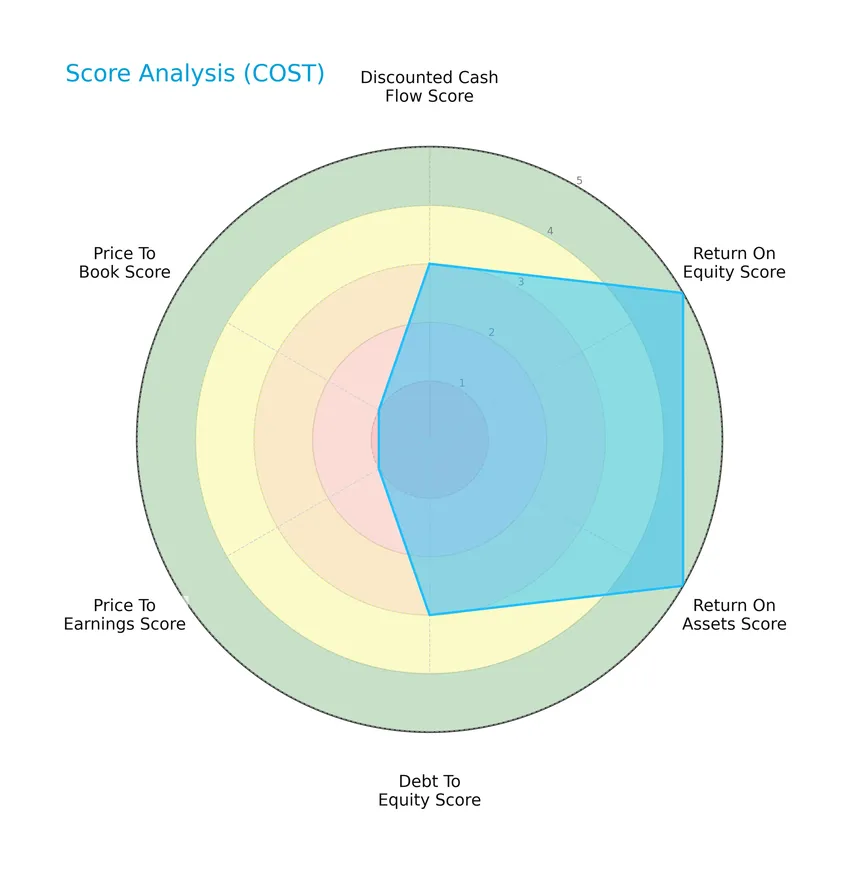
Costco shows very favorable returns on equity and assets, both scoring 5, while its discounted cash flow and debt-to-equity scores are moderate at 3. However, valuation metrics like price-to-earnings and price-to-book ratios are very unfavorable, each scoring 1.
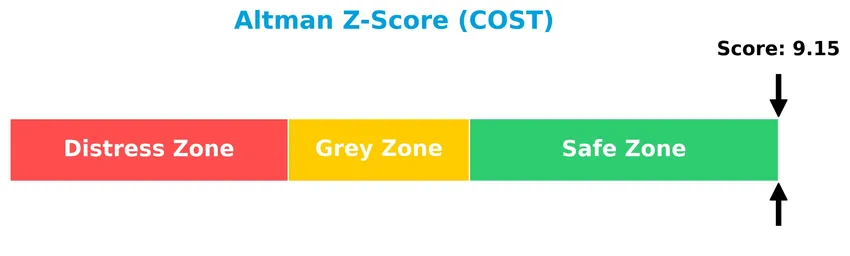
Analysis of the company’s bankruptcy risk
Costco Wholesale Corporation’s Altman Z-Score indicates a safe zone, suggesting a low risk of bankruptcy:
Is the company in good financial health?
This Piotroski diagram illustrates Costco’s strong financial health based on multiple criteria:

With a Piotroski Score of 8, Costco demonstrates very strong financial health, reflecting solid profitability, liquidity, and operational efficiency.
Competitive Landscape & Sector Positioning
This sector analysis will explore Costco Wholesale Corporation’s strategic positioning, revenue streams, key products, competitors, and competitive advantages. I will examine whether Costco holds a competitive advantage over its main industry rivals.
Strategic Positioning
Costco Wholesale Corporation maintains a diversified product portfolio spanning food, fresh food, non-foods, and various services, with FY2025 revenues of $109.6B in food and sundries and $71.2B in non-foods. Geographically, it operates predominantly in the US ($184B), with significant exposure in Canada ($34.9B) and other international markets ($38.3B), reflecting a broad geographic footprint across North America, Asia, and Europe.
Revenue by Segment
This pie chart displays Costco Wholesale Corporation’s revenue distribution by segment for the fiscal year 2025, illustrating the contribution of each major product category to the total revenue.
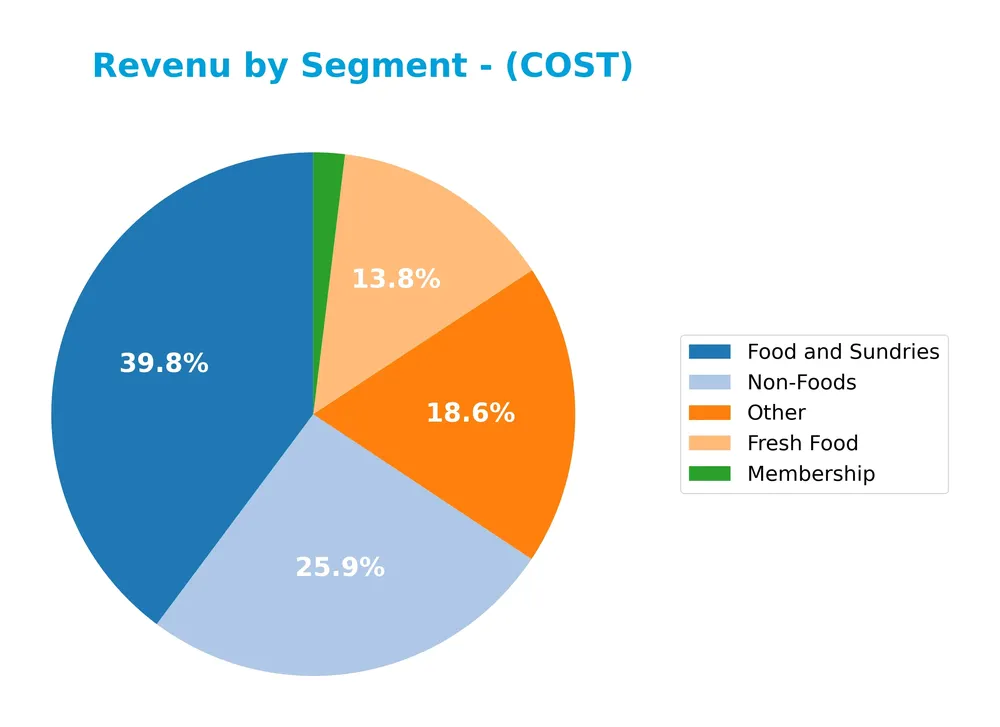
In 2025, Food and Sundries led Costco’s revenue with $110B, followed by Non-Foods at $71B and Other segments at $51B. Fresh Food generated $38B, while Membership fees contributed $5.3B. The steady growth in Food and Sundries and Non-Foods segments underscores their role as primary revenue drivers, with Membership revenues also showing consistent gains, indicating a solid business model with diversified income streams and moderate concentration risk.
Key Products & Brands
The table below outlines Costco Wholesale Corporation’s main product categories and brand offerings:
| Product | Description |
|---|---|
| Food and Sundries | Includes dry groceries, candies, coolers, freezers, liquor, tobacco, deli products, and various packaged food items. |
| Fresh Food | Comprises meat, produce, service deli, and bakery products. |
| Non-Foods | Covers appliances, electronics, health and beauty aids, hardware, garden and patio products, sporting goods, tires, toys, seasonal products, office supplies, automotive care products, postages, tickets, apparel, small appliances, furniture, domestics, housewares, special order kiosks, and jewelry. |
| Membership | Revenue generated from Costco’s membership warehouse fees. |
| Other | Encompasses services such as pharmacies, opticals, food courts, hearing-aid centers, tire installation centers, gas stations, business delivery, travel, same-day grocery, and online services. |
Costco Wholesale Corporation offers a broad assortment of products spanning food, fresh produce, and non-food items, complemented by membership fees and various in-store and online services.
Main Competitors
There are 6 competitors in total, with the following top 10 leaders by market capitalization listed below:
| Competitor | Market Cap. |
|---|---|
| Walmart Inc. | 899B |
| Costco Wholesale Corporation | 379B |
| Target Corporation | 46B |
| Dollar General Corporation | 30B |
| Dollar Tree, Inc. | 27B |
| BJ’s Wholesale Club Holdings | 12B |
Costco Wholesale Corporation ranks 2nd among its competitors, holding about 48.55% of the market cap of the leader, Walmart Inc. It is positioned above both the average market cap of the top 10 competitors (232B) and the sector median (38B). Costco also has a significant 105.99% market cap gap above its closest competitor, Target Corporation.
Comparisons with competitors
Check out how we compare the company to its competitors:
Does COST have a competitive advantage?
Costco Wholesale Corporation presents a very favorable competitive advantage, demonstrated by a ROIC significantly above its WACC and a growing ROIC trend, indicating efficient capital use and value creation. The company’s ability to generate excess returns consistently over the 2021-2025 period supports its durable economic moat and strong market position.
Looking ahead, Costco’s extensive international footprint with 815 membership warehouses across multiple countries and diversified product and service offerings suggest opportunities for further market expansion and revenue growth. Continued innovation in e-commerce and service delivery may contribute to sustaining its competitive edge in the discount retail sector.
SWOT Analysis
This SWOT analysis highlights Costco Wholesale Corporation’s key internal strengths and weaknesses, alongside external opportunities and threats, to guide strategic investment decisions.
Strengths
- Strong global presence with 815 warehouses
- Consistent revenue and net income growth of 40% and 62% over 5 years
- Very favorable financial health with high ROE (27.77%) and ROIC (19.44%)
Weaknesses
- High valuation multiples (PE 51.71, PB 14.36)
- Low dividend yield (0.52%) limiting income appeal
- Quick ratio below 1 (0.55) indicating liquidity constraints
Opportunities
- Expansion in international markets with growing sales outside the US
- Increasing e-commerce capabilities and same-day delivery services
- Opportunity to improve operational efficiency to manage operating expenses growth
Threats
- Intense competition in discount retail sector
- Rising operational costs impacting margins
- Macroeconomic risks such as inflation and supply chain disruptions
Costco’s robust competitive moat and financial strength support a resilient growth outlook, but elevated valuation and operational cost pressures call for cautious risk management. Strategic focus should balance international expansion and efficiency improvements to sustain profitability.
Stock Price Action Analysis
The weekly stock chart for Costco Wholesale Corporation (COST) illustrates price movements and trend behavior over the last 100 weeks:
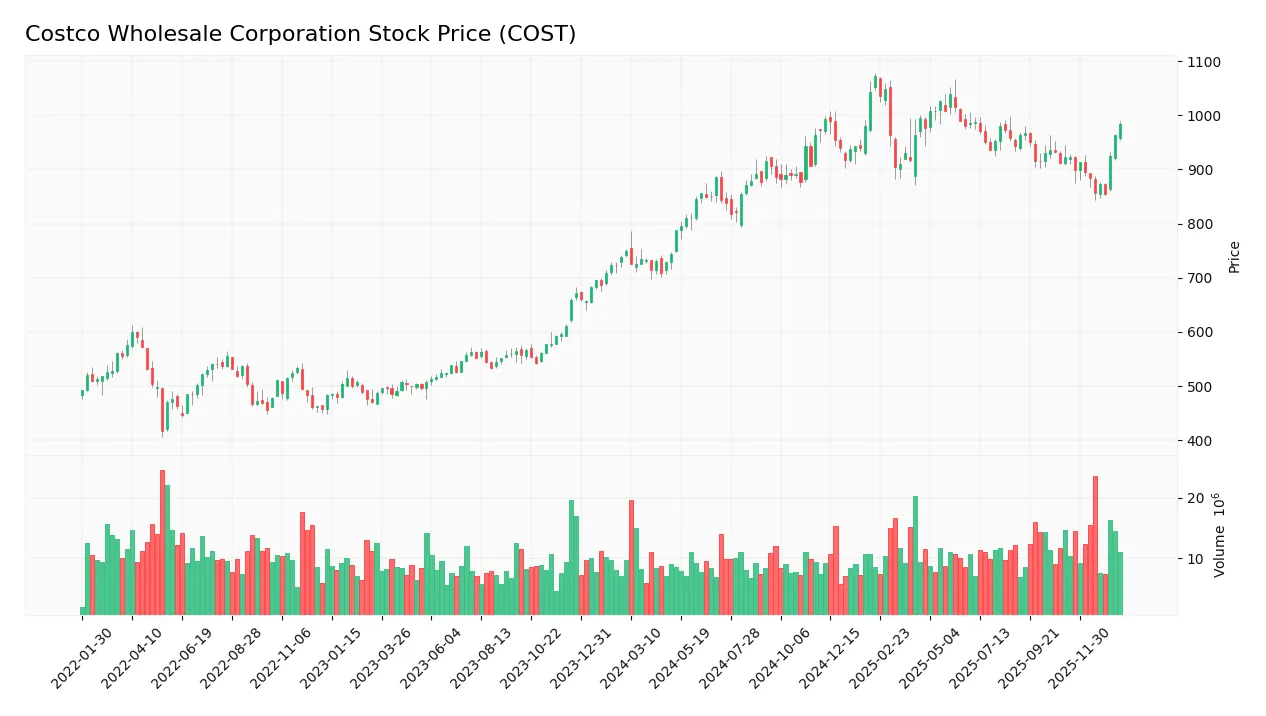
Trend Analysis
Over the past 100 weeks, COST’s stock price increased by 31.2%, indicating a bullish trend with clear acceleration. The price ranged from a low of 709.51 to a high of 1071.85, supported by a relatively high volatility measured by an 83.35 standard deviation. The recent 11-week period continued this momentum with a 6.56% gain and a trend slope of 2.88.
Volume Analysis
In the last three months, trading volume has been increasing with a total buyer volume slightly exceeding seller volume at 53.24% buyer dominance. This slightly buyer-driven activity suggests moderate investor confidence and growing market participation in COST shares during this period.
Target Prices
The consensus target prices for Costco Wholesale Corporation reflect a generally optimistic outlook among analysts.
| Target High | Target Low | Consensus |
|---|---|---|
| 1171 | 769 | 1025.08 |
Analysts expect Costco’s stock to trade within a range from 769 to 1171, with a consensus target around 1025, indicating confidence in continued growth potential.

Don’t Let Luck Decide Your Entry Point
Optimize your entry points with our advanced ProRealTime indicators. You’ll get efficient buy signals with precise price targets for maximum performance. Start outperforming now!
Analyst & Consumer Opinions
This section examines the latest grades and consumer feedback related to Costco Wholesale Corporation’s market performance and customer satisfaction.
Stock Grades
Here is the latest overview of Costco Wholesale Corporation’s stock grades from reputable financial analysts and firms:
| Grading Company | Action | New Grade | Date |
|---|---|---|---|
| Telsey Advisory Group | Maintain | Outperform | 2026-01-08 |
| Mizuho | Upgrade | Outperform | 2026-01-05 |
| Telsey Advisory Group | Maintain | Outperform | 2026-01-02 |
| Northcoast Research | Upgrade | Buy | 2025-12-24 |
| Wells Fargo | Maintain | Equal Weight | 2025-12-19 |
| Roth Capital | Downgrade | Sell | 2025-12-15 |
| JP Morgan | Maintain | Overweight | 2025-12-12 |
| Goldman Sachs | Maintain | Buy | 2025-12-12 |
| Telsey Advisory Group | Maintain | Outperform | 2025-12-12 |
| Baird | Maintain | Outperform | 2025-12-12 |
The consensus among these analysts leans toward positive sentiment with multiple upgrades to outperform and buy ratings, though a minority maintain neutral or sell stances, reflecting some divergence in risk perception. Overall, the trend shows growing confidence in Costco’s performance prospects.
Consumer Opinions
Costco Wholesale Corporation continues to earn strong loyalty from its customers, though some areas reveal room for improvement.
| Positive Reviews | Negative Reviews |
|---|---|
| “Excellent product quality and unbeatable bulk pricing.” | “Occasionally long checkout lines during peak hours.” |
| “Friendly and helpful staff enhances the shopping experience.” | “Limited variety in some specialty product categories.” |
| “Clean stores and well-organized aisles make shopping easy.” | “Membership fees can be a deterrent for occasional shoppers.” |
Overall, consumers appreciate Costco’s value and customer service, but concerns about wait times and product variety persist. Balancing cost efficiency with enhanced convenience could strengthen customer satisfaction further.
Risk Analysis
Below is a summary table highlighting key risk categories, their descriptions, likelihood, and potential impact on Costco Wholesale Corporation’s investment profile:
| Category | Description | Probability | Impact |
|---|---|---|---|
| Valuation Risk | High P/E (51.7) and P/B (14.36) ratios indicate stock may be overvalued. | High | High |
| Profit Margin Risk | Net margin is low (2.94%), which is unfavorable for profitability resilience. | Medium | Medium |
| Liquidity Risk | Quick ratio at 0.55 suggests possible short-term liquidity constraints. | Medium | Medium |
| Market Volatility | Beta near 1.0 implies stock price moves in line with market fluctuations. | Medium | Medium |
| Competitive Risk | Intense competition in retail and discount store sector globally. | Medium | High |
| Economic Risk | Exposure to consumer spending cycles and inflation impacts. | Medium | High |
| Debt Risk | Low debt-to-equity (0.28) and strong interest coverage reduce financial risk. | Low | Low |
The most significant risks for Costco stem from its high valuation multiples and low net profit margins, which could limit upside in a market downturn. However, strong financial health, with a safe Altman Z-score (9.15) and a very strong Piotroski score (8), supports resilience. Vigilance on margin pressures and economic shifts remains essential.
Should You Buy Costco Wholesale Corporation?
Costco Wholesale Corporation appears to be a robust value creator with a durable competitive moat, reflected in its growing ROIC and strong profitability metrics. Despite a manageable leverage profile and some valuation concerns, its overall rating of B+ suggests a very favorable financial health profile.
Strength & Efficiency Pillars
Costco Wholesale Corporation exhibits robust profitability and value creation, underscored by a return on equity (ROE) of 27.77% and a return on invested capital (ROIC) of 19.44%. Notably, the ROIC exceeds the weighted average cost of capital (WACC) at 8.49%, confirming the company as a clear value creator. Financial health metrics are impressive, with a strong Altman Z-Score of 9.15 placing Costco securely in the safe zone, and a Piotroski Score of 8 indicating very strong financial strength. These factors collectively highlight Costco’s durable competitive advantage and operational efficiency.
Weaknesses and Drawbacks
Despite its strengths, Costco faces valuation challenges that may temper enthusiasm. The price-to-earnings (P/E) ratio stands at a lofty 51.71, and the price-to-book (P/B) ratio is elevated at 14.36, both signaling an expensive premium that could expose investors to downside risk. Liquidity ratios show caution, with a quick ratio of 0.55 flagged as unfavorable, suggesting limited short-term asset coverage. Additionally, the dividend yield at 0.52% is modest, potentially less attractive for income-focused investors. These metrics highlight valuation and liquidity concerns that warrant careful consideration.
Our Verdict about Costco Wholesale Corporation
Costco’s long-term fundamental profile appears favorable, supported by solid profitability and strong financial health indicators. The bullish overall stock trend, coupled with a slightly buyer-dominant recent period, suggests positive momentum but also advises some prudence. Despite Costco’s intrinsic strength and value creation, the premium valuation metrics could imply that investors might consider a wait-and-see approach for a more favorable entry point. The profile may appear attractive for disciplined investors prioritizing sustainable growth.
Disclaimer: This content is for informational purposes only and does not constitute financial, investment, or other professional advice. Investing in financial markets involves a significant risk of loss, and past performance is not indicative of future results.
Additional Resources
- Costco Wholesale Corporation $COST Stock Position Raised by Ardent Capital Management Inc. – MarketBeat (Jan 24, 2026)
- Insider Sell: Teresa Jones Sells Shares of Costco Wholesale Corp – GuruFocus (Jan 24, 2026)
- Earnings Preview: What to Expect From Costco Wholesale’s Report – FinancialContent (Jan 23, 2026)
- Costco: Strong Start To 2026 Likely Short-Lived (NASDAQ:COST) – Seeking Alpha (Jan 22, 2026)
- Investors Heavily Search Costco Wholesale Corporation (COST): Here is What You Need to Know – Yahoo Finance (Jan 06, 2026)
For more information about Costco Wholesale Corporation, please visit the official website: costco.com