Home > Analyses > Real Estate > CoStar Group, Inc.
CoStar Group, Inc. transforms how commercial real estate professionals access and analyze property data. Its flagship platforms—from CoStar Property to LoopNet—set the standard for market intelligence and leasing solutions. Known for pioneering innovation and unmatched data quality, CoStar dominates the digital real estate services landscape. As market dynamics shift, I ask: does CoStar’s robust moat and growth engine still justify its current valuation and future potential?

Table of contents
Business Model & Company Overview
CoStar Group, Inc., founded in 1987 and headquartered in Washington, DC, stands as a dominant force in real estate services. It unifies an extensive suite of information, analytics, and online marketplaces for commercial, residential, and hospitality sectors. This ecosystem integrates property listings, market analytics, tenant data, and lease management tools, driving efficiency for real estate professionals across multiple verticals.
The company’s revenue engine blends subscription-based software with online marketplace transactions, balancing recurring income and transaction fees. Its strategic footprint spans the Americas, Europe, and Asia Pacific, offering vital data and marketing platforms worldwide. CoStar’s competitive advantage lies in its data depth and network effects, creating a formidable economic moat that shapes the global real estate landscape.
Financial Performance & Fundamental Metrics
I will analyze CoStar Group, Inc.’s income statement, key financial ratios, and dividend payout policy to assess its core financial health and shareholder returns.
Income Statement
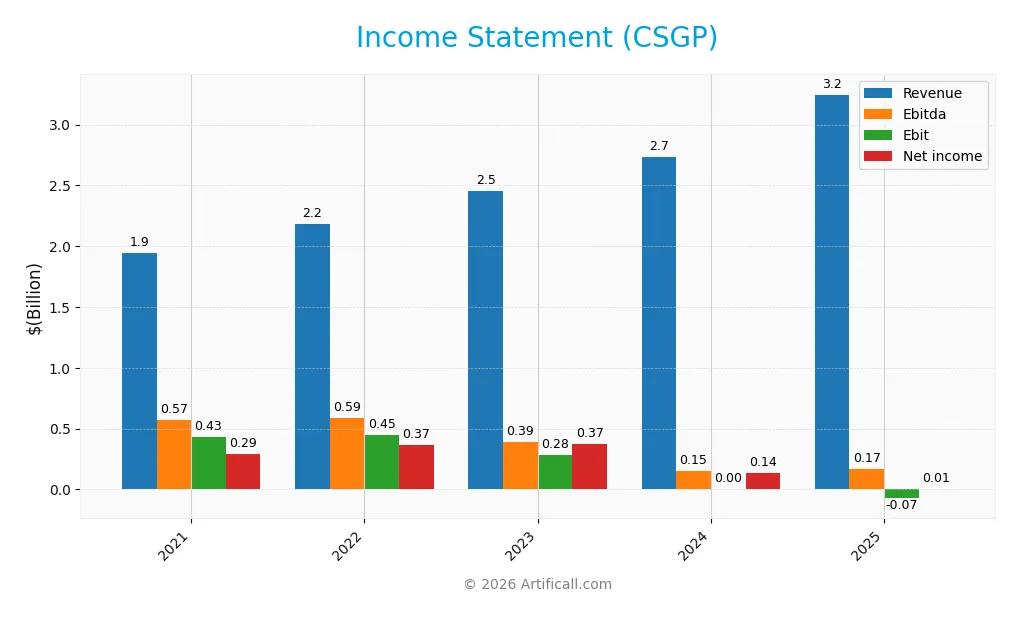
The table below details CoStar Group, Inc.’s key income statement figures from 2021 to 2025, illustrating revenue growth alongside fluctuating profitability metrics.
| 2021 | 2022 | 2023 | 2024 | 2025 | |
|---|---|---|---|---|---|
| Revenue | 1.94B | 2.18B | 2.46B | 2.74B | 3.25B |
| Cost of Revenue | 357M | 414M | 492M | 559M | 804M |
| Operating Expenses | 1.15B | 1.32B | 1.68B | 2.17B | 2.52B |
| Gross Profit | 1.59B | 1.77B | 1.96B | 2.18B | 2.44B |
| EBITDA | 572M | 589M | 390M | 152M | 170M |
| EBIT | 432M | 451M | 282M | 5M | -72M |
| Interest Expense | 31.6M | 0 | 31.4M | 27.4M | 0 |
| Net Income | 293M | 370M | 375M | 139M | 7M |
| EPS | 0.75 | 0.93 | 0.92 | 0.34 | 0.017 |
| Filing Date | 2022-02-23 | 2023-02-22 | 2024-02-22 | 2025-02-20 | 2026-02-24 |
Income Statement Evolution
From 2021 to 2025, CoStar Group’s revenue grew 67% to $3.25B, showing strong top-line expansion. Gross margin remained robust at 75%, reflecting consistent cost control. However, net income sharply declined by 98%, with margins deteriorating markedly. The EBIT margin turned negative in 2025, signaling rising operating costs despite revenue growth.
Is the Income Statement Favorable?
In 2025, revenue increased 19% year-over-year to $3.25B, but net income collapsed to $7M, down 95%. Operating expenses grew proportionally with revenue, eroding EBIT to a negative $72M. Interest expense was negligible, but the net margin stood at a razor-thin 0.22%, indicating weak profitability fundamentals. Overall, the income statement reflects significant margin pressure and declining earnings quality.
Financial Ratios
The following table summarizes key financial ratios for CoStar Group, Inc. (CSGP) over the last five fiscal years:
| Ratios | 2021 | 2022 | 2023 | 2024 | 2025 |
|---|---|---|---|---|---|
| Net Margin | 15.1% | 16.9% | 15.3% | 5.1% | 0.2% |
| ROE | 5.1% | 5.4% | 5.1% | 1.8% | 0.08% |
| ROIC | 4.5% | 4.2% | 2.5% | 0.04% | -0.17% |
| P/E | 106 | 83 | 95 | 210 | 4004 |
| P/B | 5.43 | 4.46 | 4.83 | 3.85 | 3.36 |
| Current Ratio | 11.8 | 13.9 | 12.0 | 9.0 | 2.8 |
| Quick Ratio | 11.7 | 13.9 | 12.0 | 9.0 | 2.8 |
| D/E | 0.19 | 0.16 | 0.15 | 0.14 | 0.12 |
| Debt-to-Assets | 15.3% | 13.2% | 12.4% | 11.3% | 9.7% |
| Interest Coverage | 13.7 | — | 9.0 | 0.17 | 0 |
| Asset Turnover | 0.27 | 0.26 | 0.28 | 0.30 | 0.31 |
| Fixed Asset Turnover | 5.22 | 5.43 | 4.45 | 2.45 | 2.25 |
| Dividend Yield | 0% | 0% | 0% | 0% | 0% |
Evolution of Financial Ratios
Over the period, CoStar Group’s Return on Equity (ROE) declined sharply, reaching 0.08% in 2025, signaling deteriorating profitability. The Current Ratio contracted from a high 12.01 in 2023 to 2.84 in 2025, indicating reduced liquidity but still above 1. Debt-to-Equity Ratio improved, falling from 0.19 to 0.12, reflecting better leverage management.
Are the Financial Ratios Fovorable?
In 2025, profitability metrics like net margin (0.22%) and ROE (0.08%) are unfavorable, signaling weak returns despite a WACC of 7.35% which is considered favorable. Liquidity ratios (Current and Quick at 2.84) and leverage ratios (Debt-to-Equity at 0.12 and debt-to-assets at 9.69%) appear favorable. However, efficiency ratios such as asset turnover (0.31) and interest coverage (0) are unfavorable, contributing to an overall unfavorable financial ratio profile.
Shareholder Return Policy
CoStar Group, Inc. (CSGP) does not pay dividends, reflecting its focus on reinvestment and growth. The company maintains a positive free cash flow but prioritizes capital allocation toward expansion rather than shareholder distributions.
No share buyback programs are indicated, aligning with a strategy to support long-term value creation through sustained investment. This approach suits firms in development phases, though investors should monitor profitability trends and cash flow sustainability closely.
Score analysis
The radar chart below illustrates the company’s key financial metric scores for investor evaluation:
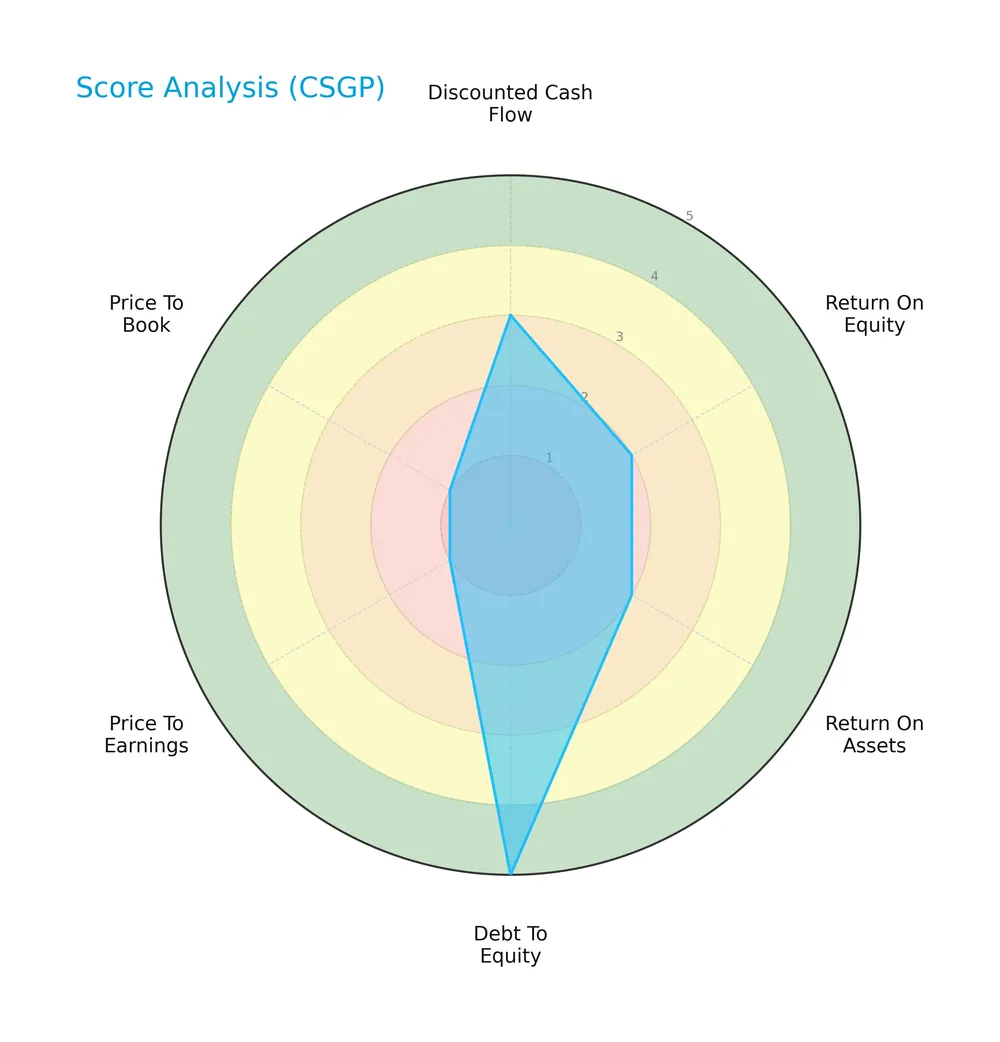
CoStar Group’s discounted cash flow score is moderate at 3, while return on equity and assets scores are unfavorable at 2 each. The debt-to-equity score stands out as very favorable at 5. Price-to-earnings and price-to-book scores are very unfavorable at 1 each.
Analysis of the company’s bankruptcy risk
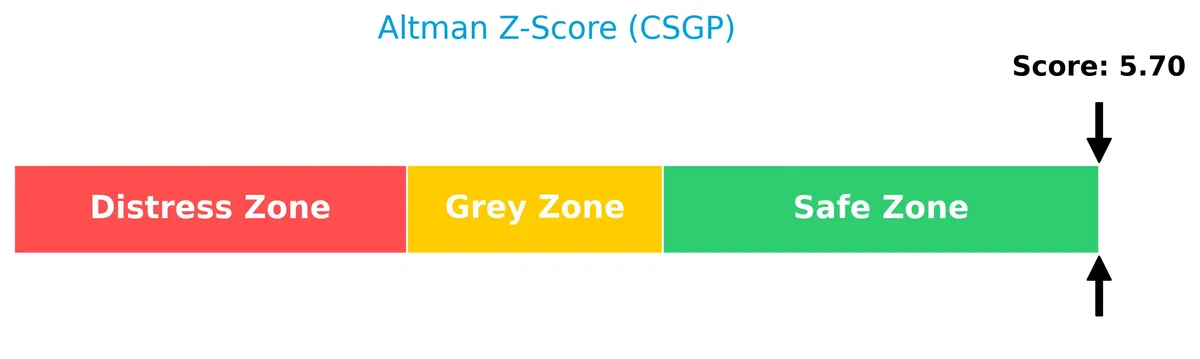
The Altman Z-Score places the company firmly in the safe zone, indicating a low risk of bankruptcy:
Is the company in good financial health?
The Piotroski diagram below presents the company’s financial strength based on nine key criteria:

With a Piotroski score of 5, the company’s financial health is average. This suggests moderate strength but leaves room for improvement in profitability and efficiency measures.
Competitive Landscape & Sector Positioning
This section will analyze CoStar Group, Inc.’s strategic positioning, revenue segments, key products, and main competitors in real estate services. I will assess whether CoStar Group holds competitive advantages against its industry peers.
Strategic Positioning
CoStar Group, Inc. concentrates heavily in North America, generating over $2.36B in 2023, with minimal Non-US exposure near $89M. Its product portfolio diversifies across information services, online marketplaces, and residential sectors, led by the CoStar Suite, which consistently exceeds $1B in revenue.
Revenue by Segment
This pie chart illustrates CoStar Group, Inc.’s revenue distribution by product segment for the fiscal year 2024, highlighting key business drivers and their relative contributions.
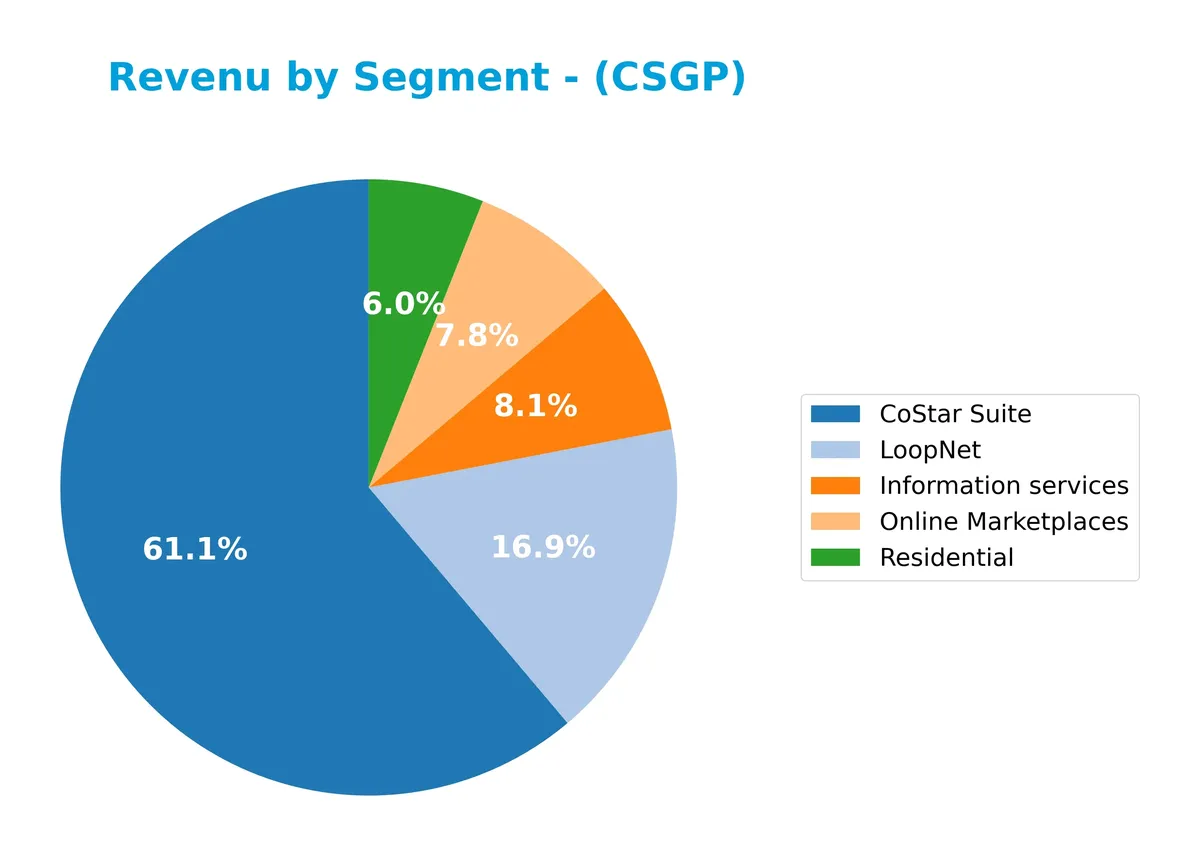
In 2024, the CoStar Suite dominates with $1.02B, reflecting its core role in the company’s portfolio. LoopNet and Online Marketplaces contribute $282M and $130M respectively, maintaining steady traction. Information services and Residential segments show smaller shares at $136M and $101M. The overall trend suggests growing concentration in flagship products, with moderate expansion in marketplace offerings, signaling a balanced yet focused revenue mix.
Key Products & Brands
The table below outlines CoStar Group’s primary products and brands with concise descriptions:
| Product | Description |
|---|---|
| CoStar Suite | Comprehensive commercial real estate data and analytics platform covering multiple property types. |
| Information Services | Databases and analytical tools providing market trends, lease data, and tenant information. |
| LoopNet | Online marketplace specializing in commercial real estate listings and premium advertising. |
| Online Marketplaces | Platforms for residential rentals, rural land, businesses, franchises, and auction services. |
| Residential | Apartment marketing websites targeting diverse rental markets including student and corporate housing. |
CoStar Group’s offerings span commercial and residential real estate information, analytics, and marketplaces, reflecting a diversified revenue base across data services and digital platforms.
Main Competitors
The sector includes 2 competitors, with the table showing the top 10 leaders by market capitalization:
| Competitor | Market Cap. |
|---|---|
| CBRE Group, Inc. | 47.7B |
| CoStar Group, Inc. | 27.8B |
CoStar Group ranks 2nd among its competitors, with a market cap at 39.81% of the leader, CBRE Group. The company sits below both the average market cap of the top 10 and the sector median, reflecting a smaller scale. It trails CBRE by a significant 151.18%, indicating a substantial gap to its closest rival.
Comparisons with competitors
Check out how we compare the company to its competitors:
Does CSGP have a competitive advantage?
CoStar Group, Inc. does not present a competitive advantage as its return on invested capital (ROIC) significantly underperforms its cost of capital (WACC), indicating value destruction. The company shows a declining ROIC trend, reflecting deteriorating profitability and inefficient capital use over 2021-2025.
Looking ahead, CoStar Group continues expanding its product suite and geographic reach, including commercial real estate analytics and online marketplaces across North America and internationally. These initiatives offer growth opportunities but must overcome current profitability challenges to build a sustainable competitive position.
SWOT Analysis
This SWOT analysis highlights CoStar Group, Inc.’s key internal and external factors influencing its market position and strategic options.
Strengths
- strong market presence in commercial real estate services
- diversified digital platforms and data analytics
- solid liquidity with current ratio at 2.84
Weaknesses
- declining profitability with negative ROIC
- unfavorable net margin and ROE
- high valuation multiples indicating overpricing
Opportunities
- expanding international footprint
- growing demand for data-driven real estate insights
- potential to improve operational efficiency
Threats
- intense competition in real estate data services
- macroeconomic risks impacting commercial real estate
- technological disruption and changing client needs
CoStar faces a pivotal moment; its strong market foothold and liquidity provide a buffer, but deteriorating profitability demands strategic refocus. The company must leverage growth opportunities abroad and innovate to mitigate competitive and economic pressures.
Stock Price Action Analysis
The weekly stock chart for CoStar Group, Inc. (CSGP) reveals a sustained downward trajectory over the past year with notable price fluctuations:
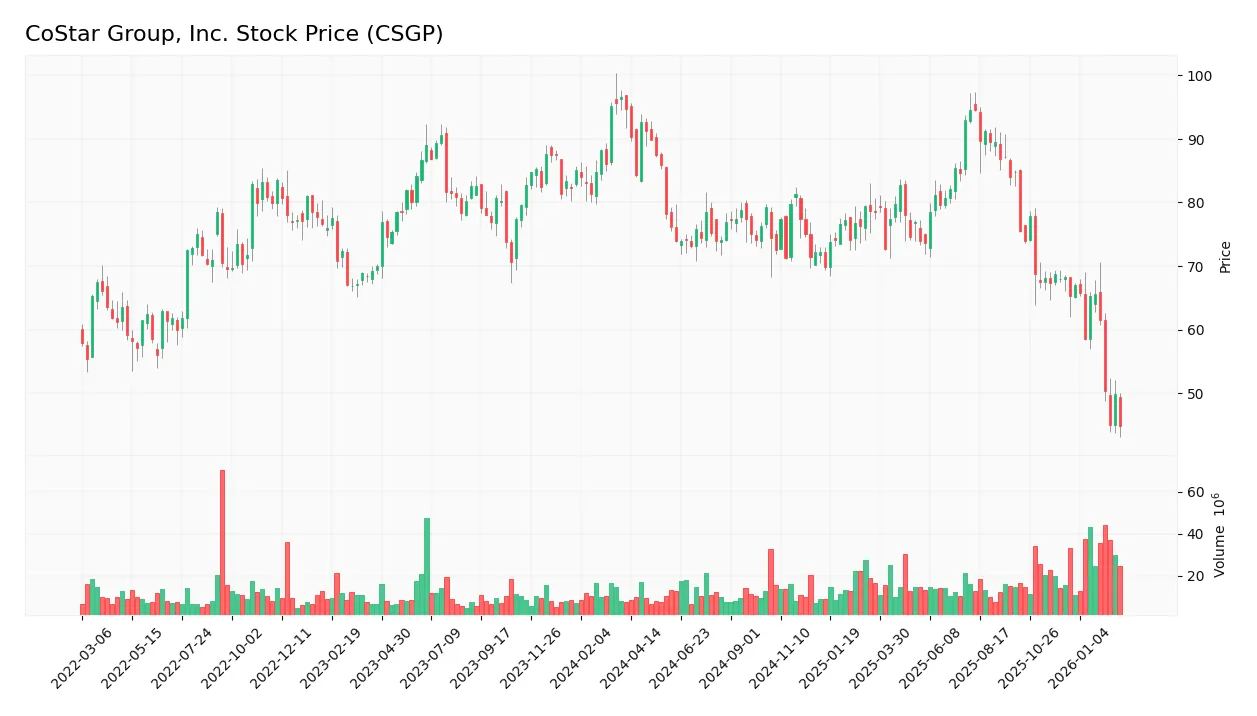
Trend Analysis
Over the past 12 months, CSGP’s stock price declined sharply by 52.74%, indicating a clear bearish trend. The highest and lowest prices registered were 94.75 and 44.78, respectively. The trend shows deceleration with significant volatility, as reflected by a standard deviation of 9.54%. The recent three-month trend also confirms continued bearish momentum with a 34.37% drop.
Volume Analysis
Trading volumes over the last three months show increasing activity but remain seller-dominant, with sellers accounting for 64.47% of volume. The rising volume alongside strong seller presence suggests weak investor confidence and heightened selling pressure, limiting upward price recovery prospects.
Target Prices
Analysts present a balanced target consensus for CoStar Group, Inc., reflecting moderate optimism.
| Target Low | Target High | Consensus |
|---|---|---|
| 48 | 105 | 71.5 |
The target range spans from a cautious $48 to an ambitious $105, with a consensus near $71.5, suggesting steady growth expectations.

Don’t Let Luck Decide Your Entry Point
Optimize your entry points with our advanced ProRealTime indicators. You’ll get efficient buy signals with precise price targets for maximum performance. Start outperforming now!
Analyst & Consumer Opinions
This section examines the latest analyst grades and consumer feedback related to CoStar Group, Inc. (CSGP).
Stock Grades
Here are the latest verified stock grades for CoStar Group, Inc. from leading financial institutions:
| Grading Company | Action | New Grade | Date |
|---|---|---|---|
| Goldman Sachs | Maintain | Buy | 2026-02-25 |
| Keefe, Bruyette & Woods | Maintain | Outperform | 2026-02-25 |
| Wells Fargo | Maintain | Underweight | 2026-02-25 |
| Citizens | Maintain | Market Outperform | 2026-02-25 |
| Needham | Maintain | Buy | 2026-02-25 |
| RBC Capital | Maintain | Sector Perform | 2026-02-25 |
| Wells Fargo | Maintain | Underweight | 2026-02-04 |
| BTIG | Upgrade | Buy | 2026-01-27 |
| Keefe, Bruyette & Woods | Maintain | Outperform | 2026-01-12 |
| Citizens | Maintain | Market Outperform | 2026-01-08 |
The overall trend shows a majority of buy and outperform ratings with few underweight and sector perform grades. Notably, BTIG upgraded from neutral to buy, signaling growing confidence in the stock’s outlook.
Consumer Opinions
CoStar Group, Inc. evokes strong reactions from its user base, reflecting its significant impact on commercial real estate data services.
| Positive Reviews | Negative Reviews |
|---|---|
| Comprehensive, accurate data sets | High subscription costs |
| User-friendly platform with robust tools | Occasional slow customer support |
| Valuable market insights for investors | Steep learning curve for new users |
| Reliable and timely updates | Limited customization options |
Overall, consumers appreciate CoStar’s data accuracy and platform reliability. However, the high cost and customer service issues persist as common concerns. This mix suggests strength in product quality but room for improvement in user experience and pricing strategy.
Risk Analysis
Below is a concise summary of key risks facing CoStar Group, Inc., detailing their likelihood and potential impact:
| Category | Description | Probability | Impact |
|---|---|---|---|
| Valuation Risk | Extremely high P/E ratio (4003.66) signals overvaluation risk in turbulent markets. | High | High |
| Profitability Risk | Negative ROIC (-17%) versus WACC (7.35%) indicates value destruction. | High | High |
| Liquidity Risk | Strong current ratio (2.84) mitigates short-term solvency concerns. | Low | Low |
| Debt Risk | Low debt-to-equity (0.12) and favorable interest coverage (0) denote low leverage but zero interest coverage is a red flag. | Moderate | Moderate |
| Market Volatility | Beta of 0.85 suggests below-market volatility but recent 8.9% price drop warns of sensitivity. | Moderate | Moderate |
| Dividend Risk | No dividend yield may deter income investors, increasing reliance on growth. | High | Medium |
Profitability and valuation stand out as the most critical risks. The company’s negative ROIC against a healthy WACC signals poor capital allocation. Coupled with a P/E ratio far exceeding industry norms, this raises concerns about sustainability. The recent nearly 9% share price drop underlines market skepticism. Liquidity and leverage appear manageable, but zero interest coverage demands close monitoring.
Should You Buy CoStar Group, Inc.?
CoStar Group appears to be in a safe zone financially, supported by a manageable leverage profile but suffers from a declining profitability moat and weak operational efficiency. Despite these challenges, its overall B- rating suggests a mixed but cautiously favorable investment profile.
Strength & Efficiency Pillars
CoStar Group, Inc. reports a robust gross margin of 75.24%, demonstrating strong operational efficiency. The company maintains a favorable weighted average cost of capital (WACC) at 7.35%, indicating low capital costs. However, profitability metrics such as net margin (0.22%) and return on equity (0.08%) remain weak. Notably, the return on invested capital (ROIC) at -0.17% falls below WACC, signaling the company is currently destroying value rather than creating it. This disconnect highlights operational challenges despite solid revenue growth.
Weaknesses and Drawbacks
The Altman Z-Score of 5.70 firmly places CoStar in the safe zone, yet significant valuation concerns persist. The price-to-earnings ratio is extremely elevated at 4,003.66, reflecting a highly speculative premium that may not be justified by fundamentals. Price-to-book at 3.36 is also unfavorable, suggesting overvaluation. While leverage remains low with a debt-to-equity ratio of 0.12, weak profitability and negative ROIC undermine financial robustness. Recent market pressure intensifies as sellers dominate 64.47% of trading volume, signaling short-term headwinds.
Our Final Verdict about CoStar Group, Inc.
Despite a safe solvency profile, CoStar Group’s deteriorating profitability and extreme valuation cast doubt on its near-term appeal. The bearish stock trend and seller dominance suggest caution. While long-term revenue growth remains favorable, the current operational inefficiencies and market pressures might warrant a wait-and-see stance. This profile may appear attractive only to investors with a high risk tolerance and a long-term horizon.
Disclaimer: This content is for informational purposes only and does not constitute financial, investment, or other professional advice. Investing in financial markets involves a significant risk of loss, and past performance is not indicative of future results.
Additional Resources
- Investor demand drives London office yields down to 5.9% in 2025 – Stock Titan (Feb 26, 2026)
- CoStar Group, Inc. (CSGP) Lauches Homes AI – Yahoo Finance (Feb 22, 2026)
- CoStar Group (CSGP): Analyst Rating Update by Citizens | CSGP St – GuruFocus (Feb 25, 2026)
- CoStar Q4 Earnings Beat Estimates, Revenues Up Y/Y, Shares Fall – TradingView (Feb 25, 2026)
- CoStar Group (NASDAQ:CSGP) Reaches New 1-Year Low Following Analyst Downgrade – MarketBeat (Feb 25, 2026)
For more information about CoStar Group, Inc., please visit the official website: costargroup.com