Home > Analyses > Basic Materials > Corteva, Inc.
Corteva, Inc. transforms global agriculture by delivering cutting-edge seeds and crop protection solutions that boost farm yields and sustainability. Its leadership in advanced germplasm and integrated digital tools empowers farmers to tackle pests, diseases, and climate challenges efficiently. Renowned for innovation and quality, Corteva shapes how food is grown worldwide. As market dynamics evolve, I question whether its fundamental strengths continue to justify its current valuation and growth expectations.

Table of contents
Business Model & Company Overview
Corteva, Inc., founded in 2018 and headquartered in Indianapolis, Indiana, commands a dominant position in the Agricultural Inputs sector. Its integrated ecosystem centers on advancing farm productivity through two core segments: Seed and Crop Protection. These segments deliver cutting-edge germplasm, trait technologies, and crop health solutions that together enhance yield, resistance, and sustainability for global agriculture.
The company’s revenue engine balances product sales and digital solutions across key markets including the Americas, Europe, and Asia Pacific. Corteva’s Seed segment drives innovation in traits and decision-support tools, while Crop Protection delivers herbicides, insecticides, and nitrogen stabilizers. This diversified mix underpins a durable economic moat, positioning Corteva as a pivotal force shaping agriculture’s future.
Financial Performance & Fundamental Metrics
I analyze Corteva, Inc.’s income statement, key financial ratios, and dividend payout policy to assess its operational efficiency and shareholder returns.
Income Statement
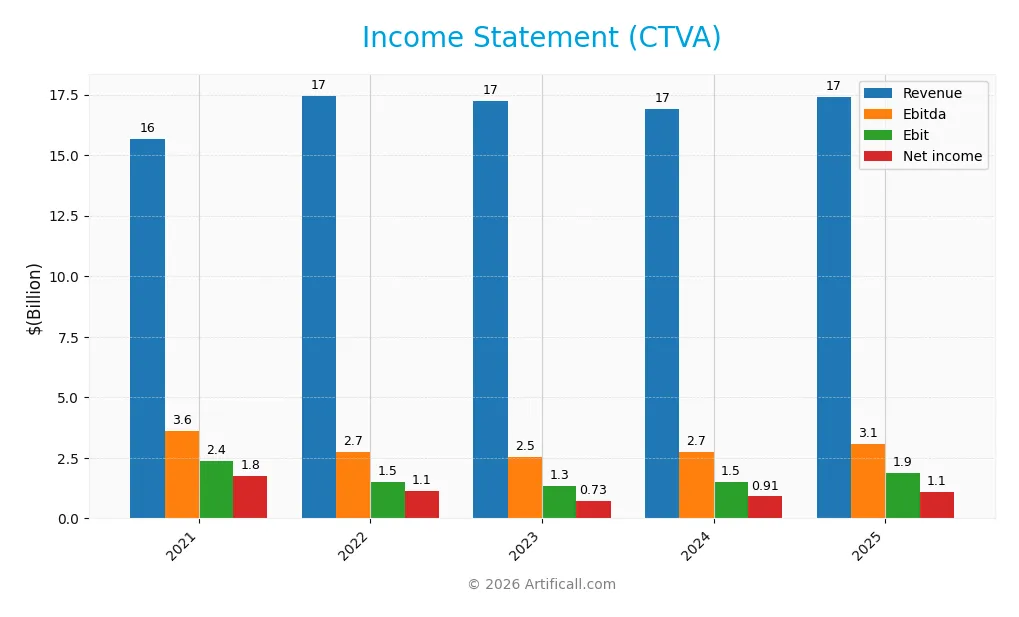
Below is Corteva, Inc.’s income statement summary for fiscal years 2021 through 2025, providing key financial metrics in USD.
| 2021 | 2022 | 2023 | 2024 | 2025 | |
|---|---|---|---|---|---|
| Revenue | 15.7B | 17.5B | 17.2B | 16.9B | 17.4B |
| Cost of Revenue | 9.2B | 10.4B | 9.9B | 9.5B | 9.8B |
| Operating Expenses | 5.1B | 5.1B | 5.2B | 5.3B | 5.0B |
| Gross Profit | 6.4B | 7.0B | 7.3B | 7.4B | 7.6B |
| EBITDA | 3.6B | 2.7B | 2.5B | 2.7B | 3.1B |
| EBIT | 2.4B | 1.5B | 1.3B | 1.5B | 1.9B |
| Interest Expense | 30M | 79M | 233M | 233M | 180M |
| Net Income | 1.8B | 1.1B | 0.7B | 0.9B | 1.1B |
| EPS | 2.39 | 1.59 | 1.04 | 1.31 | 1.61 |
| Filing Date | 2022-02-10 | 2023-02-09 | 2024-02-08 | 2025-02-14 | 2026-02-12 |
Income Statement Evolution
From 2021 to 2025, Corteva’s revenue increased modestly by 11.15%, reflecting steady top-line growth. However, net income declined by 37.8%, signaling pressure on profitability. Gross margin remained stable near 43.6%, while net margin contracted by 44%, indicating rising costs or margin compression despite revenue gains.
Is the Income Statement Favorable?
In 2025, fundamentals showed improvement: net margin rose to 6.29%, EBIT margin reached 10.74%, and EPS grew 23.1% year-over-year. Interest expense stayed low at 1.03% of revenue, supporting operating efficiency. Overall, the income statement appears favorable, with solid margin gains and controlled expenses enhancing profitability.
Financial Ratios
The table below presents Corteva, Inc.’s key financial ratios from 2021 to 2025, reflecting profitability, liquidity, leverage, efficiency, and dividend metrics:
| Ratios | 2021 | 2022 | 2023 | 2024 | 2025 |
|---|---|---|---|---|---|
| Net Margin | 11.24% | 6.57% | 4.27% | 5.36% | 6.29% |
| ROE | 6.93% | 4.53% | 2.94% | 3.81% | 4.53% |
| ROIC | 3.12% | 5.15% | 5.54% | 4.55% | 5.91% |
| P/E | 19.78 | 36.94 | 46.22 | 43.56 | 41.25 |
| P/B | 1.37 | 1.67 | 1.36 | 1.66 | 1.87 |
| Current Ratio | 1.63 | 1.56 | 1.56 | 1.45 | 1.43 |
| Quick Ratio | 1.08 | 0.93 | 0.90 | 0.93 | 0.96 |
| D/E | 0.04 | 0.05 | 0.10 | 0.11 | 0.11 |
| Debt-to-Assets | 2.65% | 3.07% | 5.79% | 6.62% | 6.02% |
| Interest Coverage | 43.9 | 24.41 | 9.06 | 9.00 | 14.55 |
| Asset Turnover | 0.37 | 0.41 | 0.40 | 0.41 | 0.41 |
| Fixed Asset Turnover | 3.62 | 4.10 | 4.02 | 4.12 | 4.12 |
| Dividend Yield | 1.14% | 0.99% | 1.29% | 1.16% | 1.05% |
Evolution of Financial Ratios
Return on Equity (ROE) declined from 6.93% in 2021 to 4.53% in 2025, indicating reduced shareholder profitability. The Current Ratio slightly decreased from 1.63 to 1.43, showing a mild dip in liquidity but remaining above 1. Debt-to-Equity Ratio rose from 0.04 to 0.11, reflecting cautious leverage increase. Profitability margins showed moderate stability over the period.
Are the Financial Ratios Favorable?
In 2025, profitability ratios show mixed signals: a neutral net margin of 6.29% contrasts with an unfavorable ROE of 4.53%. Liquidity ratios remain neutral, with a Current Ratio at 1.43 and Quick Ratio near 0.96. Leverage is favorable, as Debt-to-Equity stands low at 0.11 and Interest Coverage is strong at 10.38. Asset turnover is unfavorable at 0.41, but fixed asset turnover of 4.12 is favorable. Overall, ratios are slightly favorable.
Shareholder Return Policy
Corteva, Inc. maintains a dividend payout ratio around 43-60%, with a steady rise in dividend per share, reaching $0.71 in 2025. The annual dividend yield hovers near 1%, supported by robust free cash flow coverage and moderate share buybacks.
This distribution strategy aligns with Corteva’s consistent profitability and operating cash flow generation. The balance between dividends and buybacks appears sustainable, minimizing risks of over-distribution while supporting long-term shareholder value creation.
Score analysis
Here is a radar chart summarizing Corteva, Inc.’s key financial scores for a comprehensive view:
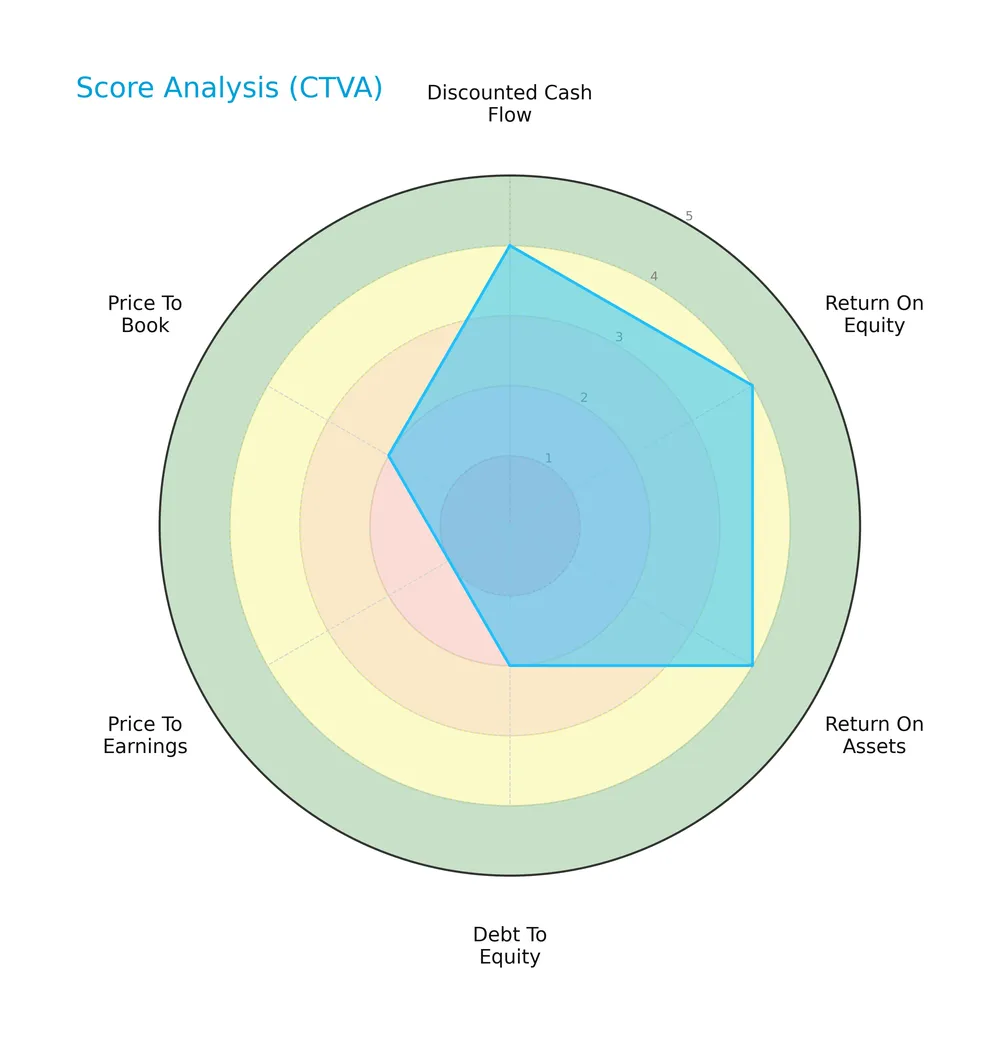
The company scores favorably on discounted cash flow, return on equity, and return on assets, each rated 4. Debt-to-equity and price-to-book ratios are unfavorable at 2, while the price-to-earnings score is very unfavorable at 1, indicating valuation concerns.
Analysis of the company’s bankruptcy risk
Corteva’s Altman Z-Score places it in the grey zone, signaling moderate bankruptcy risk but no immediate distress:

Is the company in good financial health?
The Piotroski Score diagram offers insight into Corteva’s financial strength and operational efficiency:
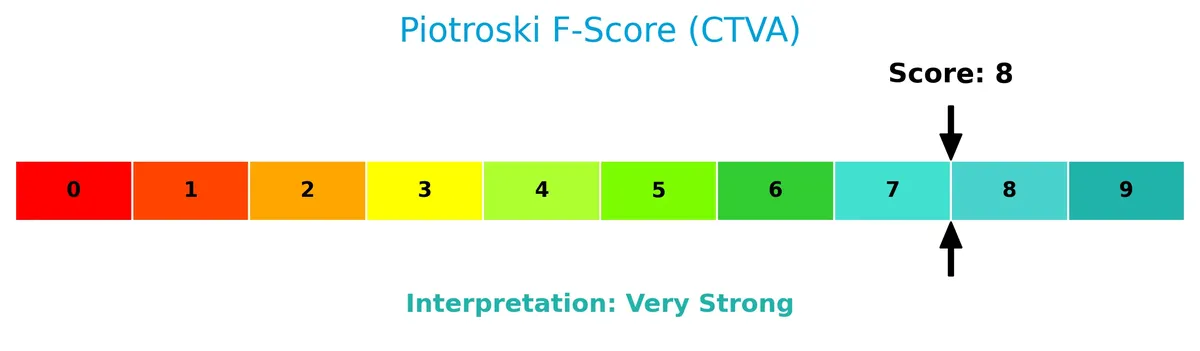
With a Piotroski Score of 8, Corteva demonstrates very strong financial health, reflecting robust profitability, liquidity, and leverage metrics.
Competitive Landscape & Sector Positioning
This sector analysis examines Corteva, Inc.’s strategic positioning, revenue segments, key products, competitors, and competitive advantages. I will assess whether Corteva holds a sustainable competitive advantage over its main rivals.
Strategic Positioning
Corteva, Inc. focuses on two core segments: Seed and Crop Protection, with Seed consistently generating higher revenue (~6.5B in 2024). Geographically, it maintains broad exposure across the U.S. (7.9B), Latin America (3.8B), EMEA (3.1B), Asia Pacific, and Canada, reflecting a diversified global footprint.
Revenue by Segment
This pie chart illustrates Corteva, Inc.’s revenue distribution between Crop Protection and Seed segments for fiscal year 2024.
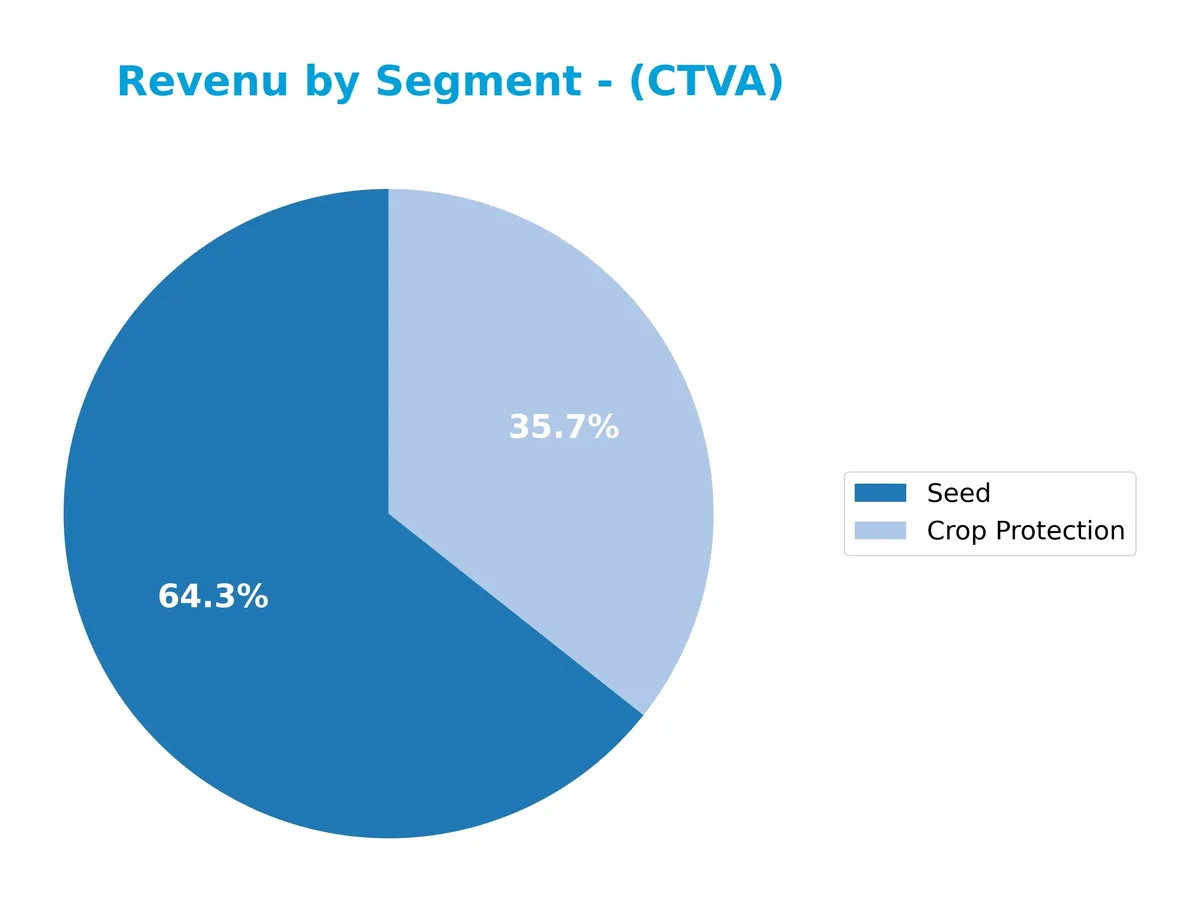
Corteva’s revenue shows a consistent dominance of the Seed segment, generating $6.5B in 2024, up from $5.1B in 2019. Crop Protection declined to $3.6B in 2024 from a 2022 peak of $4.6B. The Seed segment drives growth, reflecting robust demand and pricing power, while Crop Protection faces a slowdown, signaling potential concentration risk if Seed falters.
Key Products & Brands
The table below details Corteva’s main products and their core functions within agriculture:
| Product | Description |
|---|---|
| Seed | Develops advanced germplasm and traits to optimize farm yield, resist weather, disease, insects, and herbicides, plus digital tools to enhance farmer decisions. |
| Crop Protection | Provides herbicides, insecticides, nitrogen stabilizers, and pasture management products to protect crops and improve health above and below ground. |
Corteva’s product lineup centers on seeds and crop protection, driving growth through innovation in traits and crop health solutions. The Seed segment consistently generates higher revenue, reflecting strong demand for optimized agricultural inputs.
Main Competitors
There are 3 competitors in the Agricultural Inputs industry; the table shows the top 3 leaders by market capitalization:
| Competitor | Market Cap. |
|---|---|
| Corteva, Inc. | 45.8B |
| CF Industries Holdings, Inc. | 13.3B |
| The Mosaic Company | 7.9B |
Corteva ranks 1st among its three main competitors. Its market cap is 9.4% larger than the closest rival. The company stands well above both the average market cap of the top 10 (22.4B) and the sector median (13.3B). There is no competitor above Corteva, emphasizing its leading scale in this segment.
Comparisons with competitors
Check out how we compare the company to its competitors:
Does Corteva, Inc. have a competitive advantage?
Corteva shows a slightly unfavorable moat, as its ROIC remains below WACC, indicating value destruction despite improving profitability. Its gross margin of 43.6% and EBIT margin of 10.7% reflect operational efficiency but limited economic profit.
The company leverages advanced seed traits and crop protection technologies across global markets, including the U.S., Latin America, and EMEA. Digital farming solutions and nitrogen management present growth opportunities in evolving agricultural input sectors.
SWOT Analysis
This SWOT analysis distills Corteva’s strategic position to guide investors on its potential risks and rewards.
Strengths
- Leading seed and crop protection technology
- Diverse global footprint
- Strong EBIT and EPS growth
Weaknesses
- Value destruction indicated by ROIC below WACC
- Modest revenue growth recently
- High P/E ratio signals valuation risk
Opportunities
- Expansion in emerging markets
- Adoption of digital farming solutions
- Increasing demand for sustainable agriculture
Threats
- Commodity price volatility
- Regulatory pressures on agrochemicals
- Competitive market with innovation races
Corteva shows robust operational strengths and growth in profitability but struggles with value creation. Strategic focus must balance innovation and cost control while navigating regulatory and market risks.
Stock Price Action Analysis
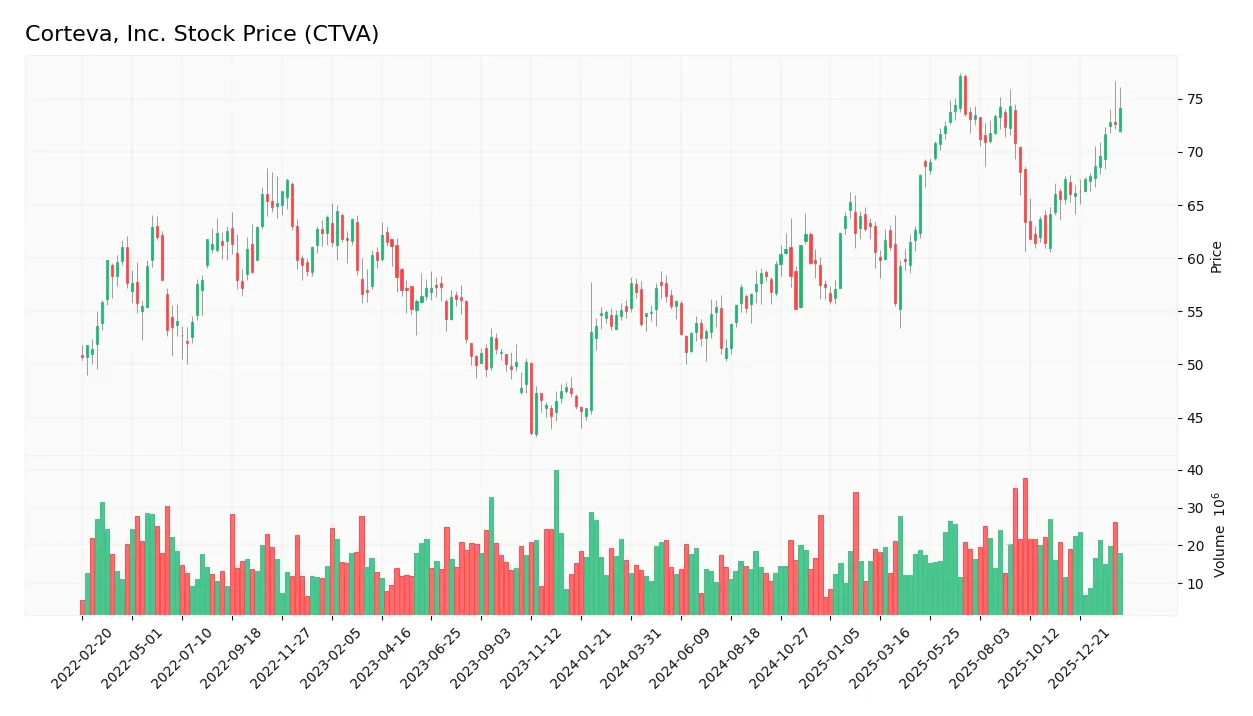
The weekly stock chart of Corteva, Inc. (CTVA) highlights a sustained uptrend with notable price acceleration since late 2025:
Trend Analysis
Over the past 12 months, CTVA’s stock price increased 34.57%, indicating a bullish trend with accelerating momentum. Volatility measured by a 6.88% standard deviation reflects moderate price fluctuations. The highest price reached 77.12, while the lowest was 51.18, confirming strong upward movement.
Volume Analysis
Trading volumes over the last three months show a strongly buyer-dominant pattern with 78.43% buyer volume. Volume is increasing, signaling rising investor interest and confidence. This elevated participation supports the bullish price trend observed.
Target Prices
Analysts set a confident target consensus for Corteva, Inc., reflecting steady growth expectations.
| Target Low | Target High | Consensus |
|---|---|---|
| 80 | 89 | 84.75 |
The target range suggests moderate upside potential, with analysts generally optimistic about Corteva’s near-term performance.

Don’t Let Luck Decide Your Entry Point
Optimize your entry points with our advanced ProRealTime indicators. You’ll get efficient buy signals with precise price targets for maximum performance. Start outperforming now!
Analyst & Consumer Opinions
This section reviews analyst grades and consumer feedback to provide a comprehensive view of Corteva, Inc.’s market perception.
Stock Grades
Here are the latest verified ratings for Corteva, Inc. from leading financial institutions as of early 2026:
| Grading Company | Action | New Grade | Date |
|---|---|---|---|
| Citigroup | Maintain | Neutral | 2026-02-05 |
| RBC Capital | Maintain | Outperform | 2026-02-05 |
| Wells Fargo | Maintain | Overweight | 2026-02-05 |
| JP Morgan | Downgrade | Neutral | 2026-02-05 |
| Oppenheimer | Maintain | Outperform | 2026-01-27 |
| Citigroup | Maintain | Neutral | 2026-01-21 |
| JP Morgan | Maintain | Overweight | 2026-01-21 |
| Mizuho | Maintain | Outperform | 2026-01-16 |
| Citigroup | Maintain | Neutral | 2025-12-18 |
| Wells Fargo | Maintain | Overweight | 2025-11-11 |
The overall trend shows a stable consensus with a tilt toward Outperform and Overweight grades, tempered by Citigroup and JP Morgan’s Neutral ratings. The recent downgrade by JP Morgan signals some caution amid otherwise consistent positive outlooks.
Consumer Opinions
Consumer sentiment around Corteva, Inc. (CTVA) reflects a mix of strong product satisfaction and concerns about pricing.
| Positive Reviews | Negative Reviews |
|---|---|
| “Reliable seed quality that boosts yields consistently.” | “Product prices have increased noticeably over the past year.” |
| “Excellent customer service with knowledgeable reps.” | “Limited availability in certain regional markets.” |
| “Innovative crop protection solutions that reduce losses.” | “Some formulations cause concerns about environmental impact.” |
Overall, consumers praise Corteva’s product effectiveness and support but express worry over rising costs and regional supply constraints. Environmental concerns also appear sporadically.
Risk Analysis
Below is a table summarizing key risks facing Corteva, Inc., with their likelihood and potential impact on the company:
| Category | Description | Probability | Impact |
|---|---|---|---|
| Market Valuation | High P/E ratio (41.25) signals overvaluation risk amid sector volatility | Medium | High |
| Profitability | Low ROE (4.53%) below cost of capital risks weak shareholder returns | Medium | Medium |
| Financial Health | Altman Z-Score in grey zone (2.32) indicates moderate bankruptcy risk | Low | High |
| Debt Management | Favorable debt levels but low debt-to-equity score suggests cautious leverage | Low | Low |
| Operational Efficiency | Unfavorable asset turnover (0.41) may limit growth and cash flow | Medium | Medium |
| Industry Cyclicality | Exposure to agricultural input price swings and weather impacts | High | High |
Corteva’s most pressing risks are valuation and industry cyclicality. Its P/E far exceeds the S&P 500 average near 20, increasing vulnerability to market corrections. Agricultural input prices remain volatile due to ongoing climate variability and geopolitical tensions disrupting supply chains. Although the company maintains solid liquidity and low debt, weak ROE and middling asset turnover highlight operational challenges. Investors must weigh these factors carefully in 2026’s evolving landscape.
Should You Buy Corteva, Inc.?
Corteva, Inc. appears to be improving profitability with growing ROIC, yet it continues to shed value relative to WACC, suggesting a slightly unfavorable moat. Despite manageable leverage concerns, its overall rating of B reflects a very favorable profile amid moderate financial risks.
Strength & Efficiency Pillars
Corteva, Inc. exhibits solid operational margins with a gross margin of 43.59% and an EBIT margin of 10.74%, signaling effective cost control. Its net margin stands at 6.29%, reflecting moderate profitability. However, the return on invested capital (5.91%) falls short of the weighted average cost of capital (7.04%), indicating the company is currently shedding value rather than creating it. While the ROIC trend shows growth, Corteva’s capital allocation does not yet generate excess returns for shareholders.
Weaknesses and Drawbacks
Corteva faces a moderate solvency risk with an Altman Z-Score of 2.32, placing it in the grey zone. This suggests some vulnerability to financial distress if adverse conditions persist. The valuation appears stretched with a high price-to-earnings ratio of 41.25, signaling premium pricing that may not be justified by earnings. Additionally, the company’s return on equity is weak at 4.53%, and asset turnover is low at 0.41, pointing to inefficiencies in asset utilization. These factors may constrain upside in the near term.
Our Final Verdict about Corteva, Inc.
Corteva’s profile suggests a cautious stance. Although operational margins and recent strong buyer dominance indicate underlying strength, its moderate solvency risk and premium valuation make the investment somewhat speculative. The bullish long-term trend might appeal to patient investors, but the grey-zone Z-Score and valuation concerns imply a wait-and-see approach could be prudent before committing capital.
Disclaimer: This content is for informational purposes only and does not constitute financial, investment, or other professional advice. Investing in financial markets involves a significant risk of loss, and past performance is not indicative of future results.
Additional Resources
- Corteva Stock Gained 20% Last Year. Here’s the Path to $100 per Share – TIKR.com (Feb 12, 2026)
- Corteva (NYSE:CTVA) Price Target Raised to $80.00 – MarketBeat (Feb 12, 2026)
- Corteva downgraded at UBS ahead of planned business split (CTVA:NYSE) – Seeking Alpha (Feb 09, 2026)
- Investors in Corteva (NYSE:CTVA) have seen notable returns of 73% over the past five years – Yahoo Finance (Feb 09, 2026)
- Corteva Declares Quarterly Dividend – PR Newswire (Jan 28, 2026)
For more information about Corteva, Inc., please visit the official website: corteva.com