Home > Analyses > Technology > Corpay, Inc.
Corpay, Inc. revolutionizes how businesses manage complex payment ecosystems tied to vehicle expenses, travel, and corporate disbursements. With a robust presence across the US, Brazil, and the UK, it leads the software infrastructure sector by integrating innovative payment solutions that streamline fuel, tolls, lodging, and virtual card services. As Corpay pushes boundaries in automation and cross-border payments, I ask: does its financial strength and market position still justify its premium valuation?

Table of contents
Business Model & Company Overview
Corpay, Inc., founded in 1986 and headquartered in Atlanta, Georgia, stands as a dominant player in software infrastructure for payments. The company’s core mission revolves around streamlining vehicle-related, lodging, and corporate payments through an integrated ecosystem. Formerly known as FLEETCOR Technologies, it has leveraged decades of experience to build a robust platform serving businesses and consumers globally.
Corpay generates revenue via a balanced mix of corporate payment solutions, including accounts payable automation, virtual cards, and cross-border services, alongside vehicle and lodging expense management. Its footprint spans the Americas, Europe, and Asia, targeting merchants, businesses, and payment networks. This competitive advantage rests on its ability to embed deeply into complex payment workflows, securing a durable economic moat that shapes the future of global transaction infrastructure.
Financial Performance & Fundamental Metrics
I analyze Corpay, Inc.’s income statement, key financial ratios, and dividend payout policy to assess its profitability, efficiency, and shareholder returns.
Income Statement
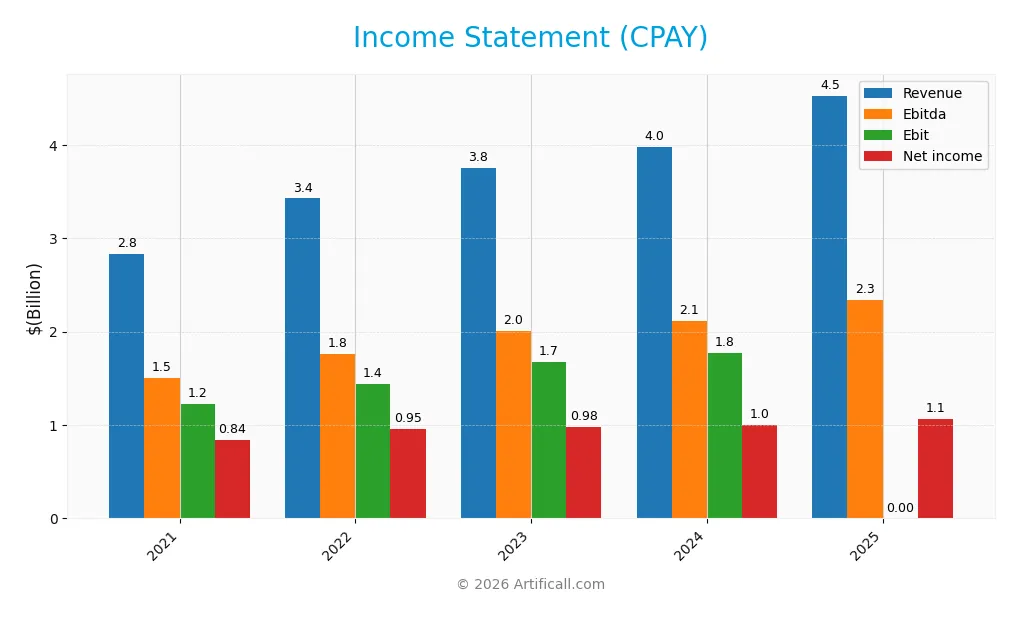
Below is Corpay, Inc.’s Income Statement summary for fiscal years 2021 through 2025, showing key performance metrics in USD.
| 2021 | 2022 | 2023 | 2024 | 2025 | |
|---|---|---|---|---|---|
| Revenue | 2.83B | 3.43B | 3.76B | 3.97B | 4.53B |
| Cost of Revenue | 560M | 765M | 820M | 869M | 1.36B |
| Operating Expenses | 1.03B | 1.22B | 1.28B | 1.32B | 1.21B |
| Gross Profit | 2.27B | 2.66B | 2.94B | 3.11B | 3.17B |
| EBITDA | 1.51B | 1.76B | 2.01B | 2.12B | 2.34B |
| EBIT | 1.22B | 1.44B | 1.67B | 1.77B | 1.95B |
| Interest Expense | 114M | 165M | 349M | 383M | 404M |
| Net Income | 839M | 954M | 982M | 1.00B | 1.07B |
| EPS | 10.23 | 12.62 | 13.42 | 14.27 | 15.25 |
| Filing Date | 2021-12-31 | 2022-12-31 | 2023-12-31 | 2025-02-27 | 2026-02-27 |
Income Statement Evolution
Corpay, Inc. posted a 13.9% revenue increase in 2025, continuing strong growth from 2021’s 59.8% rise. Gross profit growth slowed to 2%, indicating stable margins near 70%. EBIT grew 10%, reflecting efficient cost management. However, net margin contracted by 6.5% in 2025 and declined 20.3% over five years, signaling margin pressure despite overall income gains.
Is the Income Statement Favorable?
The 2025 income statement shows robust fundamentals with a 23.6% net margin and 43% EBIT margin, both favorable versus industry norms. Interest expense remains neutral at 8.9% of revenue, manageable given earnings. EPS rose 7.6% in 2025, supporting shareholder value. Despite a slight net margin dip, the overall income statement quality rates favorable, reflecting solid operational control and growth.
Financial Ratios
The table below summarizes key financial ratios for Corpay, Inc. (CPAY) over the last five fiscal years, providing insight into profitability, valuation, liquidity, leverage, and operational efficiency:
| Ratios | 2021 | 2022 | 2023 | 2024 | 2025 |
|---|---|---|---|---|---|
| Net Margin | 29.6% | 27.8% | 26.1% | 25.3% | 23.6% |
| ROE | 29.3% | 37.5% | 29.9% | 32.1% | 27.5% |
| ROIC | 9.8% | 10.4% | 11.4% | 10.8% | 8.8% |
| P/E | 21.9 | 14.6 | 21.0 | 23.7 | 19.7 |
| P/B | 6.4 | 5.5 | 6.3 | 7.6 | 5.4 |
| Current Ratio | 1.04 | 1.01 | 1.04 | 1.00 | 0.98 |
| Quick Ratio | 1.04 | 1.01 | 1.04 | 1.00 | 0.98 |
| D/E | 2.09 | 2.77 | 2.05 | 2.56 | 2.58 |
| Debt-to-Assets | 44.6% | 49.9% | 43.4% | 44.5% | 37.9% |
| Interest Coverage | 10.9 | 8.8 | 4.8 | 4.7 | 4.8 |
| Asset Turnover | 0.21 | 0.24 | 0.24 | 0.22 | 0.17 |
| Fixed Asset Turnover | 12.0 | 11.6 | 11.0 | 10.5 | 9.6 |
| Dividend Yield | 0% | 0% | 0% | 0% | 0% |
Evolution of Financial Ratios
Corpay’s Return on Equity (ROE) declined from 37.5% in 2022 to 27.5% in 2025, signaling slowing profitability. The Current Ratio fell below 1.0, indicating weakened short-term liquidity. Meanwhile, the Debt-to-Equity Ratio remained elevated near 2.5, reflecting consistent high leverage across the period.
Are the Financial Ratios Fovorable?
In 2025, Corpay shows favorable profitability with a 23.6% net margin and 27.5% ROE, exceeding typical market benchmarks. Liquidity ratios are mixed; the Current Ratio is unfavorable at 0.98, while the Quick Ratio is neutral. High leverage persists with a 2.58 Debt-to-Equity ratio marked unfavorable. Efficiency metrics like asset turnover are weak. Overall, the ratio profile is slightly unfavorable.
Shareholder Return Policy
Corpay, Inc. (CPAY) does not pay dividends, reflecting a strategy focused on reinvestment rather than direct shareholder payouts. Despite zero dividend yield and payout ratio, the company maintains free cash flow coverage, indicating operational efficiency.
The absence of dividends aligns with a growth or capital allocation approach prioritizing long-term value. CPAY engages in share buybacks, supporting shareholder returns without compromising liquidity. This policy appears consistent with sustainable value creation in the current financial environment.
Score analysis
The radar chart below illustrates Corpay, Inc.’s key financial scores for a comprehensive overview:
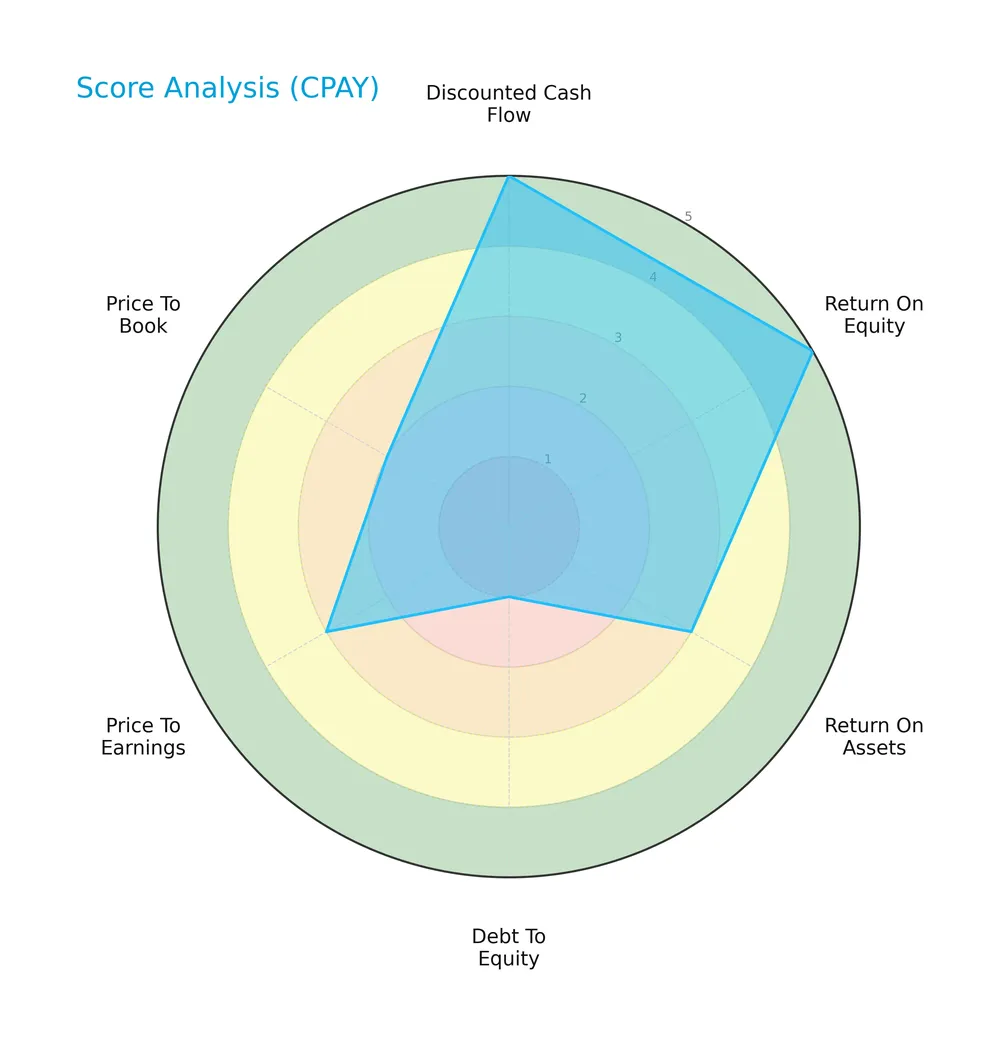
Corpay’s discounted cash flow and return on equity scores are favorable to very favorable, signaling solid profitability. However, the very unfavorable debt-to-equity score raises concerns about leverage. Price multiples show moderate to unfavorable valuations.
Analysis of the company’s bankruptcy risk
Corpay’s Altman Z-Score places it in the distress zone, indicating a higher risk of financial distress and potential bankruptcy:

Is the company in good financial health?
The Piotroski Score diagram provides insight into Corpay’s financial strength based on nine key criteria:

With a Piotroski Score of 5, Corpay is in average financial health. This middle range suggests moderate operational efficiency and profitability, without strong signals of financial robustness or distress.
Competitive Landscape & Sector Positioning
This section analyzes Corpay, Inc.’s strategic positioning, revenue segments, key products, and main competitors within the software infrastructure sector. I will assess whether Corpay holds a competitive advantage over its industry peers based on these factors.
Strategic Positioning
Corpay, Inc. maintains a diversified product portfolio across corporate payments, lodging, and general payments, with a significant revenue base in the U.S., Brazil, and the U.K. This geographic spread supports resilience and growth opportunities in multiple key markets.
Revenue by Segment
This pie chart illustrates Corpay, Inc.’s revenue breakdown by segment for fiscal year 2025, highlighting how each business unit contributes to total sales.
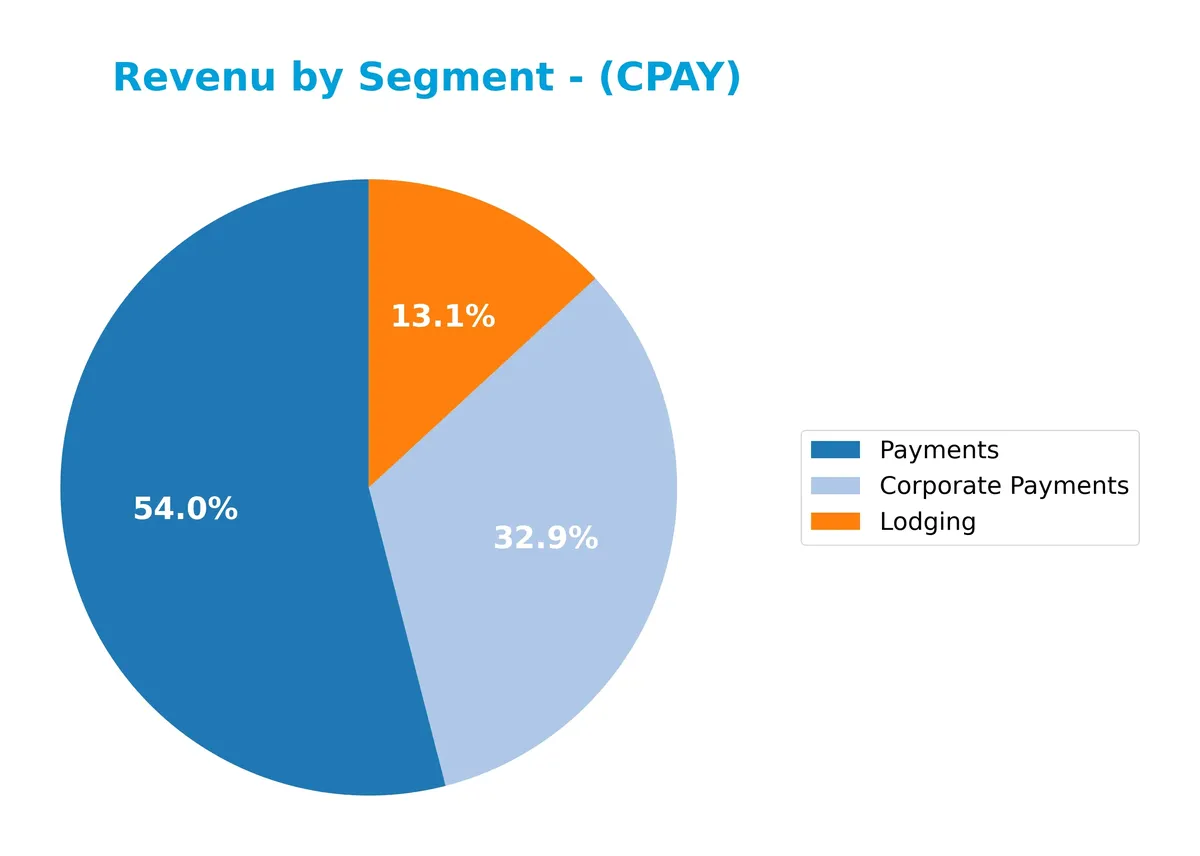
In 2025, Payments leads with $2.1B, followed by Corporate Payments at $1.6B, showing robust growth from $2.0B and $1.2B in 2024. Lodging remains steady near $470M. The acceleration in Corporate Payments signals strategic focus, while Payments maintains scale dominance, indicating a balanced yet evolving revenue base.
Key Products & Brands
Corpay, Inc.’s main products and brands focus on corporate payments, lodging, and vehicle-related payment solutions:
| Product | Description |
|---|---|
| Corporate Payments | Solutions for accounts payable automation, virtual cards, cross-border payments, and purchasing cards. |
| Lodging | Payment solutions for employee travel, airline/cruise crew accommodations, and insurance-related lodging. |
| Payments | Vehicle-related expense management including fuel, tolls, parking, fleet maintenance, and transportation. |
Corpay generates significant revenue from these three segments, reflecting a diversified payment infrastructure targeting businesses and consumers globally. Corporate Payments form the largest share, indicating strong specialization in business solutions.
Main Competitors
In the Technology sector’s Software – Infrastructure industry, 32 competitors exist, with the table listing the top 10 leaders by market capitalization:
| Competitor | Market Cap. |
|---|---|
| Microsoft Corporation | 3.52T |
| Oracle Corporation | 553B |
| Palantir Technologies Inc. | 383B |
| Adobe Inc. | 140B |
| Palo Alto Networks, Inc. | 120B |
| CrowdStrike Holdings, Inc. | 113B |
| Synopsys, Inc. | 92B |
| Cloudflare, Inc. | 69B |
| Fortinet, Inc. | 59B |
| Block, Inc. | 40B |
Corpay, Inc. ranks 16th among 32 competitors, with a market cap just 0.65% of Microsoft’s, the sector leader. It sits below the average market cap of the top 10 (508B) but above the sector median (19B). The company is closely trailing its nearest rival by approximately 2%, indicating a tightly contested position in the mid-tier segment.
Comparisons with competitors
Check out how we compare the company to its competitors:
Does CPAY have a competitive advantage?
Corpay, Inc. shows a slight competitive advantage by generating returns on invested capital (ROIC) above its cost of capital (WACC) by 2.77%. This indicates the company creates value, though its ROIC trend shows a decline, signaling weakening profitability over time.
Looking ahead, Corpay benefits from geographic diversification across the US, UK, and Brazil, and its broad payment solutions portfolio supports growth opportunities. Expansion into corporate and travel payment segments offers potential to capture new markets and enhance revenue streams.
SWOT Analysis
This SWOT analysis highlights Corpay, Inc.’s key internal capabilities and external market conditions to guide strategic decisions.
Strengths
- strong gross margin at 69.9%
- favorable EBIT margin near 43%
- solid ROE at 27.55%
Weaknesses
- low current ratio at 0.98 signals liquidity risk
- high debt-to-equity ratio at 2.58
- declining ROIC trend
Opportunities
- expanding international revenue, especially in Brazil and UK
- increasing revenue growth of 13.9% year-over-year
- growing demand for automated corporate payment solutions
Threats
- competitive pressure in software infrastructure sector
- exposure to economic cycles impacting corporate travel
- Altman Z-score in distress zone signals financial vulnerability
Corpay’s strengths in profitability and international expansion position it well for growth. However, liquidity concerns and rising leverage require cautious capital management to mitigate financial risks and sustain its competitive moat.
Stock Price Action Analysis
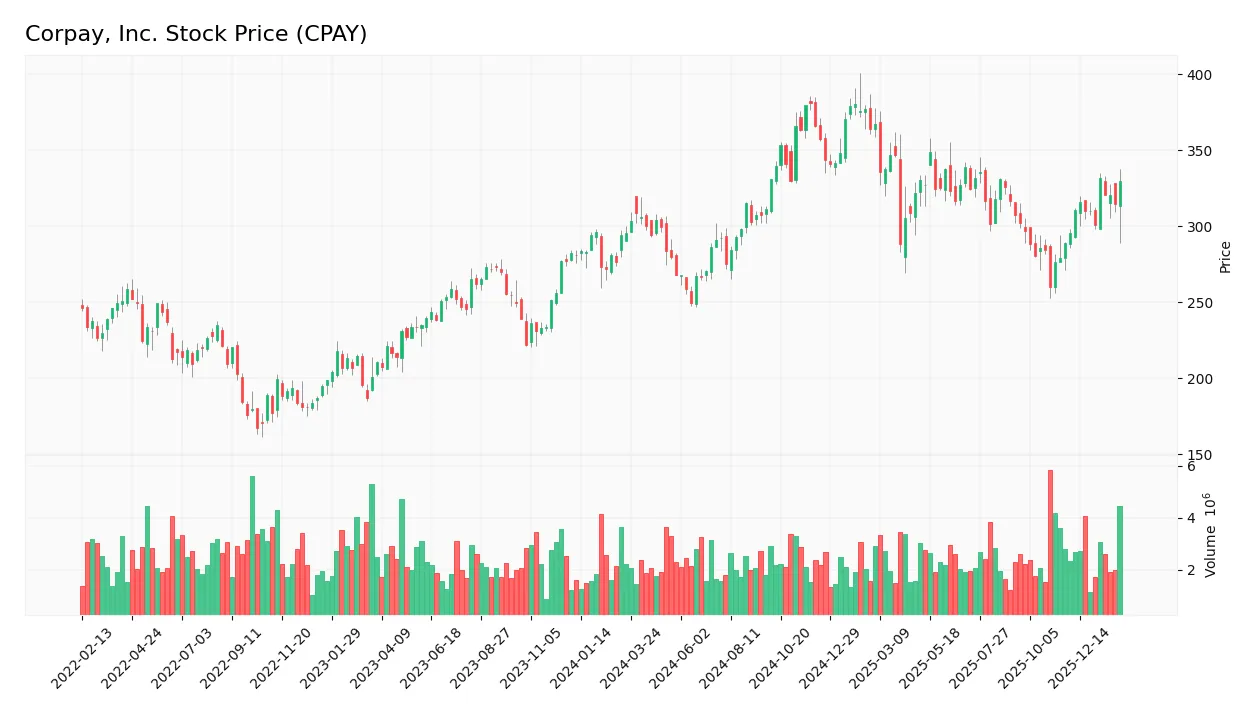
The weekly stock chart below illustrates Corpay, Inc.’s price movements and volatility over the past 12 months:
Trend Analysis
Over the past 12 months, CPAY’s price increased by 6.17%, indicating a bullish trend with acceleration. The stock traded between 249.66 and 381.18, showing high volatility with a standard deviation of 31.39. Recent three-month data confirms continued upward momentum with a 2.85% gain and a positive slope of 3.12.
Volume Analysis
Trading volume for CPAY has increased overall, with buyers accounting for 51.43% of activity across the year. However, in the last three months, seller volume exceeded buyers at 56.23%, suggesting slight seller dominance and cautious investor sentiment despite rising prices. This shift signals mixed market participation recently.
Target Prices
Analysts set a strong target consensus for Corpay, Inc., signaling robust growth expectations.
| Target Low | Target High | Consensus |
|---|---|---|
| 300 | 390 | 362.29 |
The target range reflects confidence in Corpay’s strategic positioning, with consensus pointing to a significant upside from current levels.

Don’t Let Luck Decide Your Entry Point
Optimize your entry points with our advanced ProRealTime indicators. You’ll get efficient buy signals with precise price targets for maximum performance. Start outperforming now!
Analyst & Consumer Opinions
This section reviews expert grades and consumer feedback to provide a balanced view of Corpay, Inc.’s performance.
Stock Grades
The following table summarizes recent analyst grades for Corpay, Inc., reflecting a steady consensus on the stock’s outlook:
| Grading Company | Action | New Grade | Date |
|---|---|---|---|
| UBS | Maintain | Neutral | 2026-02-10 |
| Cantor Fitzgerald | Maintain | Overweight | 2026-02-09 |
| Mizuho | Maintain | Neutral | 2026-02-06 |
| RBC Capital | Maintain | Sector Perform | 2026-02-05 |
| Morgan Stanley | Maintain | Overweight | 2026-02-05 |
| JP Morgan | Maintain | Overweight | 2026-02-05 |
| Morgan Stanley | Upgrade | Overweight | 2026-01-26 |
| Oppenheimer | Maintain | Outperform | 2026-01-12 |
| Oppenheimer | Upgrade | Outperform | 2025-12-05 |
| JP Morgan | Maintain | Overweight | 2025-11-06 |
Analyst grades for Corpay show a consistent bias toward positive ratings, with multiple upgrades to Overweight and Outperform in recent months. Neutral and Sector Perform grades remain, indicating some caution amid overall optimism.
Consumer Opinions
Corpay, Inc. elicits mixed but insightful feedback from its user base, reflecting both solid service features and areas needing improvement.
| Positive Reviews | Negative Reviews |
|---|---|
| “Seamless payment processing saves time.” | “Customer support response is slow.” |
| “User-friendly interface enhances productivity.” | “Occasional billing discrepancies create confusion.” |
| “Reliable transaction security reassures me.” | “Mobile app lacks some crucial functionalities.” |
Overall, consumers praise Corpay’s efficiency and security. However, recurring complaints focus on customer service delays and mobile app limitations, signaling key improvement areas.
Risk Analysis
Below is a summary table outlining key risks Corpay, Inc. faces, with their likelihood and potential impact:
| Category | Description | Probability | Impact |
|---|---|---|---|
| Financial Health | Altman Z-Score in distress zone signals elevated bankruptcy risk. | High | High |
| Liquidity | Current ratio below 1 indicates possible short-term liquidity issues. | Medium | Medium |
| Leverage | Debt-to-equity ratio of 2.58 suggests aggressive use of debt financing. | High | High |
| Valuation | Price-to-book ratio of 5.43 points to potential overvaluation risk. | Medium | Medium |
| Profitability | Strong net margin and ROE support operational resilience. | Low | Low |
| Market Volatility | Beta below 1 signals lower volatility but market swings could still affect. | Medium | Medium |
Corpay’s most pressing risks stem from its financial leverage and weak liquidity profile. The Altman Z-Score in the distress zone warns of heightened bankruptcy risk, a red flag compared to sector norms. Investors should monitor debt levels closely amid economic uncertainty.
Should You Buy Corpay, Inc.?
Corpay appears to be creating value with a slightly favorable moat despite declining profitability. Its leverage profile is substantial, reflected in a distressed Altman Z-Score. Overall, the company suggests a moderate but cautious B+ rating.
Strength & Efficiency Pillars
Corpay, Inc. posts strong operational efficiency with a net margin of 23.62% and a return on equity of 27.55%. The company is a clear value creator, as its ROIC of 8.78% exceeds the WACC of 6.01%. This spread indicates effective capital allocation and sustainable value generation. High gross and EBIT margins, at 69.91% and 42.96% respectively, further affirm operational strength despite a slight decline in ROIC trend.
Weaknesses and Drawbacks
Corpay is in the financial distress zone, reflected by an Altman Z-Score of 1.58, signaling a potential bankruptcy risk. This solvency concern outweighs its profitability metrics. Additional red flags include a high debt-to-equity ratio of 2.58 and an unfavorable current ratio of 0.98, indicating liquidity pressure. The elevated price-to-book ratio of 5.43 also suggests the stock trades at a premium, potentially limiting upside.
Our Final Verdict about Corpay, Inc.
Despite operational efficiency and value creation, Corpay’s Altman Z-Score in the distress zone makes its financial profile highly speculative. The significant solvency risks overshadow profitability strengths, rendering the stock too risky for conservative capital. Investors might approach with caution until financial health stabilizes and leverage concerns are addressed.
Disclaimer: This content is for informational purposes only and does not constitute financial, investment, or other professional advice. Investing in financial markets involves a significant risk of loss, and past performance is not indicative of future results.
Additional Resources
- Decoding Corpay Inc (CPAY): A Strategic SWOT Insight – GuruFocus (Feb 28, 2026)
- Is Corpay, Inc. (CPAY) One of the Cheap Technology Stocks to Invest In According to Hedge Funds? – Finviz (Feb 25, 2026)
- Fox Run Management L.L.C. Takes Position in Corpay, Inc. $CPAY – MarketBeat (Feb 25, 2026)
- CORPAY, INC. SEC 10-K Report – TradingView (Feb 27, 2026)
- Corpay (CPAY) director granted 886 restricted shares for 2026 service – Stock Titan (Feb 27, 2026)
For more information about Corpay, Inc., please visit the official website: corpay.com