Home > Analyses > Technology > Corning Incorporated
Corning Incorporated shapes the screens and networks that connect billions daily. Its pioneering glass substrates power vibrant displays in TVs, laptops, and smartphones worldwide. As a stalwart in optical communications and specialty materials, Corning blends innovation with precision to fuel industries from life sciences to environmental tech. With a rich legacy and cutting-edge portfolio, I’m keen to explore if Corning’s fundamentals still support its lofty valuation and future growth prospects.
Table of contents
Business Model & Company Overview
Corning Incorporated, founded in 1851 and headquartered in Corning, NY, commands a dominant position in the Hardware, Equipment & Parts industry. Its business integrates advanced glass and optical technologies into a unified ecosystem serving display, communications, environmental, specialty materials, and life sciences markets. This broad yet interconnected portfolio fuels innovation across multiple high-growth sectors.
The company’s revenue engine balances hardware sales—like optical fibers and glass substrates—with recurring income from specialty materials and lab consumables. Corning leverages its strategic global footprint across the Americas, Europe, and Asia to supply diverse industries, from consumer electronics to aerospace. Its competitive advantage lies in its technological depth and scale, which create a formidable moat shaping the future of multiple industries.
Financial Performance & Fundamental Metrics
I analyze Corning Incorporated’s income statement, key financial ratios, and dividend payout policy to assess its profitability, efficiency, and shareholder returns.
Income Statement
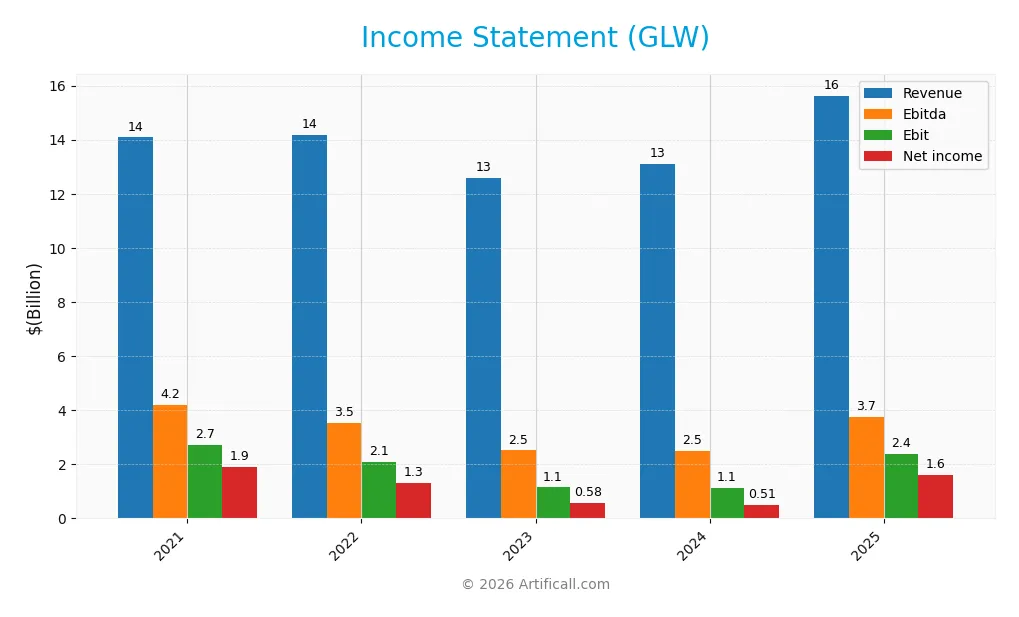
This table summarizes Corning Incorporated’s key income statement figures for the fiscal years 2021 through 2025 in USD.
| 2021 | 2022 | 2023 | 2024 | 2025 | |
|---|---|---|---|---|---|
| Revenue | 14.1B | 14.2B | 12.6B | 13.1B | 15.6B |
| Cost of Revenue | 9.0B | 9.7B | 8.7B | 8.8B | 10.1B |
| Operating Expenses | 3.0B | 3.1B | 3.0B | 3.1B | 3.2B |
| Gross Profit | 5.1B | 4.5B | 3.9B | 4.3B | 5.5B |
| EBITDA | 4.2B | 3.5B | 2.5B | 2.5B | 3.7B |
| EBIT | 2.7B | 2.1B | 1.1B | 1.1B | 2.4B |
| Interest Expense | 300M | 292M | 329M | 329M | 336M |
| Net Income | 1.9B | 1.3B | 581M | 506M | 1.6B |
| EPS | 1.30 | 1.56 | 0.69 | 0.59 | 1.86 |
| Filing Date | 2022-02-14 | 2023-02-13 | 2024-02-12 | 2025-02-13 | 2026-02-12 |
Income Statement Evolution
Corning’s revenue grew steadily from 14.1B in 2021 to 15.6B in 2025, reflecting a 10.99% overall increase. Gross profit and EBIT expanded robustly, especially in 2025, with gross margin stabilizing above 35%. However, net income declined by 16.3% over the period, indicating pressure on bottom-line margins despite improved operational efficiency.
Is the Income Statement Favorable?
In 2025, Corning’s fundamentals appear favorable. Revenue surged 19.1% year-over-year, with gross profit rising nearly 29%. EBIT more than doubled, lifting EBIT margin to 15.3%. Net margin improved to 10.2%, supported by controlled interest expenses at 2.15% of revenue. Earnings per share soared 219%, signaling strong profitability growth despite prior net income volatility.
Financial Ratios
The following table presents key financial ratios for Corning Incorporated (GLW) over the fiscal years 2021 to 2025, offering insight into profitability, valuation, liquidity, leverage, and operational efficiency:
| Ratios | 2021 | 2022 | 2023 | 2024 | 2025 |
|---|---|---|---|---|---|
| Net Margin | 13.5% | 9.3% | 4.6% | 3.9% | 10.2% |
| ROE | 15.5% | 11.0% | 5.0% | 4.7% | 13.5% |
| ROIC | 6.6% | 4.5% | 2.9% | 3.6% | 7.6% |
| P/E | 16.2 | 20.5 | 44.4 | 80.1 | 47.2 |
| P/B | 2.5 | 2.2 | 2.2 | 3.8 | 6.4 |
| Current Ratio | 1.59 | 1.44 | 1.67 | 1.62 | 1.59 |
| Quick Ratio | 1.08 | 0.88 | 1.05 | 1.07 | 1.04 |
| D/E | 0.63 | 0.65 | 0.73 | 0.76 | 0.71 |
| Debt-to-Assets | 26.0% | 26.5% | 29.8% | 29.2% | 27.2% |
| Interest Coverage | 7.0 | 4.9 | 2.7 | 3.4 | 6.9 |
| Asset Turnover | 0.47 | 0.48 | 0.44 | 0.47 | 0.50 |
| Fixed Asset Turnover | 0.85 | 0.88 | 0.81 | 0.93 | 1.05 |
| Dividend Yield | 2.8% | 3.5% | 3.8% | 2.4% | 1.3% |
Evolution of Financial Ratios
Over the period, Corning’s Return on Equity (ROE) displayed volatility, peaking above 15% in 2021 before stabilizing around 13.5% in 2025. The Current Ratio remained fairly stable near 1.6, indicating consistent liquidity. The Debt-to-Equity Ratio fluctuated moderately around 0.7, reflecting stable leverage and controlled debt levels. Profitability margins showed improvement in 2025, with net margin rising to 10.2%.
Are the Financial Ratios Favorable?
In 2025, Corning’s profitability, marked by a 10.2% net margin, appears favorable, supported by a neutral ROE of 13.5% against a WACC of 8.5%. Liquidity ratios, including a current ratio of 1.59 and quick ratio of 1.04, are favorable, suggesting solid short-term financial health. Leverage metrics are neutral, with a debt-to-equity ratio of 0.71 and a favorable debt-to-assets ratio of 27.2%. Valuation ratios like P/E at 47.2 and P/B at 6.38 are unfavorable, tempering the overall slightly favorable stance of the financial ratios.
Shareholder Return Policy
Corning Incorporated maintains a consistent dividend policy with a payout ratio of approximately 62.6% in 2025 and a 1.33% annual yield. Dividends are supported by free cash flow, and share buybacks supplement shareholder returns.
The dividend coverage by free cash flow and ongoing buybacks indicate a balanced capital allocation. This approach appears sustainable, aligning with long-term shareholder value creation without excessive risk.
Score analysis
The radar chart below compares Corning Incorporated’s key financial scores across valuation, profitability, and leverage metrics:
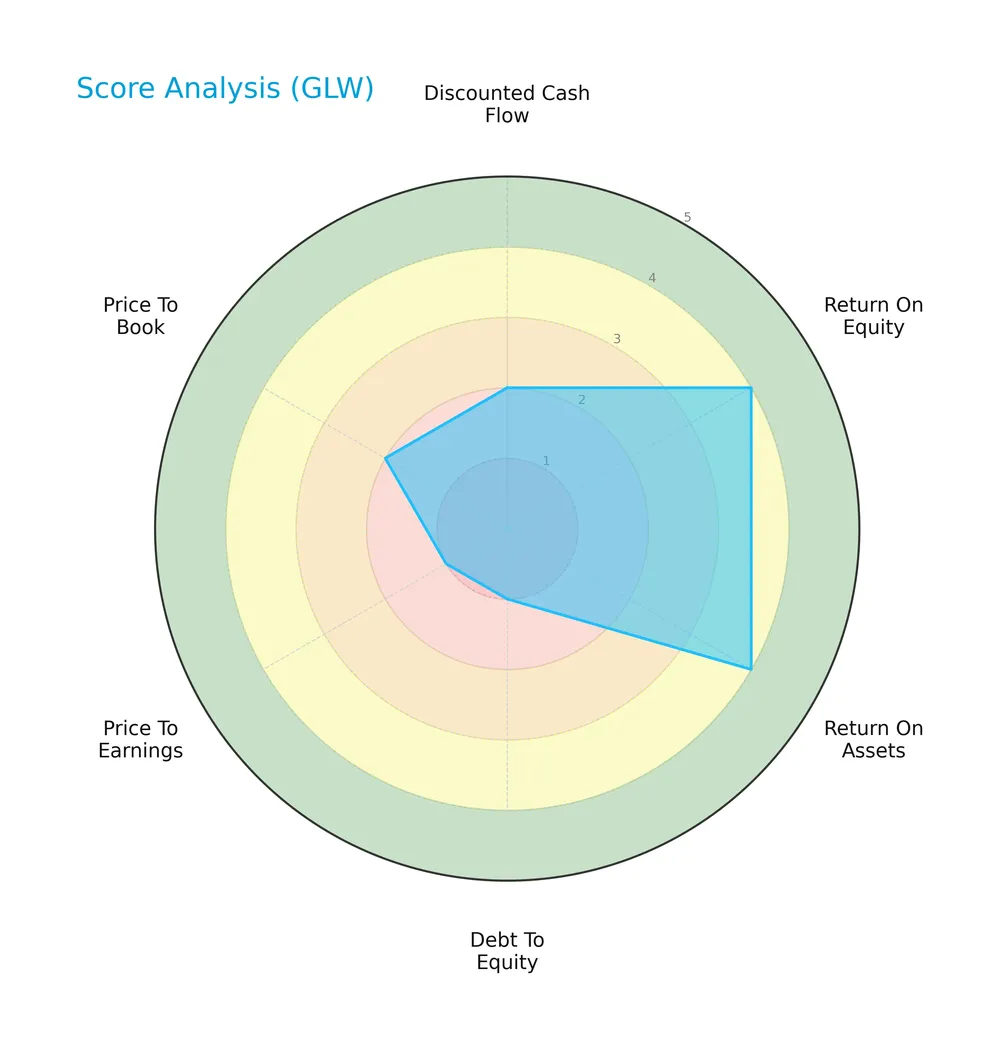
Corning’s return on equity and assets scores are favorable at 4 each, indicating efficient profitability. However, its debt-to-equity and price-to-earnings scores score poorly at 1, signaling leverage concerns and expensive valuation. Other metrics remain unfavorable.
Analysis of the company’s bankruptcy risk
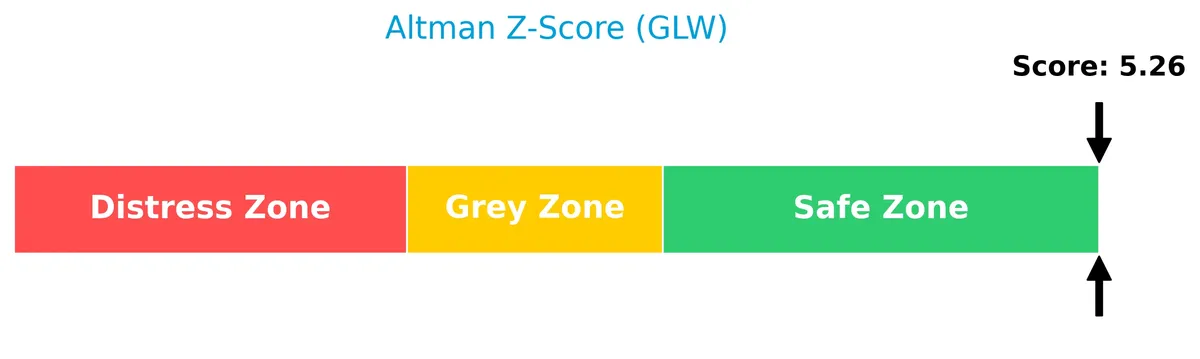
Corning’s Altman Z-Score firmly places it in the safe zone, reflecting low bankruptcy risk and financial stability:
Is the company in good financial health?
The Piotroski diagram illustrates Corning’s financial strength through profitability and operational efficiency metrics:
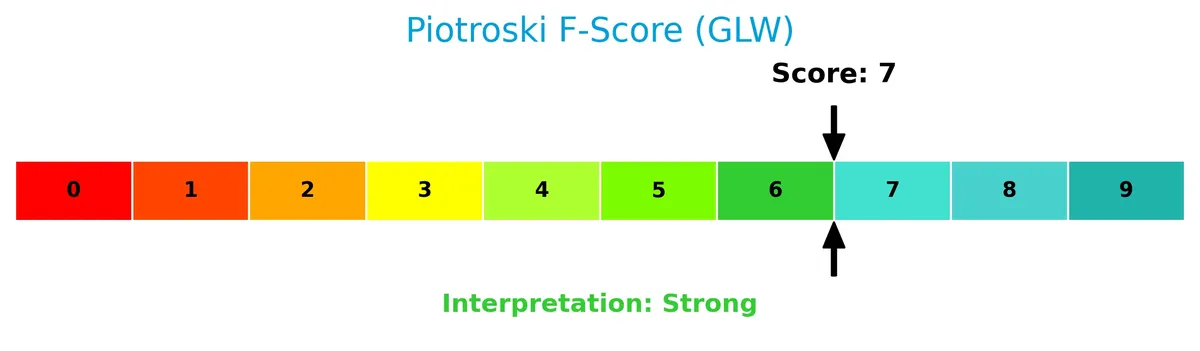
With a strong Piotroski Score of 7, Corning demonstrates solid financial health, suggesting it manages leverage, liquidity, and profitability well despite some valuation challenges.
Competitive Landscape & Sector Positioning
This section examines Corning Incorporated’s strategic positioning, revenue streams, and product portfolio within its sector. I will assess whether Corning holds a competitive advantage over its main rivals in the technology industry.
Strategic Positioning
Corning Incorporated maintains a diversified product portfolio spanning display technologies, optical communications, specialty materials, environmental technologies, and life sciences. Geographically, it balances revenues across Asia Pacific (7.6B), North America (7.1B), and Europe (1.4B), reflecting broad global exposure in the technology hardware sector.
Revenue by Segment
The pie chart presents Corning Incorporated’s revenue distribution by product segment for fiscal year 2025, highlighting the diversity and scale of its business units.
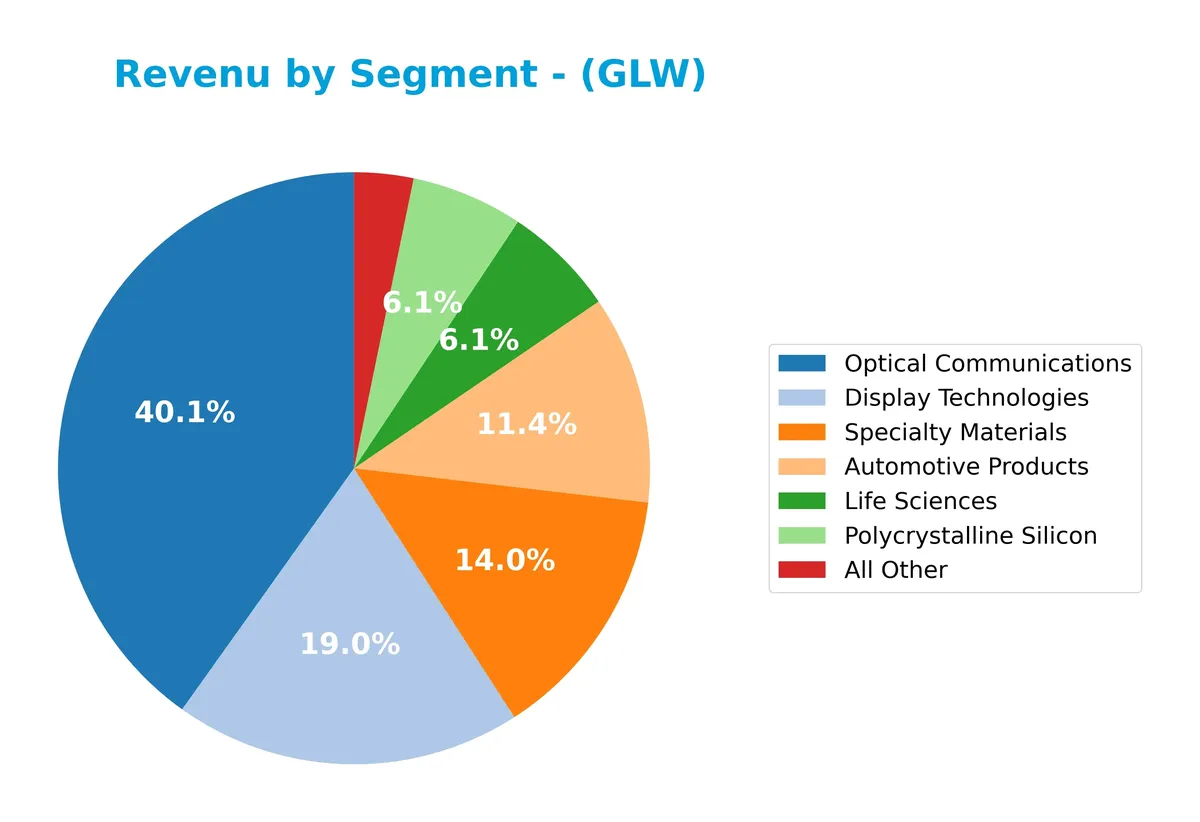
Optical Communications leads with $6.27B, underscoring its role as the primary revenue driver. Display Technologies remains significant at $3B, though it shows a relative decline from prior years. Specialty Materials and Automotive Products contribute $2.19B and $1.78B, respectively, reflecting steady growth. Life Sciences and Polycrystalline Silicon hold smaller but notable shares. The 2025 mix signals a concentration in high-tech optical and specialty materials, with emerging focus areas balancing mature segments.
Key Products & Brands
Corning’s product portfolio spans multiple advanced technology and materials segments, including display and optical communications:
| Product | Description |
|---|---|
| Display Technologies | Glass substrates for LCD and OLED screens used in TVs, computers, tablets, and handheld devices. |
| Optical Communications | Optical fibers, cables, hardware, connectors, components, and network interface devices for communications. |
| Specialty Materials | Material formulations for glass, ceramics, crystals; ultra-thin glass wafers; sunglasses; radiation shielding. |
| Environmental Technologies | Ceramic substrates and filters for emissions control in gasoline and diesel engines. |
| Life Sciences | Laboratory consumables, plastic vessels, cell culture media, and labware under Corning, Falcon, Pyrex brands. |
| Automotive Products | Products related to automotive applications (revenue reported for 2025). |
| Polycrystalline Silicon | Silicon materials used in various industrial applications (revenue reported for 2025). |
| All Other | Miscellaneous products not classified in main segments. |
Corning’s diverse product lineup reflects its leadership in specialty glass and materials, optical solutions, and laboratory equipment. The firm balances mature display and optical segments with growth areas like automotive and life sciences.
Main Competitors
The sector includes 20 competitors, with the table listing the top 10 leaders by market capitalization:
| Competitor | Market Cap. |
|---|---|
| Amphenol Corporation | 171B |
| Corning Incorporated | 77.7B |
| TE Connectivity Ltd. | 68.6B |
| Sandisk Corporation | 40.0B |
| Garmin Ltd. | 38.9B |
| Keysight Technologies, Inc. | 35.5B |
| Celestica Inc. | 34.0B |
| Coherent, Inc. | 28.7B |
| Jabil Inc. | 25.7B |
| Teledyne Technologies Incorporated | 24.4B |
Corning Incorporated ranks 2nd among 20 competitors, holding 67% of the market cap of the leader, Amphenol Corporation. It stands above both the average market cap of the top 10 (54.4B) and the sector median (21.6B). Corning’s market cap exceeds its nearest rival, TE Connectivity, by 49.46%, illustrating a significant competitive gap.
Comparisons with competitors
Check out how we compare the company to its competitors:
Does Corning Incorporated have a competitive advantage?
Corning Incorporated currently shows a slightly unfavorable competitive advantage as its ROIC lags behind WACC by 0.93%, indicating value destruction despite a positive ROIC growth trend. The company’s 35.3% gross margin and 15.3% EBIT margin are favorable but have not yet translated into consistent value creation above capital costs.
Looking ahead, Corning’s diversified segments in display technologies, optical communications, specialty materials, environmental technologies, and life sciences offer multiple growth avenues. Expansion in Asia Pacific and North America markets, along with innovation in OLED substrates and optical fiber solutions, present meaningful opportunities for future competitive strength.
SWOT Analysis
This SWOT analysis highlights Corning Incorporated’s key strategic factors to guide investment decisions.
Strengths
- diversified tech portfolio
- strong revenue growth (19%)
- solid global footprint with Asia Pacific expansion
Weaknesses
- value destruction indicated by ROIC < WACC
- high valuation multiples (PE 47.18, PB 6.38)
- moderate debt-to-equity ratio (0.71)
Opportunities
- rising demand in optical communications
- growth in specialty materials and life sciences
- expansion in Asia Pacific markets
Threats
- intense competition in display tech
- supply chain risks for materials
- macroeconomic volatility impacting tech spending
Corning’s strengths in innovation and geographic reach support growth, but value erosion and high valuation pose risks. The company must leverage growth opportunities while managing competitive and macroeconomic pressures.
Stock Price Action Analysis
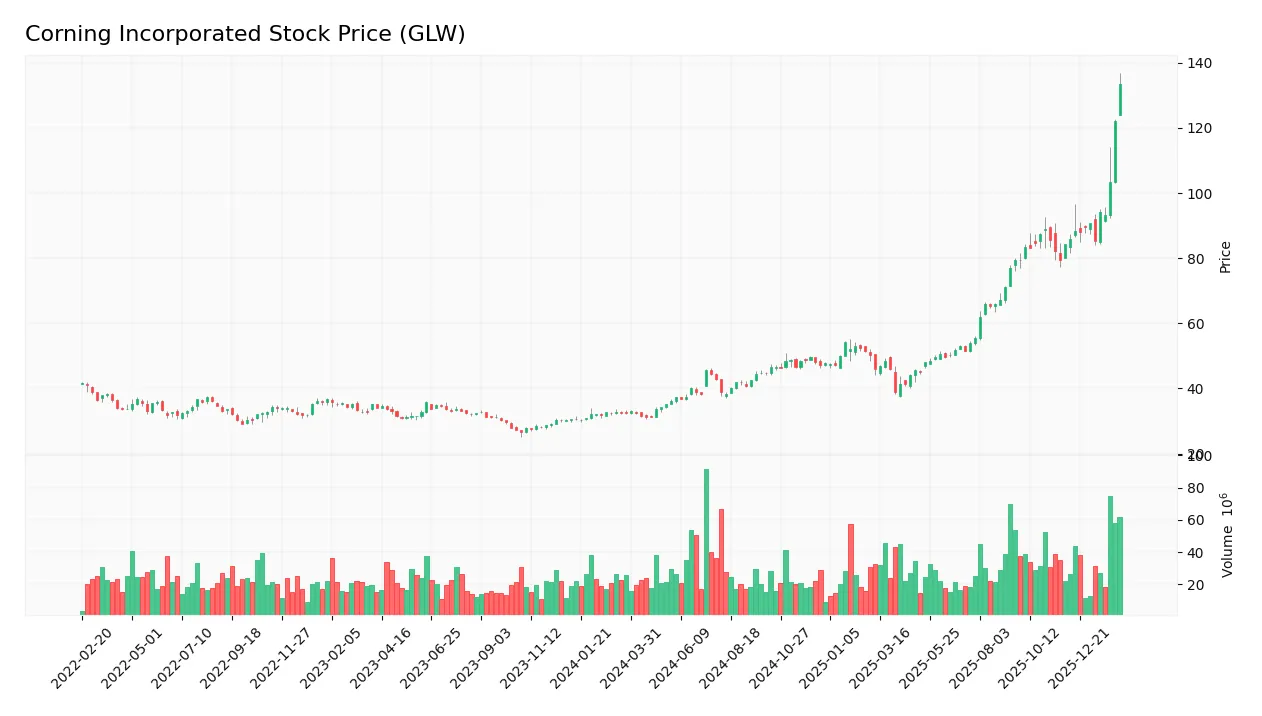
The weekly stock chart reveals Corning Incorporated’s price movement over the past 12 months, highlighting key peaks and troughs:
Trend Analysis
Over the past 12 months, Corning’s stock gained 310%, indicating a strong bullish trend with acceleration. The price ranged from a low of 31.27 to a high of 133.46. Volatility remains elevated, with a standard deviation of 20.87, confirming significant but sustained upward momentum.
Volume Analysis
Trading volume shows an increasing trend with buyer dominance at 64%. In the recent three months, buyers intensify control at 79%, signaling strong investor confidence and heightened market participation in Corning’s shares. Seller activity remains comparatively subdued, reinforcing bullish sentiment.
Target Prices
Analysts present a solid target consensus for Corning Incorporated, reflecting optimistic growth expectations.
| Target Low | Target High | Consensus |
|---|---|---|
| 100 | 135 | 118.67 |
The target range suggests confidence in Corning’s potential, with a consensus price indicating upside from current levels.

Don’t Let Luck Decide Your Entry Point
Optimize your entry points with our advanced ProRealTime indicators. You’ll get efficient buy signals with precise price targets for maximum performance. Start outperforming now!
Analyst & Consumer Opinions
This section examines the latest analyst ratings and consumer feedback regarding Corning Incorporated’s market performance and products.
Stock Grades
Here are the latest verified stock grades from reputable financial institutions for Corning Incorporated (GLW):
| Grading Company | Action | New Grade | Date |
|---|---|---|---|
| Morgan Stanley | Maintain | Equal Weight | 2026-01-29 |
| Mizuho | Maintain | Outperform | 2026-01-29 |
| Citigroup | Maintain | Buy | 2026-01-29 |
| Susquehanna | Maintain | Positive | 2026-01-29 |
| JP Morgan | Maintain | Overweight | 2026-01-28 |
| Citigroup | Maintain | Buy | 2026-01-12 |
| Morgan Stanley | Maintain | Equal Weight | 2025-12-17 |
| UBS | Maintain | Buy | 2025-11-21 |
| UBS | Maintain | Buy | 2025-10-29 |
| Susquehanna | Maintain | Positive | 2025-10-29 |
The consensus shows stability with most firms maintaining positive or outperforming grades. Citigroup and UBS consistently rate GLW as a Buy, while Morgan Stanley favors a more cautious Equal Weight, indicating a balanced view across the sector.
Consumer Opinions
Corning Incorporated enjoys a solid reputation for innovation, but some users express concerns about pricing and customer service.
| Positive Reviews | Negative Reviews |
|---|---|
| Products are highly durable and reliable. | Customer support response times lag. |
| Cutting-edge technology enhances user experience. | Some products come at a premium price. |
| Strong brand trust built over decades. | Occasional delays in product availability. |
Overall, consumers praise Corning’s product quality and innovation. However, pricing and customer service remain recurring issues, suggesting room for improvement in user engagement and accessibility.
Risk Analysis
Key risks facing Corning Incorporated encompass financial, market, and operational factors as detailed below:
| Category | Description | Probability | Impact |
|---|---|---|---|
| Valuation Risk | Elevated P/E (47.18) and P/B (6.38) ratios suggest potential overvaluation. | High | High |
| Market Volatility | Beta of 1.124 indicates sensitivity to market swings. | Medium | Medium |
| Leverage Risk | Debt-to-equity ratio signals moderate leverage but with some caution. | Medium | Medium |
| Technology Risk | Rapid innovation in display and optical sectors could erode competitive edge. | Medium | High |
| Supply Chain | Global supply disruptions could impact production timelines. | Medium | Medium |
| Dividend Risk | Dividend yield at 1.33% may limit income appeal during economic downturns. | Low | Low |
Corning’s valuation risks stand out given its high P/E and P/B multiples relative to sector averages. Though financially stable with a safe Altman Z-Score (5.26), the premium pricing heightens downside risk if growth slows. Technological shifts in display and optical markets remain critical to watch for maintaining its moat.
Should You Buy Corning Incorporated?
Corning appears to be improving profitability with growing ROIC despite a slightly unfavorable moat and value destruction. Its leverage profile remains substantial, posing risks. Supported by a strong Altman Z-Score and Piotroski score, the overall rating could be seen as B-.
Strength & Efficiency Pillars
Corning Incorporated shows solid operational efficiency with a net margin of 10.21% and an EBIT margin of 15.28%. Its return on equity (13.52%) is steady, while ROIC at 7.57% slightly lags behind the WACC of 8.5%, indicating the company is currently shedding value. Despite this, Corning’s growing ROIC trend signals improving profitability. The Altman Z-Score of 5.26 places the firm securely in the safe zone, supporting confidence in its financial health.
Weaknesses and Drawbacks
Corning faces valuation headwinds, trading at a high P/E ratio of 47.18 and a P/B of 6.38, suggesting a premium market valuation that may limit upside. Although leverage is moderate with a debt-to-equity ratio of 0.71 and favorable liquidity ratios (current ratio 1.59, quick ratio 1.04), these metrics demand caution amid elevated multiples. Market momentum remains bullish, supported by strong buyer dominance (79.34%), yet the lofty valuation poses a risk in volatile conditions.
Our Final Verdict about Corning Incorporated
Corning’s profile might appear attractive for long-term exposure given its robust operational margins and strong solvency indicated by the Altman Z-Score. The bullish stock trend and strong buyer dominance support positive momentum. However, premium valuation multiples introduce risk, suggesting investors may prefer a wait-and-see stance for a more favorable entry point. Overall, the company balances improving profitability against valuation caution.
Disclaimer: This content is for informational purposes only and does not constitute financial, investment, or other professional advice. Investing in financial markets involves a significant risk of loss, and past performance is not indicative of future results.
Additional Resources
- AI Deals Drives Corning (GLW) Shares Up 50% In 2026: Can the Rally Continue? – 24/7 Wall St. (Feb 13, 2026)
- Wealthfront Advisers LLC Purchases 10,244 Shares of Corning Incorporated $GLW – MarketBeat (Feb 13, 2026)
- GLW Rides on Solid Traction in Optical Communication: Will it Sustain? – The Globe and Mail (Feb 13, 2026)
- Decoding Corning Inc (GLW): A Strategic SWOT Insight – GuruFocus (Feb 13, 2026)
- GLW Stock Price, Forecast & Analysis | CORNING INC (NYSE:GLW) – ChartMill (Feb 10, 2026)
For more information about Corning Incorporated, please visit the official website: corning.com