Home > Analyses > Industrials > Core & Main, Inc.
Core & Main shapes the backbone of America’s water and fire protection infrastructure. As a premier distributor, it delivers essential pipes, valves, hydrants, and smart meter solutions that keep communities safe and running. Renowned for its deep industry expertise and broad product range, Core & Main stands as a vital partner to municipalities and contractors nationwide. The key question now: do its solid fundamentals support sustained growth amid evolving infrastructure demands?

Table of contents
Business Model & Company Overview
Core & Main, Inc., founded in 1874 and headquartered in St. Louis, Missouri, commands a leading position in the industrial distribution sector. It offers a comprehensive ecosystem of water, wastewater, storm drainage, and fire protection products tailored for municipalities, private water firms, and contractors. Its portfolio spans pipes, valves, hydrants, storm drainage systems, fire suppression devices, and smart meters—forming a cohesive infrastructure solutions network.
The company’s revenue engine balances product sales with value-added services across the United States. It generates consistent cash flow from recurring demand in maintenance, repair, and construction of critical water and fire protection infrastructure. Core & Main’s strategic footprint in diverse end markets strengthens its economic moat, reinforcing its role as a key architect of municipal infrastructure resilience.
Financial Performance & Fundamental Metrics
I will analyze Core & Main, Inc.’s income statement, key financial ratios, and dividend payout policy to assess its overall financial health and shareholder value.
Income Statement
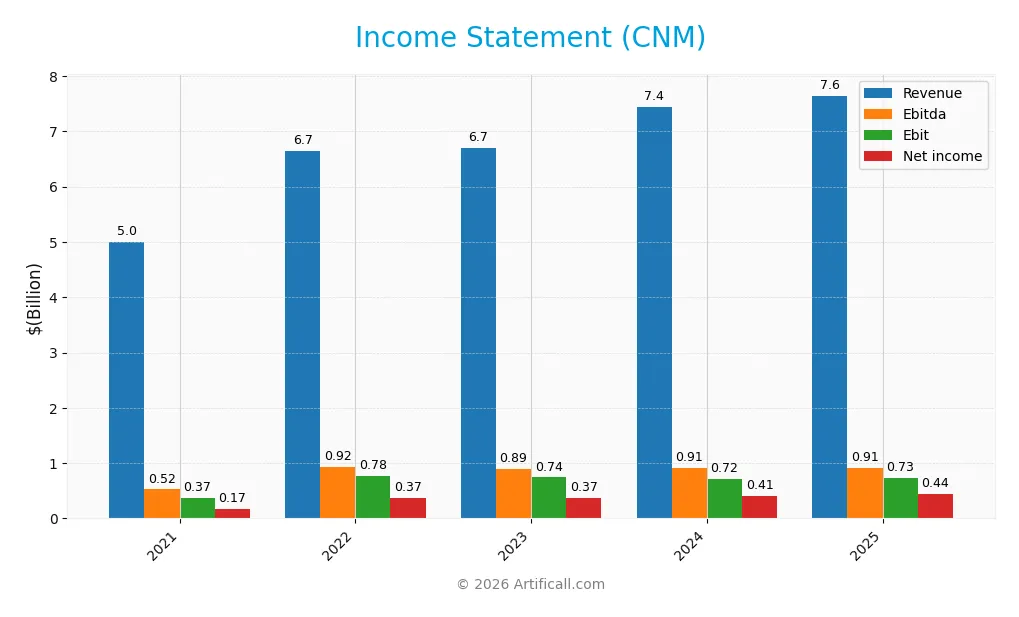
Below is Core & Main, Inc.’s income statement summary for fiscal years 2021 through 2025, showing key profitability and expense metrics.
| 2021 | 2022 | 2023 | 2024 | 2025 | |
|---|---|---|---|---|---|
| Revenue | 5B | 6.65B | 6.7B | 7.44B | 7.65B |
| Cost of Revenue | 3.72B | 4.86B | 4.88B | 5.46B | 5.59B |
| Operating Expenses | 855M | 1.02B | 1.08B | 1.26B | 1.34B |
| Gross Profit | 1.28B | 1.79B | 1.82B | 1.98B | 2.06B |
| EBITDA | 524M | 924M | 894M | 913M | 914M |
| EBIT | 374M | 775M | 740M | 719M | 728M |
| Interest Expense | 98M | 66M | 81M | 142M | 142M |
| Net Income | 166M | 366M | 371M | 411M | 441M |
| EPS | 0.84 | 3.10 | 2.83 | 2.14 | 2.32 |
| Filing Date | 2022-03-30 | 2023-03-28 | 2024-03-19 | 2025-03-25 | 2026-03-24 |
Income Statement Evolution
Core & Main, Inc. reported steady revenue growth from 5B in 2021 to 7.65B in 2025, a 53% increase over five years. Net income surged 166%, reflecting improved profitability. Gross margin remained favorable around 27%, while EBIT margin stayed neutral near 9.5%. Net margin showed a positive trend, reaching 5.77% in 2025, signaling better cost control.
Is the Income Statement Favorable?
In 2025, fundamentals appear generally favorable. Revenue increased 2.8% year-over-year, though growth slowed. Gross profit and EBIT grew modestly, indicating stable operations. Net margin improved 4.4%, and EPS rose 8.5%, demonstrating earnings quality. Interest expense at 1.86% of revenue remains manageable. The income statement reflects solid profitability with moderate efficiency gains.
Financial Ratios
The table below summarizes Core & Main, Inc.’s key financial ratios from 2021 to 2025, providing insight into profitability, valuation, liquidity, leverage, and efficiency:
| Ratios | 2021 | 2022 | 2023 | 2024 | 2025 |
|---|---|---|---|---|---|
| Net Margin | 3.3% | 5.5% | 5.5% | 5.5% | 5.8% |
| ROE | 12.5% | 21.0% | 25.6% | 24.2% | 22.1% |
| ROIC | 9.5% | 14.9% | 13.7% | 10.6% | 10.4% |
| P/E | 23.1 | 9.9 | 19.6 | 26.0 | 23.6 |
| P/B | 2.9 | 2.1 | 5.0 | 6.3 | 5.2 |
| Current Ratio | 2.1 | 3.0 | 2.3 | 2.3 | 2.6 |
| Quick Ratio | 1.1 | 1.6 | 1.3 | 1.3 | 1.5 |
| D/E | 1.22 | 0.94 | 1.43 | 1.48 | 1.22 |
| Debt-to-Assets | 37% | 33% | 41% | 43% | 40% |
| Interest Coverage | 4.3 | 11.7 | 9.1 | 5.1 | 5.1 |
| Asset Turnover | 1.13 | 1.35 | 1.32 | 1.27 | 1.26 |
| Fixed Asset Turnover | 20.3 | 23.8 | 19.5 | 18.1 | 16.4 |
| Dividend Yield | 0% | 0% | 0% | 0% | 0% |
Evolution of Financial Ratios
Core & Main, Inc.’s Return on Equity (ROE) fluctuated moderately, peaking at 25.57% in 2023 before settling at 22.08% in 2025. The Current Ratio showed steady improvement from 2.11 in 2021 to 2.63 in 2025, reflecting enhanced liquidity. Debt-to-Equity trended downward slightly but remained elevated around 1.22, indicating sustained leverage.
Are the Financial Ratios Fovorable?
In 2025, Core & Main posts favorable profitability with ROE at 22.08% and ROIC at 10.43%, above its 7.65% WACC. Liquidity is strong, supported by a Current Ratio of 2.63 and Quick Ratio of 1.51. Asset and fixed asset turnovers are robust at 1.26 and 16.45, respectively. However, Debt-to-Equity at 1.22 and Price-to-Book at 5.2 are less favorable. The dividend yield remains zero, signaling no shareholder distributions. Overall, ratios skew favorable.
Shareholder Return Policy
Core & Main, Inc. does not pay dividends, reflecting a reinvestment strategy likely aimed at growth and operational strengthening. The company engages in share buybacks, which can return value to shareholders without direct dividend payments.
This approach aligns with sustaining long-term shareholder value, provided buybacks are disciplined and supported by strong free cash flow. Absence of dividends signals prioritization of capital allocation towards growth opportunities rather than immediate income distribution.
Score analysis
The following radar chart presents key financial scores for Core & Main, Inc., highlighting strengths and weaknesses across valuation and profitability metrics:
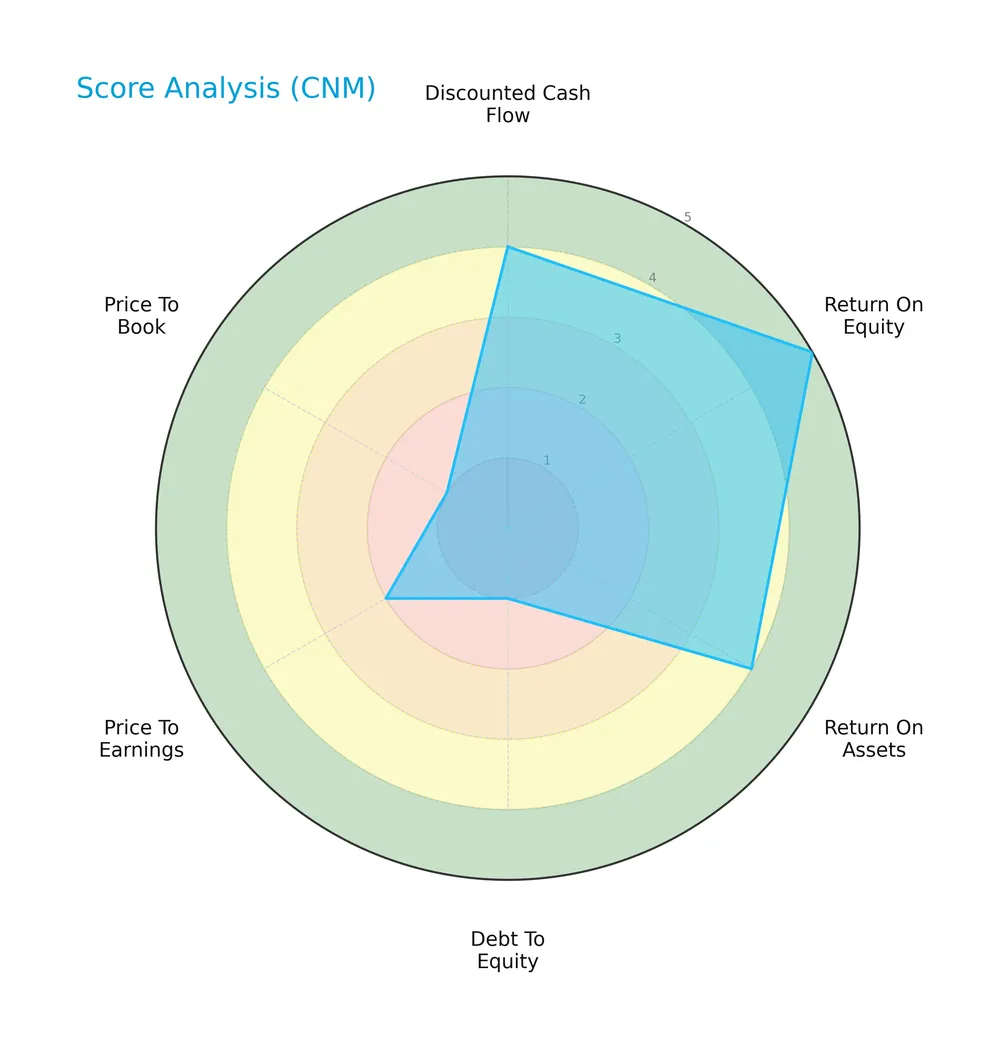
Core & Main shows strong profitability with a very favorable ROE score of 5 and a favorable ROA score of 4. Its discounted cash flow score of 4 indicates solid intrinsic value. However, debt to equity is very unfavorable at 1, signaling high leverage risk. Valuation multiples are weak with PE at 2 and PB at 1, suggesting the stock may be undervalued or facing market skepticism.
Analysis of the company’s bankruptcy risk
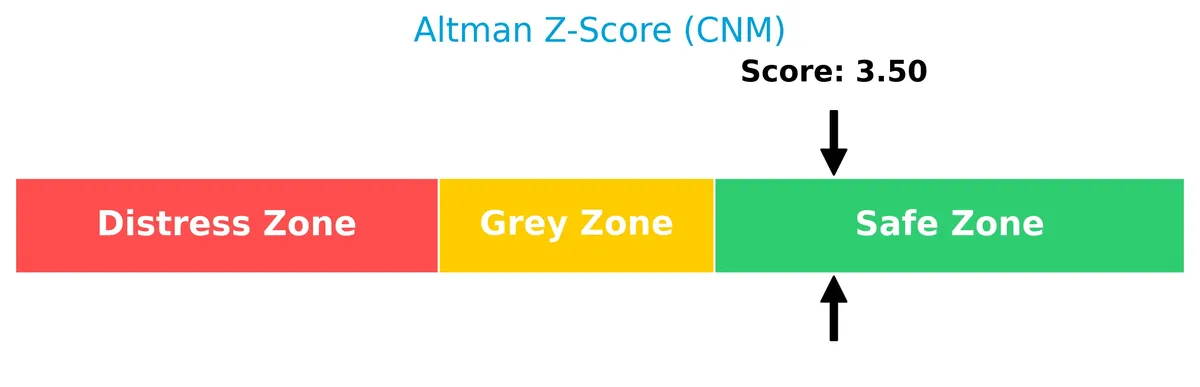
Core & Main’s Altman Z-Score of 3.5 places it securely in the safe zone, indicating a low risk of bankruptcy based on its financial health and stability:
Is the company in good financial health?
The Piotroski Score diagram below illustrates the company’s strong financial condition based on profitability, leverage, and efficiency criteria:
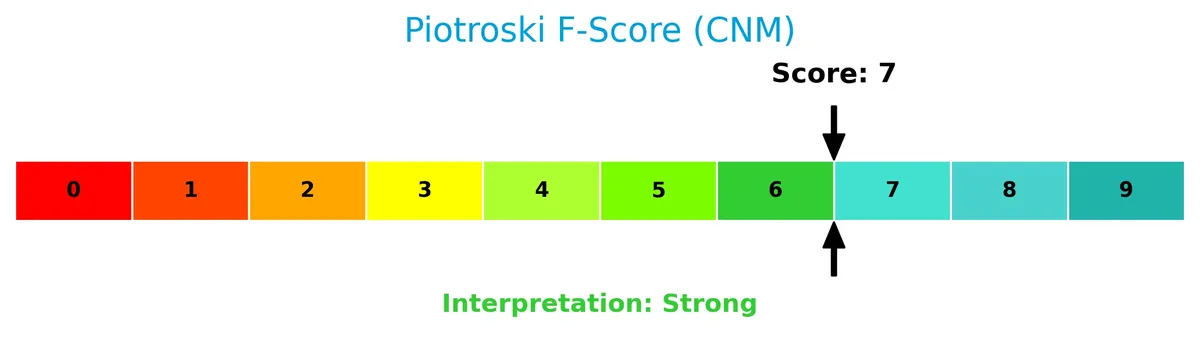
With a Piotroski Score of 7, Core & Main demonstrates strong financial health. This level suggests it maintains solid operational performance and prudent financial management, positioning it well compared to typical benchmarks.
Competitive Landscape & Sector Positioning
This analysis examines Core & Main, Inc.’s sector positioning within industrial distribution, focusing on strategic aspects. I will assess whether Core & Main holds a competitive advantage over its main competitors.
Strategic Positioning
Core & Main, Inc. focuses on a concentrated product portfolio centered on pipes, valves, fittings, storm drainage, fire protection, and meter products. Its geographic exposure is primarily domestic, with minimal non-US sales, emphasizing deep specialization in the U.S. municipal and infrastructure markets.
Revenue by Segment
This pie chart illustrates Core & Main, Inc.’s revenue distribution by product segment for fiscal year 2025, highlighting the company’s sales composition across four key categories.
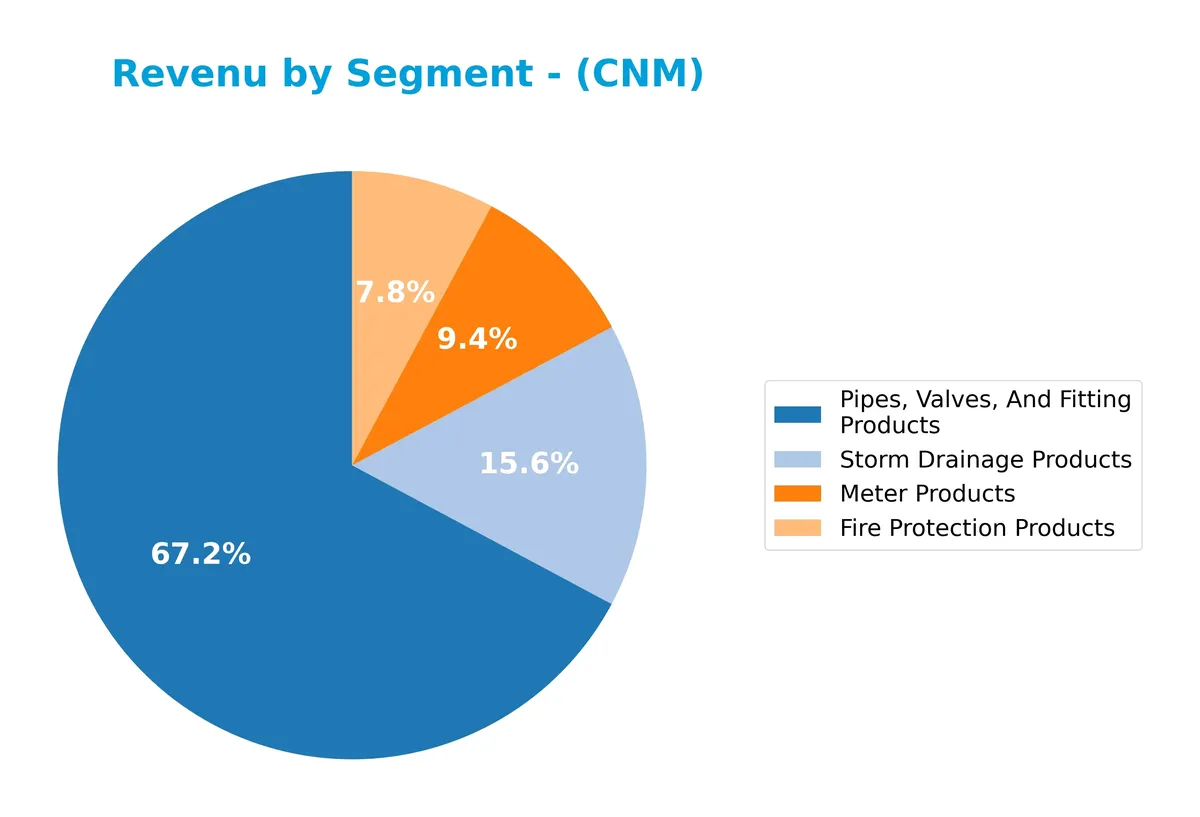
Pipes, Valves, And Fitting Products dominate with $5.14B, driving Core & Main’s growth steadily from 2021. Storm Drainage Products and Meter Products show consistent gains, reaching $1.19B and $716M respectively in 2025. Fire Protection Products remain stable near $600M after peaking earlier. The revenue mix highlights strong concentration in the core piping segment, which accelerates growth but warrants monitoring for diversification risks.
Key Products & Brands
Core & Main’s product portfolio spans essential infrastructure categories, serving diverse municipal and private customers:
| Product | Description |
|---|---|
| Pipes, Valves, And Fitting Products | Core piping components including valves, hydrants, and fittings critical for water and fire protection systems. |
| Storm Drainage Products | Includes corrugated piping systems, retention basins, manholes, grates, and geosynthetics for stormwater management. |
| Fire Protection Products | Fire protection pipes, sprinkler heads, suppression systems, and related accessories, plus fabrication services. |
| Meter Products | Smart meter products, installation, software, and services for water usage measurement and management. |
Core & Main delivers a comprehensive range of water, wastewater, storm drainage, and fire protection products. Its steady revenue growth reflects broad municipal and commercial demand for critical infrastructure components.
Main Competitors
There are 3 competitors in the Industrials sector; below is a table of the top 3 leaders by market capitalization:
| Competitor | Market Cap. |
|---|---|
| W.W. Grainger, Inc. | 47.7B |
| Fastenal Company | 46.4B |
| Pool Corporation | 8.6B |
Core & Main, Inc. is not ranked among the top 3 competitors by market cap. Its relative market cap to the leader is 0, indicating it is significantly smaller than W.W. Grainger, Inc. The company sits below both the average market cap of the top 10 (34.2B) and the sector median (46.4B). With no competitors ranked just above it, Core & Main faces a wide gap to its closest rivals.
Comparisons with competitors
Check out how we compare the company to its competitors:
Aucun article trouvé pour ces critères.
Does Core & Main, Inc. have a competitive advantage?
Core & Main, Inc. demonstrates a sustainable competitive advantage, evidenced by a ROIC exceeding WACC by 2.78% and a growing ROIC trend of 10.2% over 2021-2025. This indicates efficient capital use and value creation amid stable profitability.
Looking ahead, Core & Main’s product range in water infrastructure and fire protection positions it well for growth opportunities within municipal and private sectors. Continued innovation in smart meter technologies and expansion in storm drainage markets could further enhance its competitive standing.
SWOT Analysis
This SWOT analysis highlights Core & Main, Inc.’s key internal and external factors affecting its competitive position and growth prospects.
Strengths
- Strong ROE of 22%
- ROIC well above WACC, indicating value creation
- Diverse product portfolio across critical infrastructure sectors
Weaknesses
- High debt-to-equity ratio of 1.22, increasing financial risk
- Elevated price-to-book ratio of 5.2, suggesting overvaluation
- No dividend yield, potentially limiting income investors
Opportunities
- Infrastructure spending growth in US municipalities
- Expansion of smart meter and fire protection markets
- Potential to improve operational efficiencies and margins
Threats
- Economic downturns reducing municipal budgets
- Intense competition in industrial distribution
- Rising raw material costs pressuring margins
Core & Main demonstrates a robust competitive moat with solid profitability and growth drivers. However, elevated leverage and valuation caution suggest prudence. The company should leverage infrastructure trends while managing debt and cost pressures to sustain its market position.
Stock Price Action Analysis
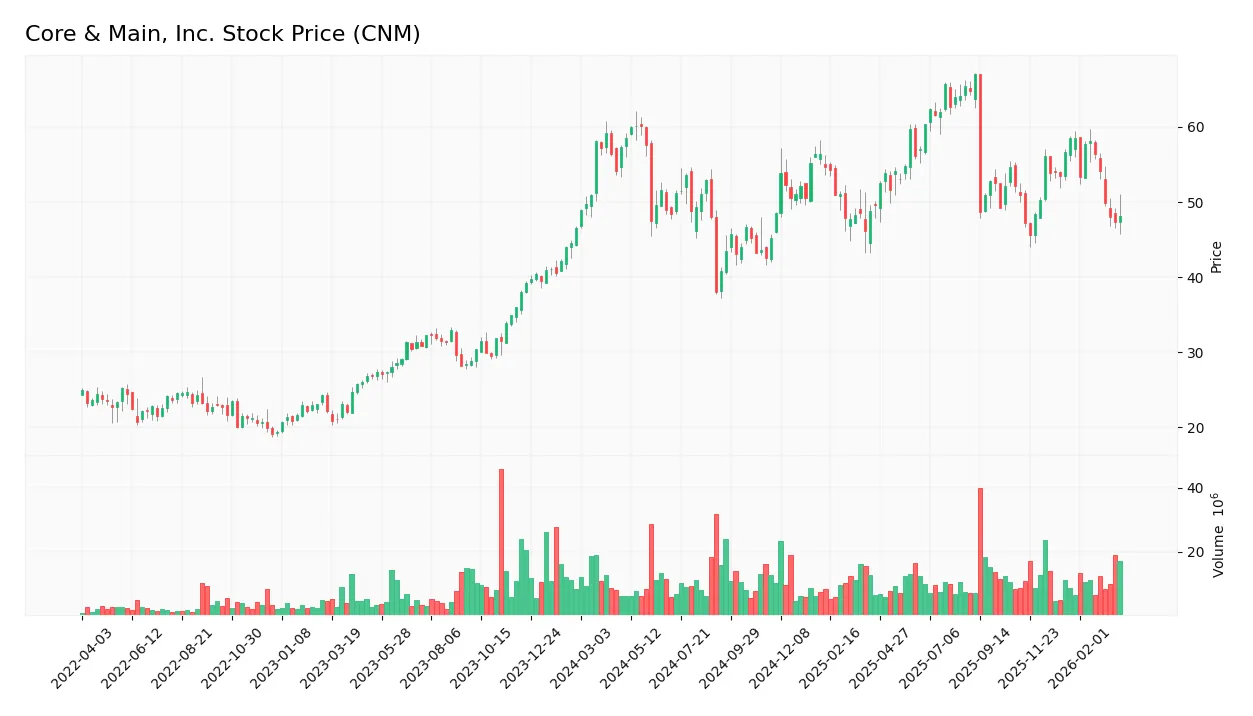
The weekly price chart below shows Core & Main, Inc. (CNM) stock performance over the past 12 months:
Trend Analysis
Over the past 12 months, CNM stock declined 17.72%, indicating a bearish trend. The price range spans from a high of 66.98 to a low of 38.05, with volatility measured by a 5.91 standard deviation. The bearish trend shows deceleration, suggesting a slowing pace of decline.
Volume Analysis
In the last three months, trading volume for CNM decreased. Buyer volume dropped to 48.33%, indicating a neutral buyer-seller balance with slightly more sellers. This decline in activity points to weakening market participation and cautious investor sentiment.
Target Prices
Analysts set a clear target price consensus for Core & Main, Inc. (CNM), indicating moderate upside potential.
| Target Low | Target High | Consensus |
|---|---|---|
| 63 | 65 | 64.17 |
The target range is tight, reflecting analyst confidence in CNM’s steady valuation around $64. This suggests modest growth expectations.

Don’t Let Luck Decide Your Entry Point
Optimize your entry points with our advanced ProRealTime indicators. You’ll get efficient buy signals with precise price targets for maximum performance. Start outperforming now!
Analyst & Consumer Opinions
This section reviews recent analyst grades and consumer feedback to provide a balanced view of Core & Main, Inc.’s market perception.
Stock Grades
Here are the latest verified analyst grades for Core & Main, Inc. from reputable firms:
| Grading Company | Action | New Grade | Date |
|---|---|---|---|
| Barclays | Maintain | Overweight | 2026-03-25 |
| Deutsche Bank | Maintain | Buy | 2026-03-25 |
| Wells Fargo | Maintain | Overweight | 2026-01-14 |
| Citigroup | Maintain | Neutral | 2026-01-08 |
| Deutsche Bank | Maintain | Buy | 2025-12-11 |
| Wells Fargo | Maintain | Overweight | 2025-12-10 |
| Baird | Maintain | Outperform | 2025-12-10 |
| JP Morgan | Maintain | Overweight | 2025-12-10 |
| Citigroup | Maintain | Neutral | 2025-12-10 |
| Wells Fargo | Maintain | Overweight | 2025-12-04 |
The consensus leans bullish, with multiple firms maintaining “Buy” or “Overweight” ratings. Neutral grades from Citigroup provide some balance, while no downgrades or sell recommendations appear.
Consumer Opinions
Core & Main, Inc. (CNM) elicits mixed but insightful feedback from its customer base, reflecting on service quality and product reliability.
| Positive Reviews | Negative Reviews |
|---|---|
| “Reliable delivery times and helpful support.” | “Occasional delays in order fulfillment.” |
| “High-quality materials that meet industry standards.” | “Customer service can be slow during peak periods.” |
| “Competitive pricing with flexible payment options.” | “Limited product variety in certain regions.” |
Overall, consumers appreciate Core & Main’s consistent product quality and competitive pricing. However, recurring concerns about delivery delays and customer service responsiveness suggest areas for operational improvement.
Risk Analysis
Below is a summary table of key risks Core & Main, Inc. faces, highlighting their likelihood and potential impact:
| Category | Description | Probability | Impact |
|---|---|---|---|
| Leverage Risk | High debt-to-equity ratio (1.22) signals elevated financial leverage. | Medium | High |
| Valuation Risk | Elevated price-to-book ratio (5.2) suggests stock may be overvalued. | Medium | Medium |
| Dividend Policy | No dividend yield could deter income-focused investors. | High | Low |
| Market Volatility | Beta near 1 (0.978) implies stock closely tracks market swings. | High | Medium |
| Sector Cyclicality | Industrial distribution sector sensitive to economic downturns. | Medium | High |
| Interest Rate Risk | Interest coverage ratio (5.13) is adequate but could worsen if rates rise. | Low | Medium |
The most critical risks are Core & Main’s high leverage and sector cyclicality. Despite a safe Altman Z-Score (3.5) and a strong Piotroski score (7), elevated debt poses refinancing and liquidity challenges during recessions. The firm’s favorable ROIC (10.43%) above WACC (7.65%) shows disciplined capital allocation, but valuation metrics warn caution. Investors should weigh these risks against robust profitability and liquidity ratios.
Should You Buy Core & Main, Inc.?
Core & Main, Inc. appears to be a company with robust profitability and a very favorable moat, supported by growing ROIC exceeding its WACC, suggesting strong value creation. Despite a challenging leverage profile, its overall rating is a solid B, indicating a generally favorable financial health.
Strength & Efficiency Pillars
Core & Main, Inc. delivers solid operational efficiency with a net margin of 5.77% and a return on equity of 22.08%. Its return on invested capital stands at 10.43%, comfortably exceeding the weighted average cost of capital at 7.65%, marking the company as a clear value creator. I observe sustained profitability and a growing ROIC trend, signaling a durable competitive advantage. The Altman Z-Score of 3.50 places Core & Main in the safe zone, supporting financial stability.
Weaknesses and Drawbacks
Despite its strengths, Core & Main faces valuation and leverage challenges. Its price-to-book ratio at 5.2 signals an expensive premium relative to book value, while a debt-to-equity ratio of 1.22 raises leverage concerns. Although the current ratio is a strong 2.63, indicating liquidity, the high debt level could pressure future earnings. Market pressure is moderate with 56.38% buyer volume overall but recent buyer dominance dipped to 48.33%, reflecting neutral investor sentiment.
Our Final Verdict about Core & Main, Inc.
Core & Main presents a fundamentally strong profile with clear value creation and solid profitability. However, the recent neutral buyer behavior amid a bearish price trend suggests caution. Despite long-term strength, the current market dynamics might warrant a wait-and-see approach for a more favorable entry point. The company could appeal to investors seeking exposure to a financially sound but modestly pressured name.
Disclaimer: This content is for informational purposes only and does not constitute financial, investment, or other professional advice. Investing in financial markets involves a significant risk of loss, and past performance is not indicative of future results.
Additional Resources
- Florida bans sociology from core curriculum at state universities – Miami Herald (Mar 26, 2026)
- UNIQLO U Spring Summer 2026 Defines Neo-Core Wardrobe System – stupidDOPE (Mar 26, 2026)
- Jonny Kulow on ASU Sprint Core: “It’s honestly kind of like assembling the Avengers” – SwimSwam (Mar 27, 2026)
- Intel Core Ultra 270K and 250K Plus review: Conditionally great CPUs – Ars Technica (Mar 26, 2026)
- Intel’s upcoming ‘Wildcat Lake’ low-power series breaks cover in Geekbench listing — ‘Core 3 304’ is twice as fast in single-core performance versus last-gen – Tom’s Hardware (Mar 26, 2026)
For more information about Core & Main, Inc., please visit the official website: coreandmain.com