Home > Analyses > Industrials > Copart, Inc.
Copart, Inc. revolutionizes the vehicle remarketing industry by transforming how millions buy and sell cars through cutting-edge online auction technology. As a dominant player in specialty business services, Copart leverages innovative platforms and data-driven tools to streamline vehicle sales across multiple countries, setting high standards for efficiency and transparency. With a strong reputation for market influence and technological leadership, the key question remains: does Copart’s current valuation reflect its growth potential in an evolving global automotive landscape?

Table of contents
Business Model & Company Overview
Copart, Inc., founded in 1982 and headquartered in Dallas, Texas, commands a leading role in the specialty business services sector through its comprehensive online vehicle auction and remarketing ecosystem. Serving a diverse clientele—from licensed dismantlers to public buyers—Copart integrates virtual bidding technology with a broad suite of services, from salvage estimation to title processing, creating a seamless platform for end-of-life vehicle transactions across multiple continents.
The company’s revenue engine thrives on a balance of proprietary software tools like IntelliSeller and Copart 360, combined with physical infrastructure supporting vehicle inspections and transportation. Its global footprint spans the Americas, Europe, and Asia, enabling it to monetize both hardware and recurring digital services effectively. This diverse model underpins Copart’s strong economic moat, positioning it as a pivotal force shaping the future of vehicle remarketing worldwide.
Financial Performance & Fundamental Metrics
I will analyze Copart, Inc.’s income statement, key financial ratios, and dividend payout policy to provide a comprehensive view of its fundamental health.
Income Statement
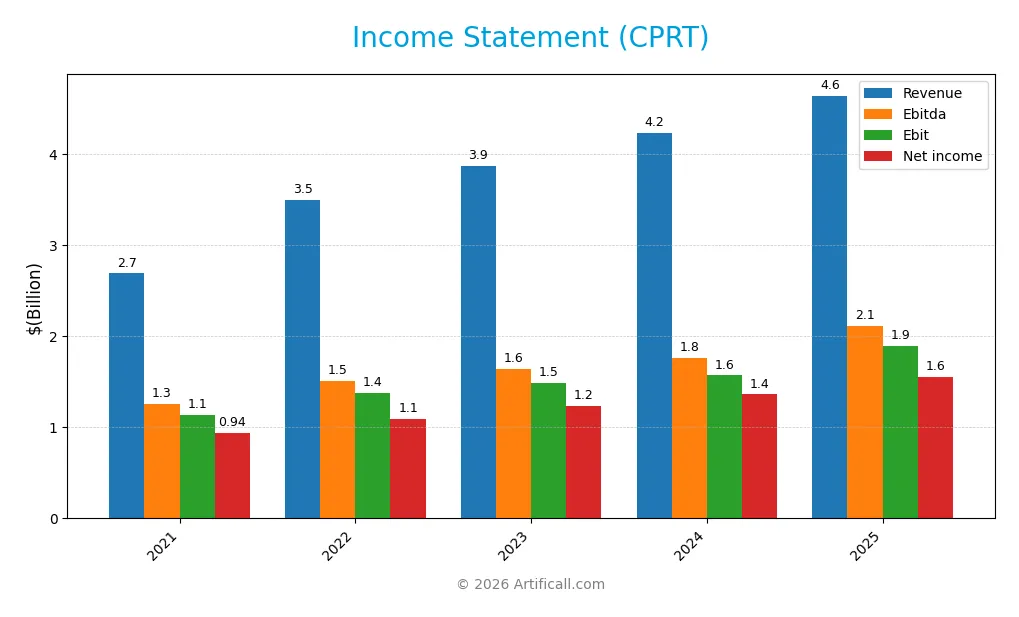
The table below summarizes Copart, Inc.’s income statement figures for fiscal years 2021 through 2025, reflecting key profitability and expense metrics.
| 2021 | 2022 | 2023 | 2024 | 2025 | |
|---|---|---|---|---|---|
| Revenue | 2.69B | 3.50B | 3.87B | 4.24B | 4.65B |
| Cost of Revenue | 1.35B | 1.89B | 2.13B | 2.33B | 2.55B |
| Operating Expenses | 207M | 231M | 250M | 335M | 403M |
| Gross Profit | 1.34B | 1.61B | 1.74B | 1.91B | 2.10B |
| EBITDA | 1.26B | 1.51B | 1.65B | 1.76B | 2.11B |
| EBIT | 1.14B | 1.37B | 1.49B | 1.57B | 1.90B |
| Interest Expense | 20M | 17M | 0 | 0 | 0 |
| Net Income | 936M | 1.09B | 1.24B | 1.36B | 1.55B |
| EPS | 0.99 | 1.15 | 1.30 | 1.42 | 1.61 |
| Filing Date | 2021-09-27 | 2022-09-27 | 2023-09-28 | 2024-09-30 | 2025-09-26 |
Income Statement Evolution
From 2021 to 2025, Copart, Inc. experienced consistent revenue growth, increasing by 72.6% overall and 9.7% in the most recent year. Net income also rose significantly, up 65.8% over the period and nearly 10% year-over-year. Although net margin slightly declined by 4% across these years, it remained stable recently, reflecting solid profitability. Key margins like gross (45.2%) and EBIT (40.8%) showed favorable improvement.
Is the Income Statement Favorable?
In fiscal 2025, Copart posted revenue of $4.65B and net income of $1.55B, translating into a strong net margin of 33.4%. EBIT margin reached 40.8%, supported by zero interest expense and controlled operating costs despite a slight unfavorable trend in expense growth relative to revenue. Overall, the fundamentals display a favorable financial profile with robust earnings growth and sound margin levels, suggesting effective operational management.
Financial Ratios
The following table presents key financial ratios for Copart, Inc. over the last five fiscal years, providing insight into profitability, leverage, liquidity, and valuation metrics:
| Ratios | 2021 | 2022 | 2023 | 2024 | 2025 |
|---|---|---|---|---|---|
| Net Margin | 35% | 31% | 32% | 32% | 33% |
| ROE | 27% | 24% | 21% | 18% | 17% |
| ROIC | 23% | 23% | 19% | 16% | 15% |
| P/E | 37.1 | 28.1 | 34.1 | 36.9 | 28.2 |
| P/B | 9.8 | 6.6 | 7.0 | 6.7 | 4.8 |
| Current Ratio | 4.0 | 5.0 | 6.6 | 7.0 | 8.3 |
| Quick Ratio | 3.9 | 4.9 | 6.5 | 7.0 | 8.2 |
| D/E | 0.15 | 0.03 | 0.02 | 0.02 | 0.01 |
| Debt-to-Assets | 11% | 2.3% | 1.8% | 1.4% | 1.0% |
| Interest Coverage | 56.1 | 82.4 | — | — | — |
| Asset Turnover | 0.59 | 0.66 | 0.57 | 0.50 | 0.46 |
| Fixed Asset Turnover | 1.11 | 1.35 | 1.31 | 1.29 | 1.26 |
| Dividend Yield | 0% | 0% | 0% | 0% | 0% |
Note: Interest Coverage is reported only for 2021 and 2022; dividend yield remains zero throughout the period.
Evolution of Financial Ratios
Copart’s Return on Equity (ROE) showed a declining trend from 26.5% in 2021 to 16.9% in 2025, indicating a slowdown in profitability growth. The Current Ratio improved significantly from 4.04 in 2021 to 8.25 in 2025, reflecting increased liquidity. Debt-to-Equity Ratio decreased markedly from 0.15 in 2021 to 0.01 in 2025, signaling reduced leverage and improved financial stability.
Are the Financial Ratios Favorable?
In 2025, Copart demonstrated favorable profitability with a net margin of 33.4% and ROE of 16.9%. Liquidity ratios were mixed: the quick ratio was favorable at 8.19, but the current ratio was deemed unfavorable at 8.25, possibly due to excessive current assets. Leverage ratios were very favorable, with a debt-to-equity of 0.01 and strong interest coverage. However, efficiency was less favorable, given a low asset turnover of 0.46, and valuation ratios like P/E (28.19) and P/B (4.76) were unfavorable. Overall, the global assessment was slightly favorable.
Shareholder Return Policy
Copart, Inc. does not pay dividends, reflecting a reinvestment strategy consistent with its high profitability and robust free cash flow generation. The absence of dividend payouts aligns with a focus on growth and potential capital allocation to operational expansion rather than immediate shareholder distributions.
The company does not engage in share buybacks either, maintaining a strong balance sheet with minimal debt and ample liquidity. This approach suggests a conservative capital management policy that supports sustainable long-term shareholder value creation through reinvestment and financial stability rather than direct cash returns.
Score analysis
The following radar chart illustrates Copart, Inc.’s key financial scores across multiple valuation and performance metrics:
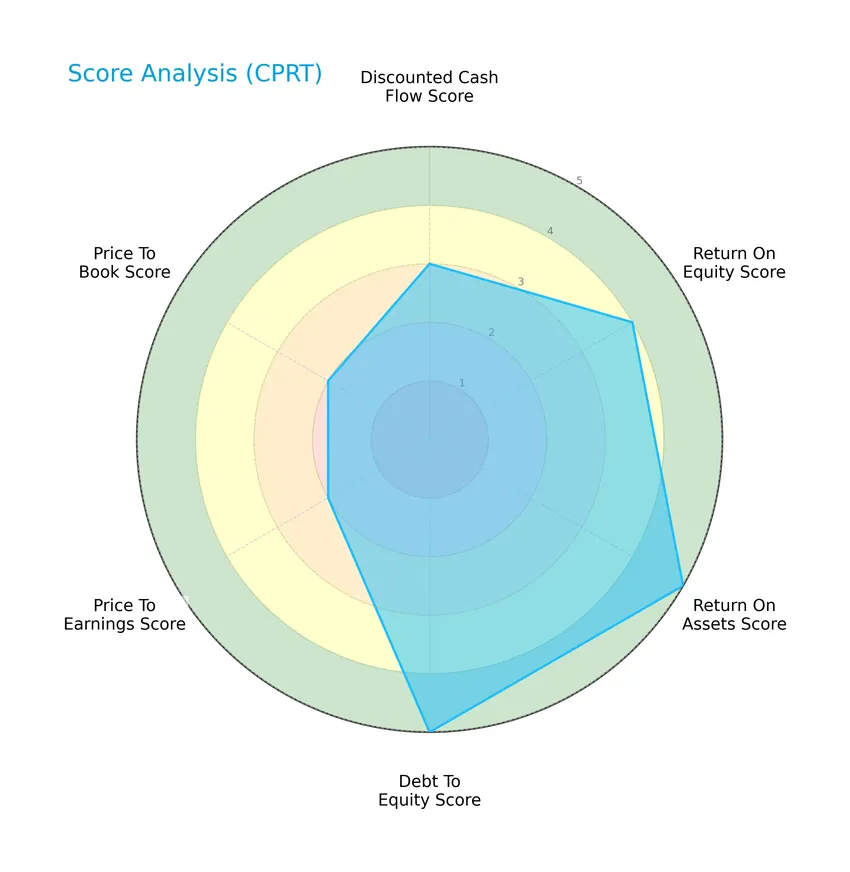
Copart shows very favorable scores in return on assets and debt to equity, indicating operational efficiency and strong balance sheet management. Return on equity is favorable, while discounted cash flow, price to earnings, and price to book scores are moderate, reflecting mixed valuation signals.
Analysis of the company’s bankruptcy risk
Copart’s Altman Z-Score places it well within the safe zone, indicating a very low risk of bankruptcy based on its financial ratios and stability:

Is the company in good financial health?
The Piotroski diagram below highlights Copart’s financial health using nine fundamental criteria:

With a Piotroski Score of 6, Copart is classified as having average financial health, suggesting moderate strength in profitability, leverage, liquidity, and efficiency metrics.
Competitive Landscape & Sector Positioning
This sector analysis will examine Copart, Inc.’s strategic positioning, revenue by segment, key products, main competitors, competitive advantages, and SWOT analysis. I will assess whether Copart holds a competitive advantage over its industry rivals.
Strategic Positioning
Copart, Inc. operates a concentrated portfolio focused on specialty business services, primarily vehicle remarketing and online auctions. Geographically, it has a dominant presence in the United States, generating approximately 3.9B in revenue in 2025, with a growing international segment contributing around 790M, reflecting moderate geographic diversification.
Revenue by Segment
This pie chart illustrates Copart, Inc.’s revenue distribution between Product and Service segments for the fiscal year 2025.
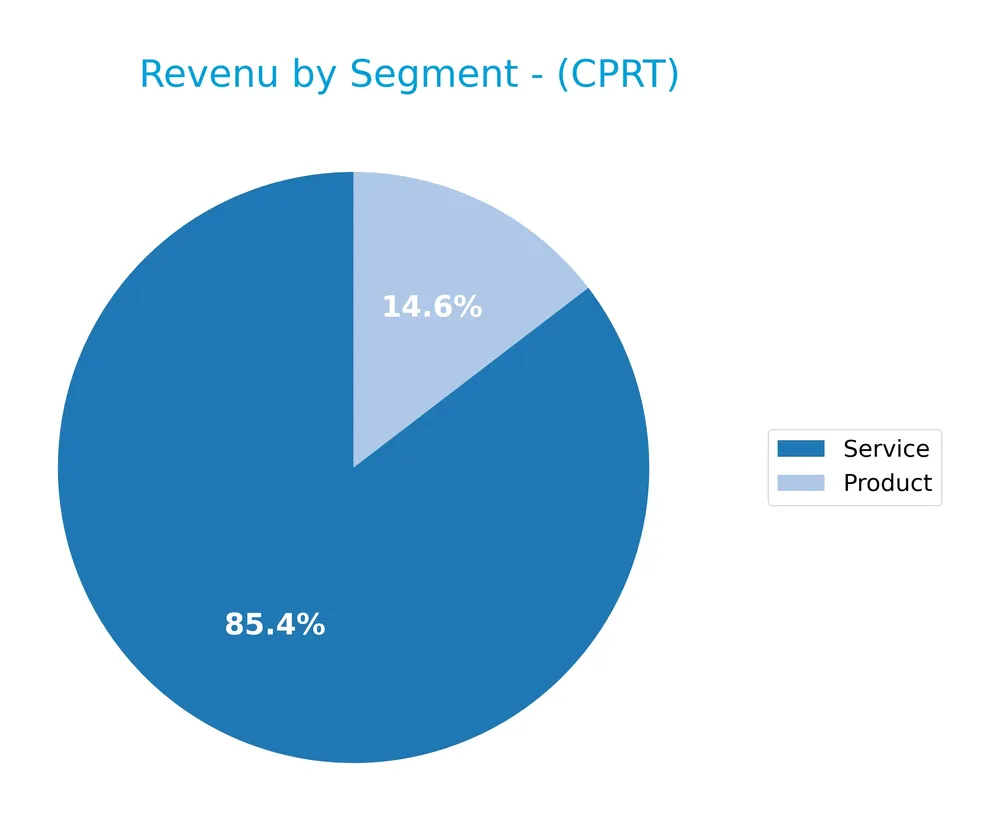
In 2025, the Service segment dominated Copart’s revenue at 3.97B, significantly outpacing the Product segment, which contributed 678M. Over the years, both segments showed steady growth, with Service revenue nearly doubling since 2018 and Product increasing more moderately. The 2025 figures highlight ongoing reliance on Services, signaling concentration risk but also reflecting strong demand and potential resilience in this core area.
Key Products & Brands
Below is a summary table of Copart, Inc.’s key products and brands along with their descriptions:
| Product | Description |
|---|---|
| Online Auctions | Internet auction-style sales technology offering virtual bidding for vehicles globally. |
| Vehicle Remarketing Services | Services including salvage estimation, end-of-life vehicle processing, transportation, inspection, title processing, and flexible vehicle programs. |
| BluCar, CashForCars, Copart Recycling | Platforms for selling vehicles and purchasing parts from salvaged and end-of-life vehicles. |
| Copart 360 | Proprietary technology providing clear 360-degree views of vehicles for better buyer inspection. |
| IntelliSeller | Automated tool using vehicle and sales data to assist sellers in auction decision-making. |
| Purple Wave Inc. | Wholesale auction services for construction, agriculture, and fleet vehicles via no-reserve online auctions. |
| Wholesale Powersport Vehicle Remarketing | Live and online auction platforms for remarketing powersport vehicles. |
Copart’s product and brand portfolio centers on online vehicle auctions and remarketing services, supplemented by technology-driven tools and specialized platforms serving both the public and licensed industry participants.
Main Competitors
There are 3 competitors in total, with the table below listing the top 3 leaders by market capitalization:
| Competitor | Market Cap. |
|---|---|
| Cintas Corporation | 74.5B |
| Thomson Reuters Corporation | 59.4B |
| Global Payments Inc. | 18.5B |
Copart, Inc. is not ranked among these top competitors by market capitalization. Its relative market cap to the leader is 0, indicating it is significantly smaller. The company is positioned below both the average market cap of the top 10 competitors (50.8B) and the median market cap of the sector (59.4B). There is no data on the distance to the next competitor above Copart, highlighting a notable gap in scale.
Comparisons with competitors
Check out how we compare the company to its competitors:
Does CPRT have a competitive advantage?
Copart, Inc. presents a competitive advantage as it is creating value with a ROIC exceeding its WACC by 5.7%, supported by favorable margins and strong revenue growth, despite a declining ROIC trend. The company benefits from its proprietary technologies and extensive online auction platform across multiple international markets, enhancing its position in specialty business services.
Looking ahead, Copart’s future outlook includes expanding its global footprint and leveraging innovative services like copart 360 and IntelliSeller to improve auction efficiency and customer experience. Continued growth opportunities exist in emerging markets and diversification into related vehicle remarketing services, which could support sustained revenue expansion.
SWOT Analysis
This SWOT analysis highlights Copart, Inc.’s key internal and external factors to guide investment decisions.
Strengths
- strong market position in online vehicle auction
- favorable profitability with 33.41% net margin
- robust revenue growth of 9.68% in 2025
Weaknesses
- high price-to-book ratio at 4.76
- limited dividend yield of 0%
- declining ROIC trend signals margin pressure
Opportunities
- expanding international revenue with growing presence
- technology innovation like copart 360 and IntelliSeller
- increasing demand for vehicle remarketing services
Threats
- intense competition in specialty business services
- regulatory changes in automotive and salvage markets
- economic downturns impacting vehicle sales and auctions
Copart demonstrates solid profitability and growth backed by innovative technology and expanding international sales. However, valuation concerns and declining ROIC warrant cautious monitoring. The company should focus on leveraging technology and geographic expansion while managing competitive and regulatory risks.
Stock Price Action Analysis
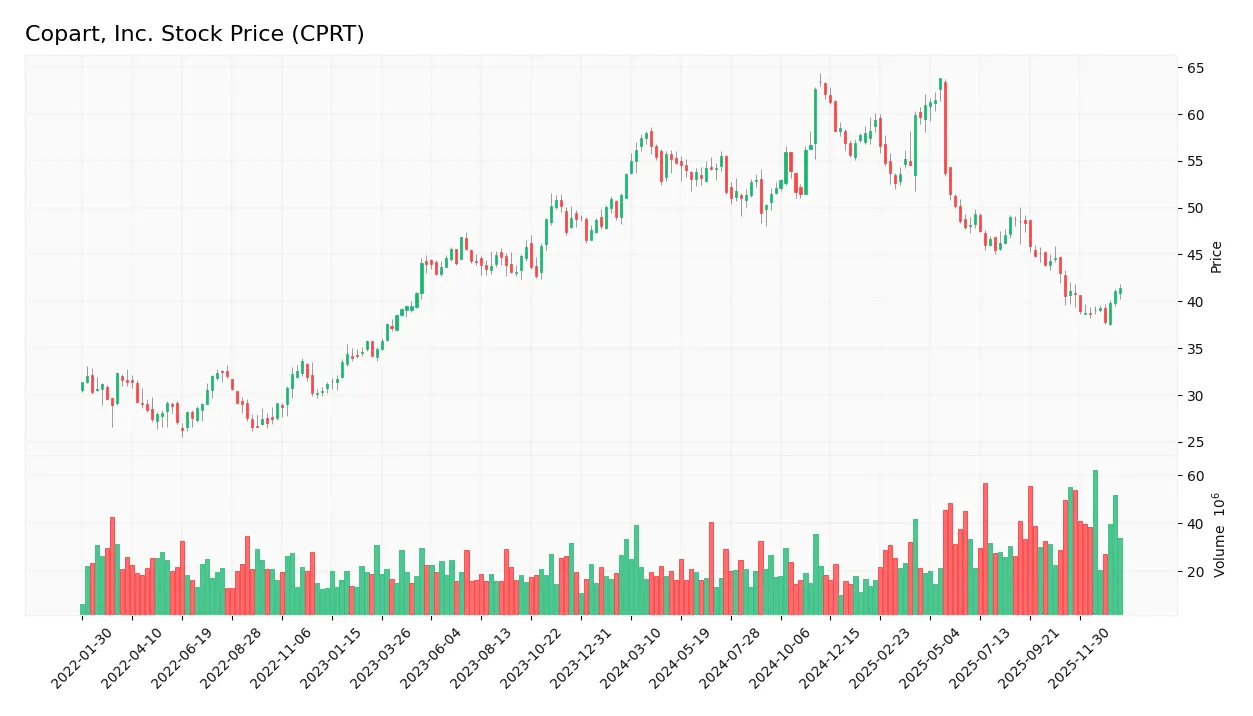
The following weekly stock chart illustrates Copart, Inc.’s price movements over the last 12 months, highlighting key highs, lows, and volatility patterns:
Trend Analysis
Over the past 12 months, Copart’s stock price declined by 22.73%, indicating a bearish trend with acceleration. The price ranged between a high of 63.84 and a low of 37.77, with a standard deviation of 6.37 reflecting notable volatility. In the recent 11-week period, the stock showed a mild 2.2% increase, a neutral trend with low volatility.
Volume Analysis
Trading volume has been increasing overall, totaling 3.12B shares with sellers slightly dominating at 52.29%. However, in the recent 11-week period, buyer volume edged out sellers at 51.35%, signaling neutral buyer behavior. This suggests balanced market participation with no clear directional conviction from investors.
Target Prices
Analysts present a clear target price consensus for Copart, Inc. (CPRT).
| Target High | Target Low | Consensus |
|---|---|---|
| 62 | 33 | 49 |
The target prices indicate analyst expectations for moderate growth, with a consensus around $49, suggesting potential upside from current levels.

Don’t Let Luck Decide Your Entry Point
Optimize your entry points with our advanced ProRealTime indicators. You’ll get efficient buy signals with precise price targets for maximum performance. Start outperforming now!
Analyst & Consumer Opinions
This section examines recent analyst ratings and consumer feedback related to Copart, Inc. (CPRT) to provide insight.
Stock Grades
Here is a summary of recent stock grades for Copart, Inc. from leading financial institutions and analysts:
| Grading Company | Action | New Grade | Date |
|---|---|---|---|
| JP Morgan | Maintain | Neutral | 2025-11-24 |
| Baird | Maintain | Outperform | 2025-11-21 |
| Barclays | Maintain | Underweight | 2025-11-21 |
| Stephens & Co. | Maintain | Equal Weight | 2025-09-05 |
| HSBC | Upgrade | Buy | 2025-09-04 |
| Baird | Maintain | Outperform | 2025-07-17 |
| JP Morgan | Maintain | Neutral | 2025-05-23 |
| Baird | Maintain | Outperform | 2025-02-21 |
| JP Morgan | Maintain | Neutral | 2024-11-19 |
| Baird | Maintain | Outperform | 2024-09-05 |
The overall trend shows a majority of maintain ratings with a notable upgrade by HSBC to Buy in September 2025. Opinions remain mixed, ranging from Underweight to Outperform, reflecting diverse analyst perspectives on Copart’s outlook.
Consumer Opinions
Consumers generally appreciate Copart, Inc. for its efficient auction platform and wide vehicle selection, though some express concerns about customer service responsiveness.
| Positive Reviews | Negative Reviews |
|---|---|
| “Easy-to-use platform with a large inventory.” | “Customer support can be slow to respond.” |
| “Great prices and transparent bidding process.” | “Some vehicles had undisclosed damages.” |
| “Fast transaction and reliable auction system.” | “Shipping logistics were sometimes delayed.” |
Overall, Copart is praised for its user-friendly interface and competitive pricing, while recurring issues relate to customer service delays and occasional vehicle condition discrepancies.
Risk Analysis
Below is a summary table of the key risks associated with investing in Copart, Inc. (CPRT) based on current financial and market conditions:
| Category | Description | Probability | Impact |
|---|---|---|---|
| Market Valuation | Elevated P/E (28.19) and P/B (4.76) ratios suggest potential overvaluation risks. | Medium | High |
| Competitive Risks | Intense competition in online vehicle remarketing could pressure margins and market share. | Medium | Medium |
| Economic Cycles | Cyclical demand for used and salvage vehicles may fluctuate with economic downturns. | High | High |
| Operational Risks | Dependence on technology platforms and international operations may face disruptions. | Medium | Medium |
| Regulatory Risks | Varying automotive and recycling regulations across countries could increase compliance costs. | Medium | Medium |
| Liquidity & Leverage | Strong liquidity but low debt levels; however, an unfavorable current ratio (8.25) signals working capital management concerns. | Low | Low |
The most pressing risks are economic cycle sensitivity and market valuation concerns. Copart’s strong Altman Z-score confirms financial stability, but the high valuation multiples require cautious entry points to mitigate downside risk amid potential market corrections.
Should You Buy Copart, Inc.?
Copart, Inc. appears to be a company with robust profitability and a slightly favorable competitive moat, suggesting ongoing value creation despite a declining ROIC trend. Supported by a very favorable leverage profile and an overall A- rating, the financial health could be seen as stable.
Strength & Efficiency Pillars
Copart, Inc. stands out with robust profitability metrics, including a net margin of 33.41% and a return on equity (ROE) of 16.9%. The company’s return on invested capital (ROIC) at 14.7% comfortably exceeds its weighted average cost of capital (WACC) of 9.03%, confirming Copart as a clear value creator. Financial health is solid, supported by an Altman Z-Score of 27.66, well into the safe zone, and a Piotroski Score of 6, indicating average but stable financial strength. Low leverage is evident with a debt-to-equity ratio of 0.01, reinforcing balance sheet resilience.
Weaknesses and Drawbacks
Copart’s valuation appears stretched, with a price-to-earnings (P/E) ratio of 28.19 and price-to-book (P/B) ratio of 4.76, both flagged as unfavorable and signaling a premium market positioning that may limit upside. The current ratio is unusually high at 8.25, which while generally positive for liquidity, could indicate inefficient asset use or excess short-term assets. Asset turnover is low at 0.46, suggesting the company may not be optimizing asset deployment. Additionally, the stock has experienced significant market pressure, reflected in a 22.73% overall price decline over the analyzed period.
Our Verdict about Copart, Inc.
Copart’s long-term fundamental profile is favorable, buoyed by strong profitability and financial stability, alongside its status as a value creator. However, the bearish overall stock trend combined with recent neutral buyer behavior suggests investors might consider a wait-and-see approach. Despite the company’s intrinsic strengths, the premium valuation and recent market softness may pose short-term headwinds, making timing a critical factor for potential investors.
Disclaimer: This content is for informational purposes only and does not constitute financial, investment, or other professional advice. Investing in financial markets involves a significant risk of loss, and past performance is not indicative of future results.
Additional Resources
- Rakuten Investment Management Inc. Invests $1.91 Million in Copart, Inc. $CPRT – MarketBeat (Jan 24, 2026)
- Here’s what to expect from Copart’s next earnings report – MSN (Jan 22, 2026)
- Copart, Inc. (CPRT) Outperforms Broader Market: What You Need to Know – Yahoo Finance (Jan 05, 2026)
- Copart, Inc.’s (NASDAQ:CPRT) Business Is Trailing The Market But Its Shares Aren’t – simplywall.st (Jan 08, 2026)
- Copart: Why The Salvage King Still Reigns (NASDAQ:CPRT) – Seeking Alpha (Jan 05, 2026)
For more information about Copart, Inc., please visit the official website: copart.com