Home > Analyses > Utilities > Constellation Energy Corporation
Constellation Energy powers millions of homes and businesses with a diverse energy mix, blending nuclear, wind, solar, and natural gas. It commands a leading position in the renewable utilities sector, known for its innovation and large-scale generating capacity. The company’s ability to balance clean energy with reliable supply shapes the future of American power. As I dive into its fundamentals, the key question remains: does Constellation’s valuation reflect its growth potential in an evolving energy landscape?

Table of contents
Business Model & Company Overview
Constellation Energy Corporation, founded in 2021 and headquartered in Baltimore, Maryland, commands a dominant position in the U.S. renewable utilities sector. It operates a diverse portfolio of 32,400 MW capacity, integrating nuclear, wind, solar, natural gas, and hydroelectric assets. This cohesive ecosystem delivers reliable electricity across five regional segments, serving a broad customer base from municipalities to industrial clients. The company leverages its scale and expertise to meet evolving energy demands with a strong emphasis on sustainability.
The company’s revenue engine balances generation from its diverse asset mix with sales of natural gas, renewable energy, and related services. Its strategic footprint spans the Mid-Atlantic, Midwest, New York, ERCOT, and other U.S. power regions, capturing growth across key markets. This multi-channel approach fosters resilient cash flow and competitive pricing. Constellation’s robust infrastructure and integrated service offerings create a formidable economic moat, positioning it to shape the future of energy in America.
Financial Performance & Fundamental Metrics
I analyze Constellation Energy Corporation’s income statement, key financial ratios, and dividend payout policy to assess its profitability and financial health.
Income Statement
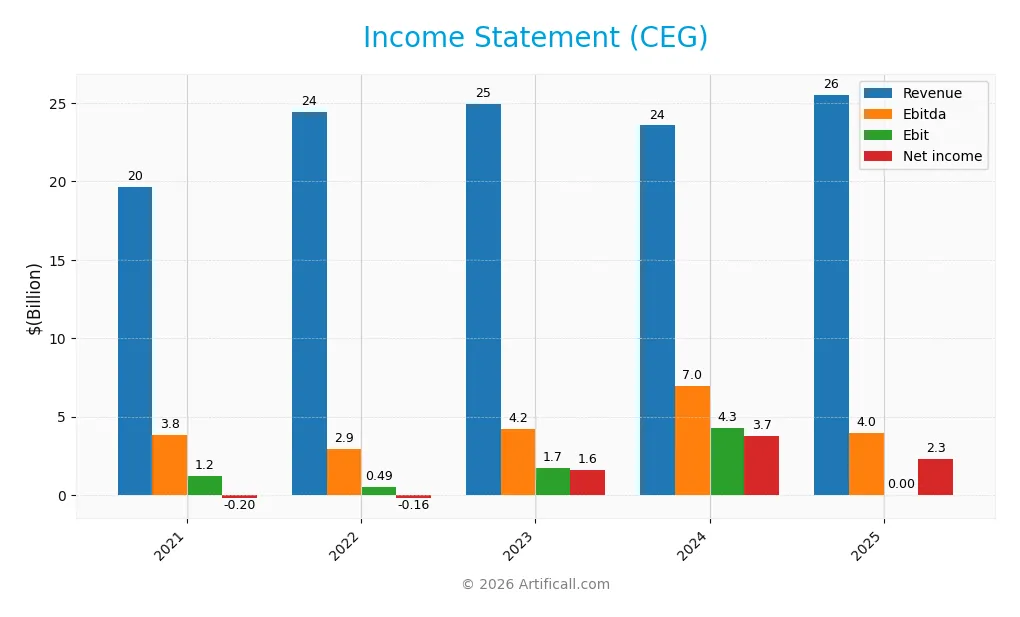
This table summarizes Constellation Energy Corporation’s key income statement items from 2021 to 2025, showing revenue, expenses, profits, and earnings per share.
| 2021 | 2022 | 2023 | 2024 | 2025 | |
|---|---|---|---|---|---|
| Revenue | 19.6B | 24.4B | 24.9B | 23.6B | 25.5B |
| Cost of Revenue | 16.9B | 22.3B | 21.6B | 17.6B | 6.2B |
| Operating Expenses | 3.1B | 1.6B | 1.7B | 1.6B | 22.4B |
| Gross Profit | 2.7B | 2.1B | 3.3B | 6.0B | 19.4B |
| EBITDA | 3.8B | 2.9B | 4.2B | 6.9B | 4.0B |
| EBIT | 1.2B | 0.5B | 1.7B | 4.3B | 0.0B |
| Interest Expense | 297M | 251M | 431M | 506M | 511M |
| Net Income | -205M | -160M | 1.6B | 3.7B | 2.3B |
| EPS | -0.63 | -0.49 | 5.02 | 11.9 | 7.4 |
| Filing Date | 2022-02-25 | 2023-02-16 | 2024-02-27 | 2025-02-18 | 2026-02-24 |
Income Statement Evolution
Constellation Energy’s revenue rose 30% from 2021 to 2025, with a favorable 8.3% increase in 2025 alone. Net income surged over 1200% across the period but declined 43% last year. Gross margin improved significantly, reaching 75.9% in 2025, while net margin stood at 9.1%. However, EBIT margin dropped to zero, signaling operational challenges.
Is the Income Statement Favorable?
In 2025, the company posted $25.5B revenue and $2.3B net income, reflecting a solid gross margin of 75.9%. Interest expense remains low at 2% of revenue, supporting financial stability. Despite zero EBIT margin and a 43% net margin contraction year-over-year, the overall income statement fundamentals are favorable, driven by strong top-line growth and margin expansion.
Financial Ratios
The following table summarizes key financial ratios for Constellation Energy Corporation (CEG) over the last five fiscal years, providing a clear view of profitability, liquidity, leverage, and valuation metrics:
| Ratios | 2021 | 2022 | 2023 | 2024 | 2025 |
|---|---|---|---|---|---|
| Net Margin | -1.0% | -0.7% | 6.5% | 15.9% | 9.1% |
| ROE | -1.8% | -1.5% | 14.9% | 28.5% | 16.0% |
| ROIC | 0.5% | 0.4% | 2.3% | 7.7% | 4.0% |
| P/E | -66.9x | -176.7x | 23.3x | 18.8x | 47.7x |
| P/B | 1.2x | 2.6x | 3.5x | 5.4x | 7.6x |
| Current Ratio | 1.0 | 1.2 | 1.3 | 1.6 | 1.5 |
| Quick Ratio | 0.8 | 1.0 | 1.1 | 1.3 | 1.3 |
| D/E | 0.73 | 0.52 | 0.85 | 0.64 | 0.62 |
| Debt-to-Assets | 17.0% | 12.3% | 18.2% | 15.9% | 15.7% |
| Interest Coverage | -1.2x | 2.0x | 3.7x | 8.6x | -6.0x |
| Asset Turnover | 0.41 | 0.52 | 0.49 | 0.45 | 0.45 |
| Fixed Asset Turnover | 1.0 | 1.2 | 1.1 | 1.1 | 1.1 |
| Dividend Yield | 13.4% | 0.7% | 1.0% | 0.6% | 0.4% |
Evolution of Financial Ratios
Return on Equity (ROE) improved significantly, reaching 15.97% in 2025, indicating enhanced profitability. The Current Ratio increased to 1.53, showing stronger liquidity. Debt-to-Equity Ratio remains stable around 0.62, suggesting consistent leverage levels. Profit margins fluctuated but ended neutral, reflecting moderate operational efficiency.
Are the Financial Ratios Favorable?
In 2025, profitability is mixed: ROE is favorable, but Return on Invested Capital (ROIC) and net margin are less so. Liquidity ratios, including Current and Quick Ratios, are favorable. Leverage metrics like Debt-to-Assets are positive, while Debt-to-Equity is neutral. Market valuation ratios such as P/E and P/B appear unfavorable. Overall, ratios are slightly unfavorable, signaling cautious interpretation.
Shareholder Return Policy
Constellation Energy Corporation maintains a modest dividend payout ratio near 21%, with dividends per share rising from $1.13 in 2024 to $1.55 in 2025. The annual dividend yield remains low at approximately 0.44%, supported by share buybacks, with dividend payments covered by free cash flow and capital expenditures.
This disciplined distribution aligns with sustainable shareholder value, balancing income with reinvestment needs. Free cash flow coverage and moderate leverage suggest the policy supports long-term stability without risking excessive payouts or buybacks.
Score analysis
The radar chart below illustrates Constellation Energy Corporation’s key financial scores across six important metrics:
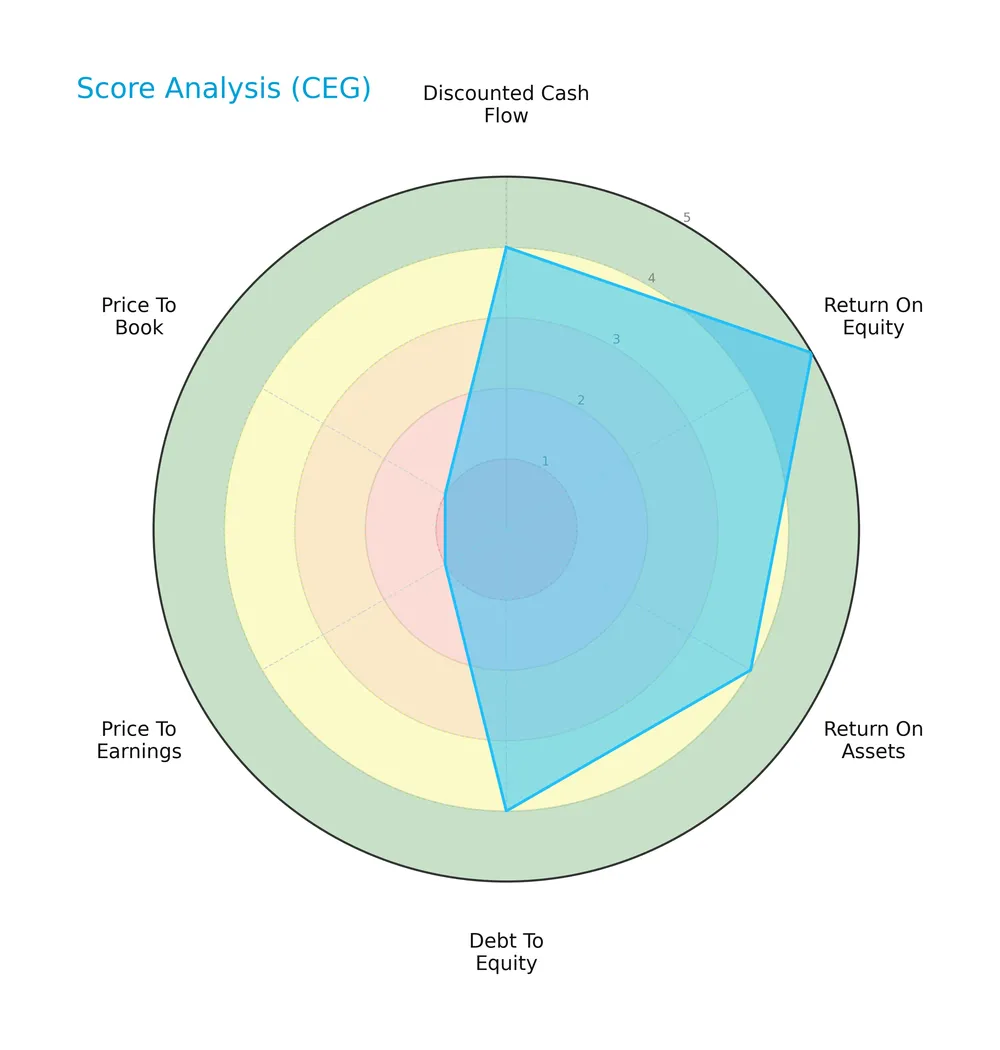
The company scores strongly in return on equity (5) and debt to equity (4), reflecting efficient capital use and moderate leverage. Discounted cash flow (4) and return on assets (4) also show favorable fundamentals. However, valuation metrics price to earnings (1) and price to book (1) are very unfavorable, indicating potential market pricing concerns.
Analysis of the company’s bankruptcy risk
Constellation Energy’s Altman Z-Score places it in the grey zone, signaling a moderate risk of financial distress and bankruptcy:

Is the company in good financial health?
The Piotroski Score diagram highlights a strong financial condition for Constellation Energy Corporation:

A score of 7 suggests the company maintains solid profitability, liquidity, and operational efficiency, positioning it well above weak peers yet shy of the very strongest category.
Competitive Landscape & Sector Positioning
This sector analysis examines Constellation Energy Corporation’s strategic positioning, revenue segments, key products, and main competitors. I will assess whether Constellation Energy holds a competitive advantage in the renewable utilities industry.
Strategic Positioning
Constellation Energy operates a geographically diversified portfolio across Mid-Atlantic, Midwest, New York, ERCOT, and Other Regions. It balances multiple energy sources, including nuclear, wind, solar, gas, and hydroelectric, supporting broad market exposure and reducing reliance on a single segment or region.
Revenue by Segment
This pie chart illustrates Constellation Energy Corporation’s revenue distribution by segment for the fiscal year 2025, highlighting key regional contributions.
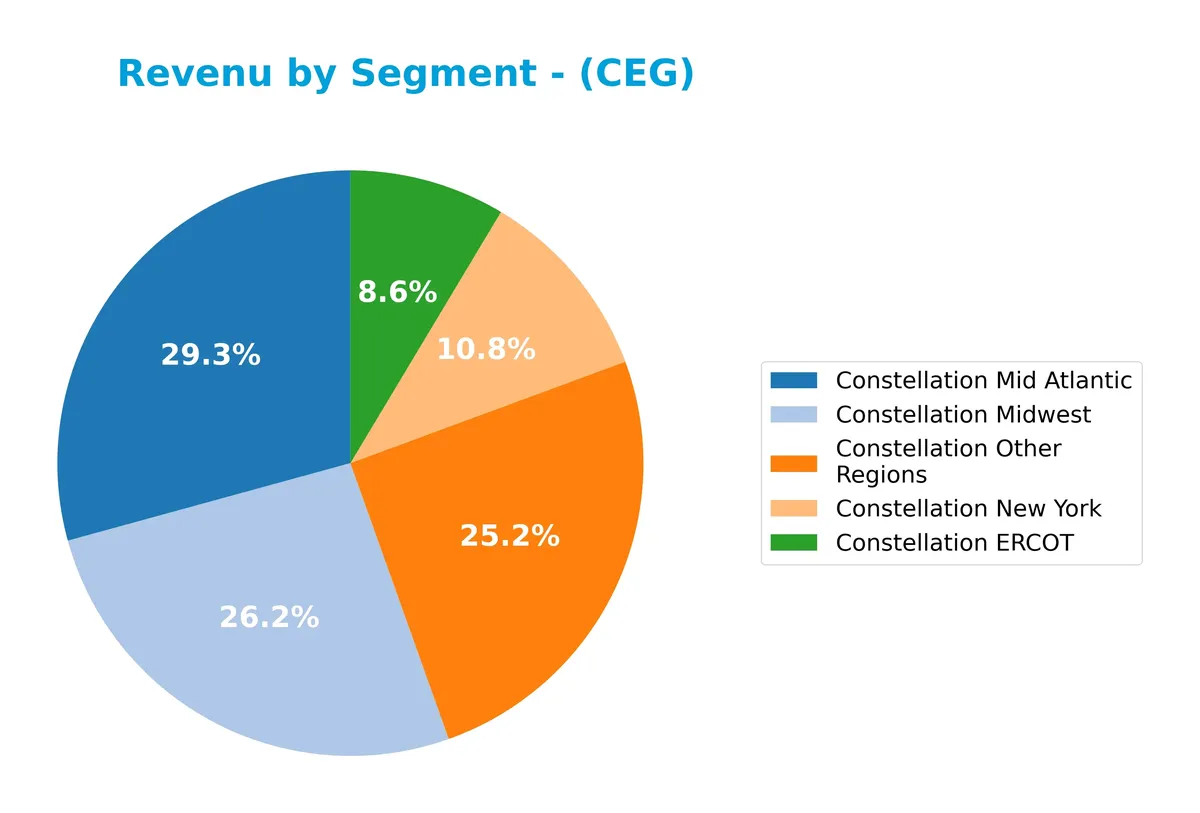
In 2025, the Mid Atlantic region leads revenue with $6.5B, followed by Other Regions at $5.6B and Midwest at $5.8B. ERCOT shows steady growth from $1.35B in 2023 to $1.9B in 2025. New York contributes $2.4B. The firm’s revenue increasingly concentrates in core regions, signaling focused market strength without overreliance on any single segment.
Key Products & Brands
Constellation Energy’s revenue streams span multiple regional energy markets and natural gas sales:
| Product | Description |
|---|---|
| Constellation Mid Atlantic | Electricity generation and sales in Mid-Atlantic states, including nuclear, wind, and solar assets. |
| Constellation Midwest | Power supply and energy services in the Midwest region across various energy sources. |
| Constellation New York | Electricity sales and related services focused on the New York market. |
| Constellation ERCOT | Energy generation and distribution within the Electric Reliability Council of Texas region. |
| Constellation Other Regions | Power generation and sales in additional U.S. regions outside core markets. |
| Constellation Natural Gas | Sales of natural gas and energy-related products across the company’s service areas. |
Constellation Energy’s diverse portfolio covers five regional segments and natural gas sales. Its 32,400 MW capacity includes nuclear, wind, solar, natural gas, and hydro assets, serving utilities, municipalities, and commercial clients.
Main Competitors
There are 3 main competitors in the Renewable Utilities sector; the table lists the top 3 leaders by market capitalization:
| Competitor | Market Cap. |
|---|---|
| GE Vernova Inc. | 184.4B |
| Constellation Energy Corporation | 114.4B |
| NuScale Power Corporation | 4.2B |
Constellation Energy Corporation ranks 2nd among its competitors. Its market cap is 53% of the leader’s, GE Vernova Inc. The company’s valuation sits below both the average market cap of the top 10 peers (101B) and the sector median (114.4B). It holds a significant 89.6% gap above its closest rival, NuScale Power Corporation, demonstrating a clear mid-tier position.
Comparisons with competitors
Check out how we compare the company to its competitors:
Does CEG have a competitive advantage?
Constellation Energy Corporation currently lacks a strong competitive advantage, as its return on invested capital (ROIC) falls below its weighted average cost of capital (WACC), indicating value destruction. However, the company’s ROIC trend shows significant improvement, suggesting increasing profitability despite overall value erosion.
Looking ahead, CEG’s diverse generation capacity of 32,400 MW across nuclear, wind, solar, natural gas, and hydro assets supports expansion opportunities in renewable utilities. Its presence in multiple U.S. regions and growth in revenue segments point to potential market and product development avenues.
SWOT Analysis
This SWOT analysis highlights Constellation Energy Corporation’s core strategic factors shaping its competitive position.
Strengths
- diversified energy mix with nuclear, wind, solar
- strong revenue growth of 30% over 5 years
- favorable net margin of 9.1%
Weaknesses
- ROIC below WACC indicates value destruction
- high PE and PB ratios signal overvaluation
- declining EBIT and EPS growth in last year
Opportunities
- expanding renewable portfolio amid energy transition
- regional revenue growth, especially Mid-Atlantic
- leveraging strong brand in US utility markets
Threats
- regulatory risks in renewable utilities
- commodity price volatility impacts margins
- competitive pressure from alternative energy providers
Constellation shows solid growth and diversification but faces valuation and profitability challenges. The firm must improve capital efficiency and navigate regulatory risks to sustain its competitive edge.
Stock Price Action Analysis
The weekly stock chart of Constellation Energy Corporation (CEG) highlights price movements and key levels over the past year:
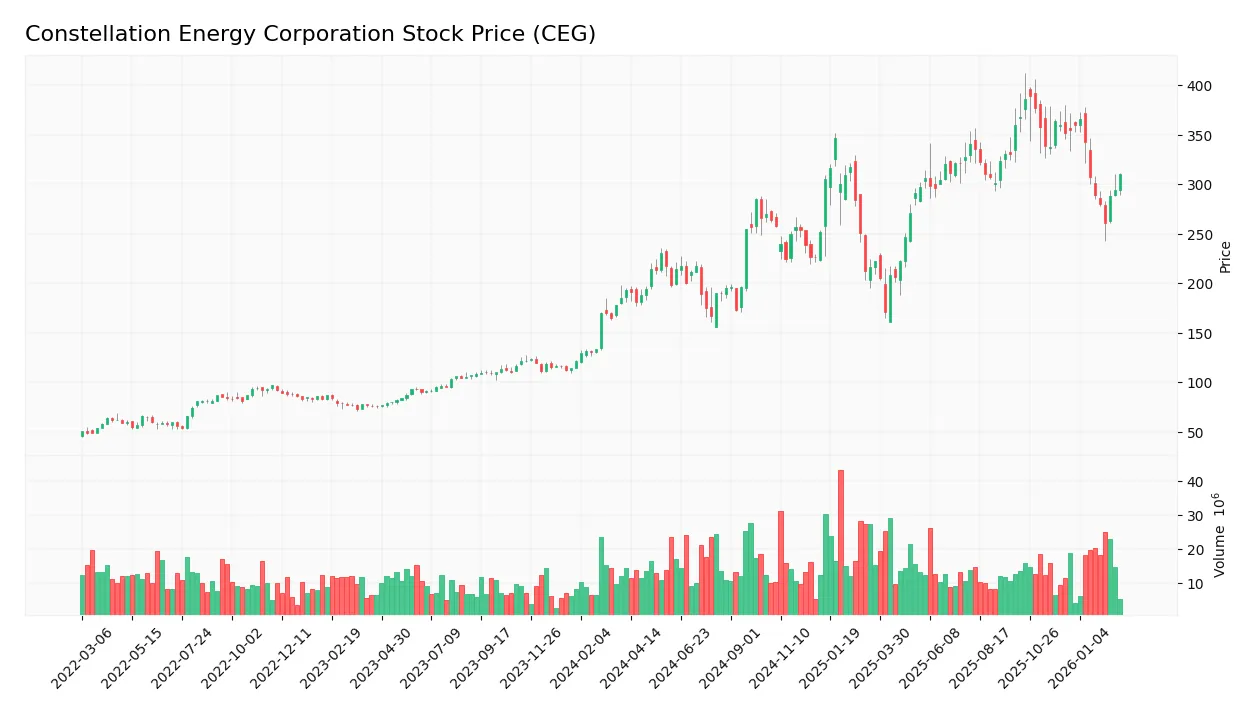
Trend Analysis
Over the past 12 months, CEG’s stock price rose 60.87%, indicating a strong bullish trend with decelerating momentum. The price fluctuated between 167.08 and 389.19, reflecting high volatility (std. dev. 60.32). However, in the recent 2.5-month period ending March 2026, the price declined 11.75%, showing a short-term bearish slope (-7.81).
Volume Analysis
Trading volume increased overall, with buyers accounting for 52.29% of 1.77B shares traded historically, suggesting buyer-driven interest. Conversely, over the last 2.5 months, sellers dominated 61.04% of volume, indicating increased selling pressure and weakening investor confidence.
Target Prices
Analysts set a confident target consensus for Constellation Energy Corporation (CEG).
| Target Low | Target High | Consensus |
|---|---|---|
| 390 | 460 | 416 |
The target range suggests moderate upside potential, reflecting steady confidence in CEG’s energy sector positioning.

Don’t Let Luck Decide Your Entry Point
Optimize your entry points with our advanced ProRealTime indicators. You’ll get efficient buy signals with precise price targets for maximum performance. Start outperforming now!
Analyst & Consumer Opinions
This section examines recent analyst ratings and consumer feedback regarding Constellation Energy Corporation (CEG) performance and perception.
Stock Grades
Here are the latest verified stock grades from leading financial institutions for Constellation Energy Corporation:
| Grading Company | Action | New Grade | Date |
|---|---|---|---|
| Wells Fargo | Maintain | Overweight | 2026-01-20 |
| UBS | Maintain | Buy | 2025-12-17 |
| JP Morgan | Maintain | Overweight | 2025-12-16 |
| Citigroup | Maintain | Neutral | 2025-11-10 |
| Mizuho | Maintain | Neutral | 2025-10-27 |
| JP Morgan | Maintain | Overweight | 2025-10-20 |
| Keybanc | Maintain | Overweight | 2025-10-15 |
| Seaport Global | Upgrade | Buy | 2025-10-08 |
| Jefferies | Maintain | Hold | 2025-09-09 |
| Raymond James | Maintain | Outperform | 2025-08-11 |
The consensus leans clearly toward positive sentiment, with most firms maintaining buy or overweight ratings. Neutral and hold ratings appear less frequently, indicating broad confidence in the stock’s outlook.
Consumer Opinions
Consumers express mixed sentiments about Constellation Energy Corporation. Many praise its reliability and customer service. However, some note concerns about pricing and billing transparency.
| Positive Reviews | Negative Reviews |
|---|---|
| Reliable energy supply with minimal outages | Pricing structure is confusing and costly |
| Responsive and helpful customer service | Billing errors cause frustration |
| Commended for sustainable energy initiatives | Limited digital tools for account management |
Overall, customers appreciate Constellation Energy’s dependable service and commitment to sustainability. Yet, pricing clarity and billing accuracy emerge as consistent pain points that the company must address.
Risk Analysis
Below is a summary table outlining key risks facing Constellation Energy Corporation (CEG), highlighting their likelihood and potential impact:
| Category | Description | Probability | Impact |
|---|---|---|---|
| Market Valuation | Elevated P/E (47.7) and P/B (7.6) ratios imply overvaluation risk. | Medium | High |
| Financial Stability | Altman Z-Score in grey zone (2.23) signals moderate bankruptcy risk. | Medium | Medium |
| Profitability | ROIC (4.0%) below WACC (8.35%) indicates returns may not cover capital cost. | High | High |
| Liquidity | Favorable current (1.53) and quick (1.31) ratios suggest short-term safety. | Low | Low |
| Interest Coverage | Interest coverage near zero signals vulnerability to rising interest rates. | Medium | High |
| Operational Efficiency | Low asset turnover (0.45) points to underutilized assets. | Medium | Medium |
| Dividend Yield | Low yield (0.44%) may disappoint income-focused investors. | Medium | Low |
I see the most pressing risks stem from profitability and valuation metrics. The ROIC lagging behind WACC signals the company struggles to generate economic profit, a red flag in utilities historically valued for steady cash flow and capital efficiency. The stock’s premium valuation multiples raise concerns about sustainability amid macroeconomic shifts. Additionally, the grey zone Altman Z-Score and near-zero interest coverage highlight financial fragility if interest rates rise sharply. Investors should weigh these risks carefully against CEG’s solid liquidity and strong equity returns.
Should You Buy Constellation Energy Corporation?
Constellation Energy appears to offer improving profitability and operational efficiency despite a slightly unfavorable moat indicating value destruction. Supported by a manageable leverage profile and a B+ rating, the company suggests a moderate risk profile within its sector’s competitive landscape.
Strength & Efficiency Pillars
Constellation Energy Corporation displays solid profitability with a net margin of 9.08% and a return on equity of 15.97%, both favorable signals. The company’s ROIC of 4.0% trails its WACC of 8.35%, indicating value destruction despite a strong upward ROIC trend. Operating efficiency remains challenged, but revenue growth of 8.34% over one year and a strong Piotroski score of 7 reflect improving fundamentals and operational resilience.
Weaknesses and Drawbacks
The company resides in the Altman Z-Score grey zone at 2.23, suggesting moderate bankruptcy risk that tempers optimism. Valuation metrics are stretched with a P/E ratio of 47.68 and a P/B of 7.62, signaling premium pricing that may deter value-conscious investors. Recent market dynamics show seller dominance with 38.96% buyer volume, indicating short-term headwinds. Interest coverage is negative, posing financial leverage concerns despite a current ratio of 1.53.
Our Final Verdict about Constellation Energy Corporation
Constellation Energy presents a mixed fundamental profile. Despite improving profitability and a bullish long-term trend, recent seller dominance and elevated valuation ratios suggest caution. The moderate solvency risk inherent in the grey zone Altman Z-Score makes this investment highly speculative. Investors might consider waiting for clearer signs of financial stability and a more favorable entry point before committing capital.
Disclaimer: This content is for informational purposes only and does not constitute financial, investment, or other professional advice. Investing in financial markets involves a significant risk of loss, and past performance is not indicative of future results.
Additional Resources
- Constellation Energy Corporation (CEG) Q4 Earnings and Revenues Beat Estimates – Yahoo Finance (Feb 24, 2026)
- Constellation Energy Corporation Q4 Income Drops – Nasdaq (Feb 24, 2026)
- Constellation Energy Q4 Earnings Surpass Estimates, Revenues Rise Y/Y – The Globe and Mail (Feb 24, 2026)
- Constellation Energy misses Q4 earnings despite revenue beat – Investing.com (Feb 24, 2026)
- AI for investors – MLQ.ai (Feb 24, 2026)
For more information about Constellation Energy Corporation, please visit the official website: constellationenergy.com