Home > Analyses > Consumer Defensive > Constellation Brands, Inc.
Constellation Brands, Inc. transforms everyday moments with its iconic portfolio of beer, wine, and spirits, deeply ingrained in the social fabric across multiple countries. As a powerhouse in the beverage industry, it commands market leadership with renowned brands like Corona and Robert Mondavi, blending innovation with quality to shape consumer preferences. With a solid reputation and steady growth, the key question for investors is whether its current fundamentals still support attractive valuation and future expansion potential.

Table of contents
Business Model & Company Overview
Constellation Brands, Inc., founded in 1945 and headquartered in Victor, New York, stands as a dominant player in the beverages sector, specializing in the production, importation, marketing, and sale of beer, wine, and spirits. Its portfolio forms a cohesive ecosystem featuring iconic beer brands like Corona and Modelo, alongside a diverse range of wines and spirits that cater to varied consumer tastes across multiple markets.
The company’s revenue engine balances strong recurring sales with broad geographic reach, distributing products through wholesale distributors, retailers, and on-premise locations across the United States, Canada, Mexico, New Zealand, and Italy. This global footprint supports a diversified income stream rooted in both hardware-like physical products and brand-driven consumer loyalty. Constellation Brands’ robust market position creates a durable economic moat, shaping the future of the alcoholic beverage industry.
Financial Performance & Fundamental Metrics
This section analyzes Constellation Brands, Inc.’s income statement, key financial ratios, and dividend payout policy to assess its overall financial health and investor appeal.
Income Statement
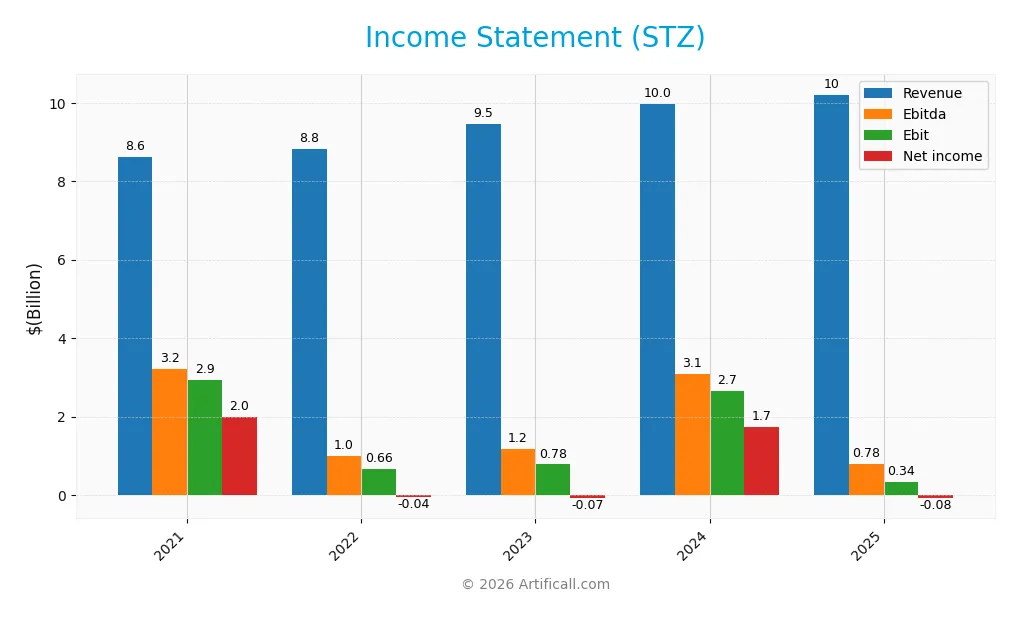
The table below presents Constellation Brands, Inc.’s key income statement figures for the fiscal years 2021 through 2025, expressed in USD.
| 2021 | 2022 | 2023 | 2024 | 2025 | |
|---|---|---|---|---|---|
| Revenue | 8.61B | 8.82B | 9.45B | 9.96B | 10.21B |
| Cost of Revenue | 4.14B | 4.22B | 4.64B | 5.05B | 5.01B |
| Operating Expenses | 1.61B | 1.70B | 1.82B | 1.78B | 1.58B |
| Gross Profit | 4.47B | 4.60B | 4.81B | 4.91B | 5.20B |
| EBITDA | 3.22B | 1.01B | 1.17B | 3.08B | 0.78B |
| EBIT | 2.93B | 0.66B | 0.78B | 2.66B | 0.34B |
| Interest Expense | 0.38B | 0.35B | 0.40B | 0.43B | 0.41B |
| Net Income | 2.00B | -40.4M | -71M | 1.73B | -81.4M |
| EPS | 10.42 | -0.21 | -0.37 | 9.42 | -0.45 |
| Filing Date | 2021-04-20 | 2022-04-21 | 2023-04-20 | 2024-04-23 | 2025-04-23 |
Income Statement Evolution
From 2021 to 2025, Constellation Brands, Inc. saw revenue increase by 18.5% overall, though growth slowed to 2.5% in the last year. Gross profit improved by 5.95% in the most recent year, supporting a favorable gross margin near 51%. However, EBIT declined sharply by 87%, reflecting a neutral EBIT margin around 3.3%. Net income and net margin both turned negative, indicating deteriorating profitability.
Is the Income Statement Favorable?
In 2025, despite stable revenue and improved gross profit, the company reported a net loss of $81M and a negative net margin of -0.8%, an unfavorable shift from prior years. Interest expense remained favorably controlled at 4% of revenue, but EBIT and net income reductions outweighed operational gains. Overall, the fundamentals in 2025 reflect an unfavorable income statement, with earnings and margins under pressure despite solid top-line performance.
Financial Ratios
The following table presents key financial ratios for Constellation Brands, Inc. (STZ) over the fiscal years 2021 to 2025, offering insight into profitability, valuation, liquidity, leverage, and efficiency:
| Ratios | 2021 | 2022 | 2023 | 2024 | 2025 |
|---|---|---|---|---|---|
| Net Margin | 23% | -0.5% | -0.8% | 17% | -0.8% |
| ROE | 15% | -0.3% | -0.8% | 18% | -1.2% |
| ROIC | 9% | 0.04% | -1.3% | 10% | 7% |
| P/E | 21 | -1016 | -607 | 26 | -391 |
| P/B | 3.1 | 3.5 | 5.1 | 4.7 | 4.6 |
| Current Ratio | 2.4 | 1.2 | 1.2 | 1.2 | 0.9 |
| Quick Ratio | 1.4 | 0.7 | 0.5 | 0.5 | 0.6 |
| D/E | 0.81 | 0.93 | 1.54 | 1.29 | 1.76 |
| Debt-to-Assets | 41% | 42% | 53% | 49% | 56% |
| Interest Coverage | 7.5 | 8.2 | 7.5 | 7.2 | 8.8 |
| Asset Turnover | 0.32 | 0.34 | 0.38 | 0.39 | 0.47 |
| Fixed Asset Turnover | 1.37 | 1.35 | 1.38 | 1.15 | 1.28 |
| Dividend Yield | 1.4% | 1.4% | 1.4% | 1.4% | 2.3% |
Evolution of Financial Ratios
From 2021 to 2025, Constellation Brands, Inc. saw Return on Equity (ROE) decline sharply from a positive 14.7% to a negative -1.18%, indicating worsening profitability. The Current Ratio also dropped significantly from 2.4 in 2021 to 0.92 in 2025, reflecting a weakening liquidity position. Meanwhile, the Debt-to-Equity ratio increased steadily, reaching 1.76 in 2025, suggesting higher leverage.
Are the Financial Ratios Fovorable?
In 2025, the company’s profitability ratios, such as net margin (-0.8%) and ROE (-1.18%), are unfavorable, signaling losses. Liquidity ratios, including current (0.92) and quick (0.56), are also unfavorable, showing potential short-term financial stress. Leverage is high with a debt-to-equity ratio of 1.76 and debt-to-assets at 56%, both unfavorable. However, the dividend yield at 2.3% and PE ratio, despite being negative, are marked favorable, resulting in an overall unfavorable financial ratios assessment.
Shareholder Return Policy
Constellation Brands, Inc. maintains a consistent dividend payment with yields around 1.4% to 2.3%, despite recent net losses. Dividend payout ratios show variability and negative values in some years, suggesting distribution not fully supported by net income. The company engages in share buybacks, complementing its shareholder return strategy.
Free cash flow coverage of dividends and capital expenditures remains above 1.4x, indicating coverage by operating cash. However, negative net margins and elevated debt ratios signal caution on sustainability. The current policy balances shareholder returns with financial pressures, leaving long-term value creation dependent on improved profitability.
Score analysis
The radar chart below summarizes key financial scores to provide a snapshot of the company’s valuation and performance metrics:
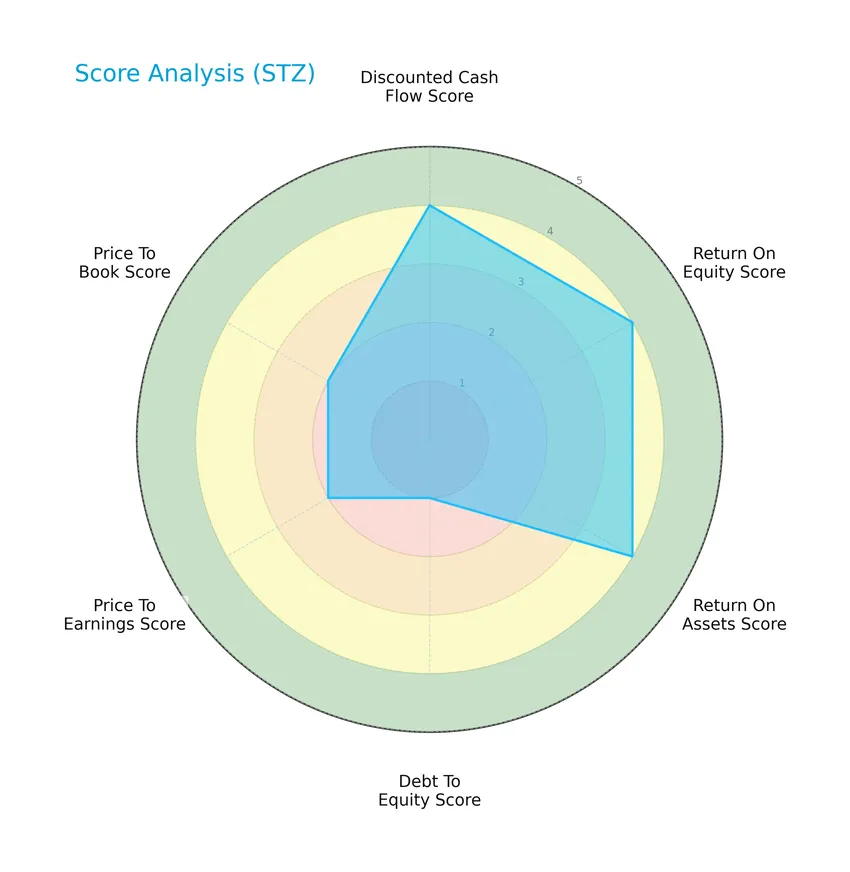
Constellation Brands, Inc. shows favorable scores in discounted cash flow, return on equity, and return on assets, each rated 4. However, its debt-to-equity score is notably low at 1, indicating higher leverage risk. Price-to-earnings and price-to-book scores are moderate at 2.
Analysis of the company’s bankruptcy risk
The Altman Z-Score places the company in the grey zone, suggesting a moderate risk of bankruptcy and financial distress:

Is the company in good financial health?
The Piotroski F-Score diagram illustrates the company’s strong financial condition based on key profitability and efficiency metrics:
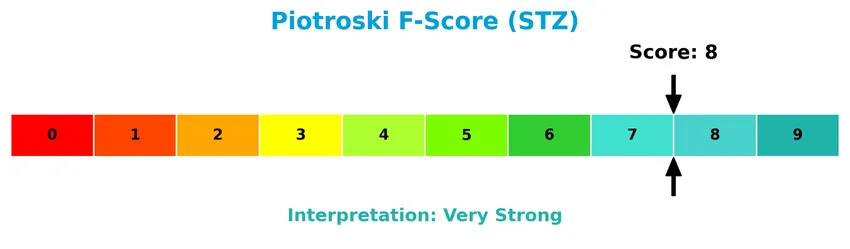
With a Piotroski score of 8, Constellation Brands, Inc. demonstrates very strong financial health, indicating robust fundamentals and operational strength.
Competitive Landscape & Sector Positioning
This sector analysis examines Constellation Brands, Inc.’s strategic positioning, revenue segments, key products, main competitors, and competitive advantages. I will assess whether Constellation Brands holds a competitive advantage within the beverages sector.
Strategic Positioning
Constellation Brands, Inc. focuses on a concentrated portfolio primarily in beer, which generated $8.5B in revenue for FY 2025, supplemented by wines and spirits totaling $1.7B. Geographically, the company is heavily US-centric, with over $10B revenue domestically versus $192M internationally.
Revenue by Segment
This pie chart illustrates Constellation Brands, Inc.’s revenue distribution by segment for the fiscal year 2025, highlighting the relative contributions of Beer and Constellation Wines and Spirits.
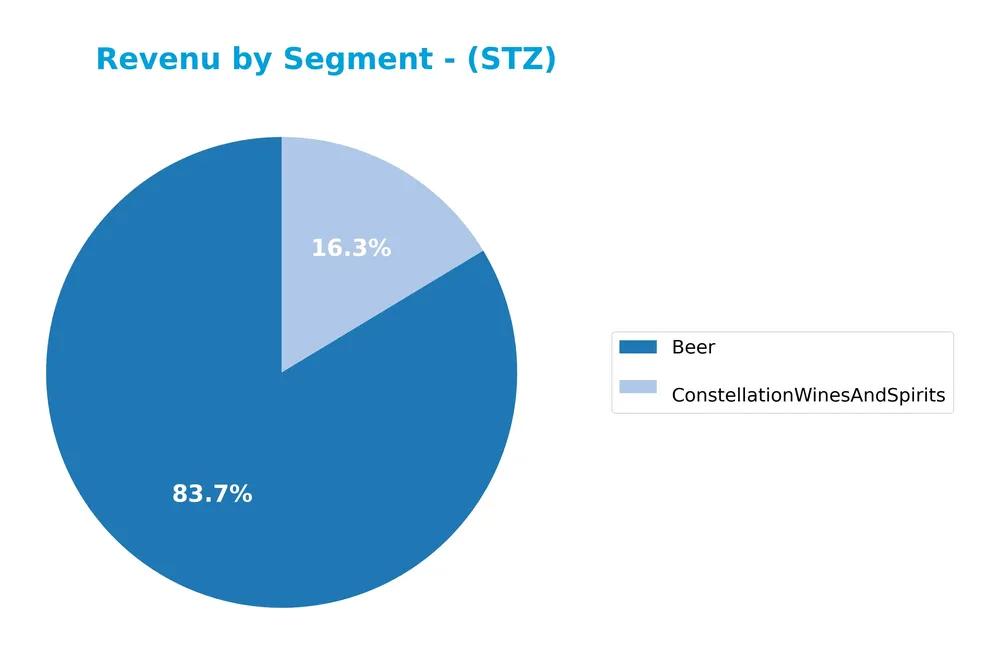
In 2025, Beer remains the dominant segment with $8.5B in revenue, continuing its steady growth over recent years. Constellation Wines and Spirits generated $1.7B, showing a slight decline compared to previous years. The business is primarily driven by the Beer segment, which has expanded consistently, while the Wines and Spirits segment faces a moderate slowdown, indicating some concentration risk in the core beer market.
Key Products & Brands
The table below presents the main products and brands offered by Constellation Brands, Inc.:
| Product | Description |
|---|---|
| Beer | Includes brands such as Corona Extra, Corona Premier, Corona Familiar, Corona Light, Corona Refresca, Corona Hard Seltzer, Modelo Especial, Modelo Negra, Modelo Chelada, Pacifico, and Victoria. |
| Wines | Offers brands including 7 Moons, Cook’s California Champagne, Cooper & Thief, Crafters Union, Kim Crawford, Meiomi, Mount Veeder, Ruffino, SIMI, The Dreaming Tree, Charles Smith, The Prisoner Wine Company, Robert Mondavi, My Favorite Neighbor, and Schrader. |
| Spirits | Comprises brands like Casa Noble, Copper & Kings, High West, Mi CAMPO, Nelson’s Green Brier, and SVEDKA. |
Constellation Brands focuses on a diverse portfolio of beer, wine, and spirits brands distributed across multiple countries, with beer representing the largest segment by revenue in recent fiscal years.
Main Competitors
There are 4 competitors in total, with the table below listing the top 10 leaders by market capitalization:
| Competitor | Market Cap. |
|---|---|
| Diageo plc | 48B |
| Constellation Brands, Inc. | 24.7B |
| Brown-Forman Corporation (BF-A) | 12.4B |
| Brown-Forman Corporation (BF-B) | 12.3B |
Constellation Brands ranks 2nd among its competitors, with a market cap at 57.67% of the leader, Diageo plc. The company is positioned above both the average market cap of the top 10 competitors (24.4B) and the median market cap in its sector (18.6B). It maintains a significant 73.41% gap to the nearest competitor above.
Comparisons with competitors
Check out how we compare the company to its competitors:
Does STZ have a competitive advantage?
Constellation Brands, Inc. demonstrates a slight competitive advantage, indicated by a ROIC exceeding its WACC by about 2.07%, signaling value creation despite a declining ROIC trend. The company benefits from a strong market presence in the U.S. beverage sector, particularly with well-known beer, wine, and spirits brands.
Looking ahead, opportunities for Constellation Brands include expanding its product portfolio and geographic reach, especially in non-U.S. markets, which could help offset recent unfavorable net margin and earnings growth trends. Continued innovation and market penetration remain key to sustaining its competitive position.
SWOT Analysis
This SWOT analysis highlights Constellation Brands, Inc.’s current strategic position to guide investors in evaluating potential risks and growth areas.
Strengths
- strong brand portfolio with Corona and Modelo
- solid US market dominance with $10B revenue
- favorable gross margin at 51%
Weaknesses
- negative net margin at -0.8%
- declining ROIC trend
- high debt levels with debt-to-equity at 1.76
Opportunities
- expansion in non-US markets
- innovation in premium spirits and hard seltzers
- leveraging strong dividend yield of 2.3%
Threats
- intense competition in beverages industry
- regulatory risks in alcohol sales
- currency and geopolitical risks in international markets
Constellation Brands maintains a strong foothold in the US beverage market with premium brands and solid margins but faces profitability pressures and leverage challenges. Strategic focus on international growth and product innovation is essential to offset competitive and regulatory risks.
Stock Price Action Analysis
The following weekly stock chart illustrates Constellation Brands, Inc.’s price movement and volatility over the past 12 months:
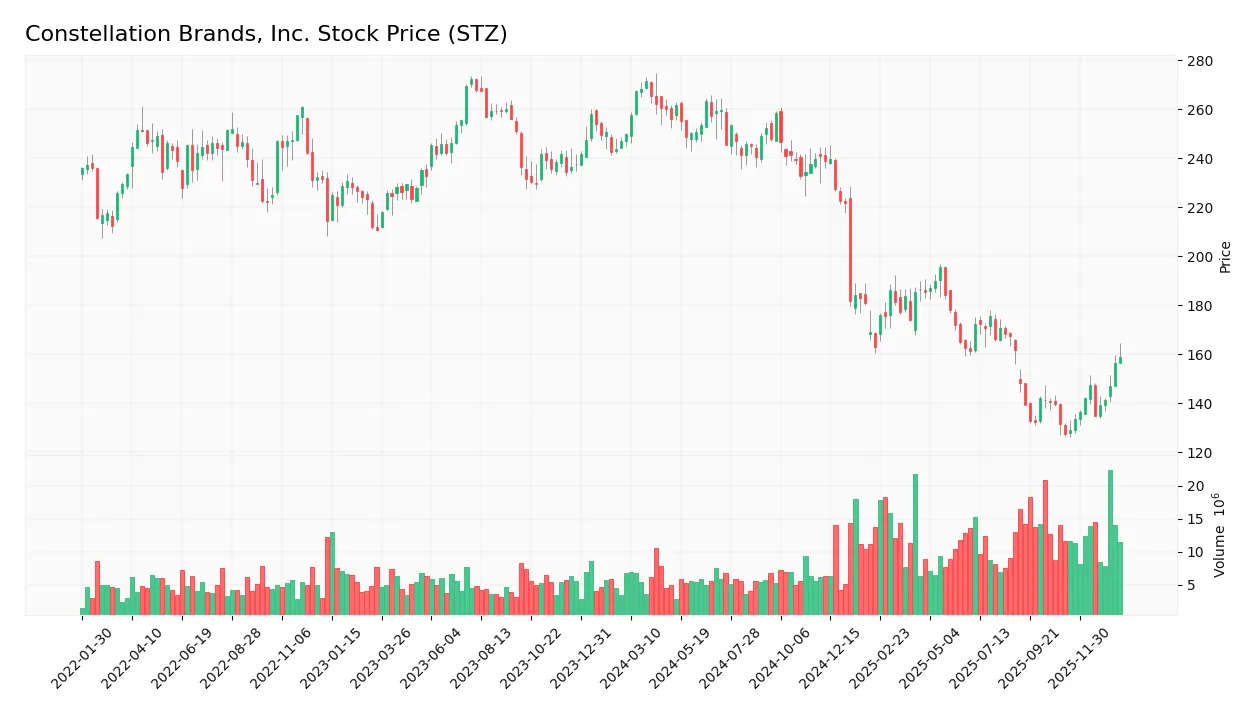
Trend Analysis
Over the past 12 months, the stock price declined by 36.49%, indicating a bearish trend with acceleration. The price ranged between a high of 271.76 and a low of 127.65, with a high volatility reflected by a standard deviation of 46.16. However, from November 2025 to January 2026, the stock showed a 24.39% increase, signaling a short-term recovery.
Volume Analysis
Trading volume has been increasing overall, with sellers dominating 55.58% historically. In the recent period (Nov 2025–Jan 2026), volumes shifted to strongly buyer-driven activity, with buyers accounting for 82.29%. This suggests growing investor interest and bullish participation during the recent price rebound.
Target Prices
Analysts present a clear consensus on Constellation Brands, Inc. target prices.
| Target High | Target Low | Consensus |
|---|---|---|
| 209 | 135 | 172.91 |
The target prices indicate analysts expect the stock to trade between $135 and $209, with a consensus around $173, reflecting moderate bullish sentiment.

Don’t Let Luck Decide Your Entry Point
Optimize your entry points with our advanced ProRealTime indicators. You’ll get efficient buy signals with precise price targets for maximum performance. Start outperforming now!
Analyst & Consumer Opinions
This section examines recent analyst ratings and consumer feedback related to Constellation Brands, Inc. (STZ).
Stock Grades
Here is the summary of the latest verified stock grades for Constellation Brands, Inc. (STZ) from leading financial institutions:
| Grading Company | Action | New Grade | Date |
|---|---|---|---|
| Barclays | Maintain | Equal Weight | 2026-01-12 |
| Citigroup | Maintain | Neutral | 2026-01-09 |
| Bernstein | Maintain | Outperform | 2026-01-09 |
| Needham | Maintain | Buy | 2026-01-09 |
| UBS | Maintain | Buy | 2026-01-09 |
| Needham | Maintain | Buy | 2026-01-08 |
| Wells Fargo | Maintain | Overweight | 2026-01-08 |
| Needham | Maintain | Buy | 2026-01-06 |
| Wells Fargo | Maintain | Overweight | 2026-01-05 |
| Jefferies | Downgrade | Hold | 2025-12-17 |
The overall trend shows a stable outlook with most firms maintaining Buy or comparable positive ratings, although a recent downgrade from Buy to Hold by Jefferies indicates some caution among analysts. The consensus remains a Buy, reflecting balanced confidence in the stock’s potential.
Consumer Opinions
Consumers have expressed a mix of enthusiasm and concern regarding Constellation Brands, reflecting diverse experiences with the company’s products and services.
| Positive Reviews | Negative Reviews |
|---|---|
| High-quality beverage portfolio with great variety | Pricing can be on the higher side compared to competitors |
| Consistent product availability in stores | Some customers report delays in customer service response |
| Innovative new product launches appreciated | Packaging improvements needed for sustainability |
| Strong brand reputation and trusted quality | Limited options in certain regional markets |
Overall, consumer feedback highlights Constellation Brands’ strong product quality and innovation as key strengths, while pricing and customer service remain areas for improvement.
Risk Analysis
Below is a table summarizing the key risks associated with investing in Constellation Brands, Inc., focusing on likelihood and potential impact:
| Category | Description | Probability | Impact |
|---|---|---|---|
| Financial Health | Negative net margin and ROE indicate ongoing profitability challenges. | High | High |
| Leverage & Debt | High debt-to-equity ratio (1.76) and debt to assets (55.95%) increase financial risk. | High | High |
| Liquidity | Current ratio (0.92) and quick ratio (0.56) below 1 suggest liquidity constraints. | Medium | Medium |
| Market Volatility | Beta of 0.444 implies lower sensitivity to market swings but still exposes some volatility. | Low | Medium |
| Valuation Metrics | Unfavorable price-to-book (4.63) signals potential overvaluation risk. | Medium | Medium |
| Bankruptcy Risk | Altman Z-Score in grey zone (2.89) indicates moderate risk of financial distress. | Medium | High |
| Dividend Yield | Dividend yield of 2.3% is favorable but could be at risk if financial conditions worsen. | Low | Medium |
The most significant risks stem from Constellation Brands’ financial health, particularly its negative profitability and high leverage, which are concerning despite favorable weighted average cost of capital and a strong Piotroski score. The grey zone Altman Z-Score signals moderate bankruptcy risk, warranting cautious consideration.
Should You Buy Constellation Brands, Inc.?
Constellation Brands, Inc. appears to be generating value with a slightly favorable competitive moat, despite a declining ROIC trend. While operational efficiency and profitability show mixed signals, the leverage profile suggests substantial risk, reflected in a moderate overall rating of B.
Strength & Efficiency Pillars
Constellation Brands, Inc. exhibits pockets of financial strength amid challenges. The company is a clear value creator, with a return on invested capital (ROIC) of 6.83% comfortably above its weighted average cost of capital (WACC) at 4.76%. The Piotroski score of 8 signals very strong financial health, supported by a moderate Altman Z-score of 2.89 placing it in the grey zone but not in immediate distress. While profitability metrics like net margin (-0.8%) and return on equity (-1.18%) are weak, the firm maintains a favorable dividend yield of 2.3%, reflecting some shareholder value retention.
Weaknesses and Drawbacks
The company faces significant headwinds from several unfavorable metrics. Its debt-to-equity ratio of 1.76 and debt-to-assets at 55.95% indicate high leverage, compounded by a weak interest coverage ratio of 0.82, raising concerns about debt servicing capacity. Liquidity is also strained, with current and quick ratios below 1 (0.92 and 0.56 respectively), signaling potential short-term financial stress. Valuation appears stretched as the price-to-book ratio stands at 4.63, a premium that may weigh on upside potential. The overall bearish stock trend with a -36.49% decline and seller dominance (44.42% buyers) further underscores market pressure.
Our Verdict about Constellation Brands, Inc.
Constellation Brands’ long-term fundamental profile might appear mixed but leans toward unfavorable due to profitability and leverage concerns despite strong financial health signals. While the stock trend has been bearish overall, the recent period shows strong buyer dominance (82.29%) and a price rebound of 24.39%, suggesting improving sentiment. Despite long-term structural challenges, this recent market strength could imply a cautious wait-and-see approach for investors seeking a more favorable entry point.
Disclaimer: This content is for informational purposes only and does not constitute financial, investment, or other professional advice. Investing in financial markets involves a significant risk of loss, and past performance is not indicative of future results.
Additional Resources
- Constellation Brands Inc $STZ Shares Purchased by Y Intercept Hong Kong Ltd – MarketBeat (Jan 24, 2026)
- How Investors May Respond To Constellation Brands (STZ) Earnings Beat Amid Buybacks And Dividend Steadiness – Yahoo Finance (Jan 19, 2026)
- Constellation Brands: Buy This Beer-Maker While It’s Undervalued (NYSE:STZ) – Seeking Alpha (Jan 10, 2026)
- Assessing Constellation Brands (STZ) Valuation After Q3 Results And Capital Returns – Sahm (Jan 21, 2026)
- STZ Stockholders Have Opportunity to Lead Constellation Brands, I – The National Law Review (Jan 21, 2026)
For more information about Constellation Brands, Inc., please visit the official website: cbrands.com