Home > Analyses > Utilities > Consolidated Edison, Inc.
Consolidated Edison powers the heartbeat of New York City, delivering essential energy that fuels millions of homes and businesses daily. As a stalwart in regulated electric, gas, and steam services, it commands a vast infrastructure and a loyal customer base. Renowned for its steady innovation and reliability, Con Ed shapes urban energy landscapes. The pressing question: does its solid foundation still promise compelling growth amid evolving market dynamics?

Table of contents
Business Model & Company Overview
Consolidated Edison, Inc., founded in 1823 and headquartered in New York City, dominates the regulated electric sector. Its ecosystem integrates electric, gas, and steam delivery services, serving millions across New York and New Jersey. This cohesive infrastructure supports a broad customer base, including industrial, commercial, residential, and government clients, anchored by a legacy of operational scale and reliability.
The company’s revenue engine balances regulated electric and gas utilities with renewable energy projects and infrastructure investments. It operates extensive transmission and distribution networks, generating steady cash flows from recurring service fees. With strategic footprints across the Americas, Consolidated Edison leverages its robust asset base and regulatory framework to maintain a durable economic moat, shaping the future of energy delivery.
Financial Performance & Fundamental Metrics
I analyze Consolidated Edison, Inc.’s income statement, key financial ratios, and dividend payout policy to assess its profitability, efficiency, and shareholder returns.
Income Statement
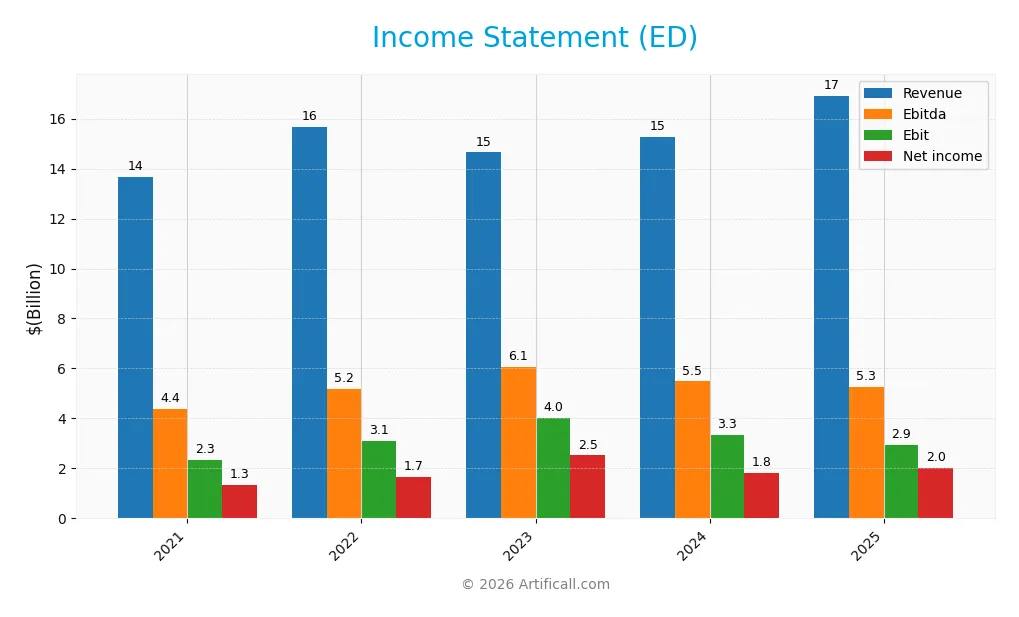
The table below presents Consolidated Edison, Inc.’s key income statement figures for fiscal years 2021 through 2025, highlighting revenue, expenses, and profitability metrics.
| 2021 | 2022 | 2023 | 2024 | 2025 | |
|---|---|---|---|---|---|
| Revenue | 13.7B | 15.7B | 14.6B | 15.3B | 16.9B |
| Cost of Revenue | 4.8B | 6.1B | 5.7B | 5.5B | 10.2B |
| Operating Expenses | 6.1B | 6.9B | 6.6B | 7.0B | 13.9B |
| Gross Profit | 8.9B | 9.6B | 9.0B | 9.8B | 6.7B |
| EBITDA | 4.4B | 5.2B | 6.1B | 5.5B | 5.3B |
| EBIT | 2.3B | 3.1B | 4.0B | 3.3B | 2.9B |
| Interest Expense | 919M | 951M | 1.0B | 1.2B | 1.2B |
| Net Income | 1.3B | 1.7B | 2.5B | 1.8B | 2.0B |
| EPS | 3.86 | 4.68 | 7.24 | 5.26 | 5.66 |
| Filing Date | 2022-02-17 | 2023-02-16 | 2024-02-15 | 2025-02-20 | 2026-02-19 |
Income Statement Evolution
From 2021 to 2025, Consolidated Edison’s revenue rose 24% to $16.9B, reflecting steady top-line growth. Net income advanced 50% to $2.0B, driven by margin improvements. Gross margin declined sharply in the last year, signaling cost pressures, while EBIT margin contracted. However, net margin expanded overall, showing resilient profitability despite margin fluctuations.
Is the Income Statement Favorable?
The 2025 income statement reveals mixed dynamics. Revenue grew 11%, but gross profit fell 31.5%, indicating rising cost of revenue outpacing sales. Operating expenses grew proportionally, squeezing EBIT down 12%. Still, net margin held steady near 12%, supported by controlled interest expense and tax costs. Overall, fundamentals remain favorable, reflecting growth with manageable margin headwinds.
Financial Ratios
The following table presents key financial ratios for Consolidated Edison, Inc. over the last five fiscal years, reflecting profitability, leverage, liquidity, valuation, and operational efficiency:
| Ratios | 2021 | 2022 | 2023 | 2024 | 2025 |
|---|---|---|---|---|---|
| Net Margin | 9.8% | 10.6% | 17.2% | 11.9% | 12.0% |
| ROE | 6.7% | 8.0% | 11.9% | 8.3% | 8.4% |
| ROIC | 4.0% | 3.2% | 3.1% | 3.5% | 9.3% |
| P/E | 22.1 | 20.4 | 12.6 | 17.0 | 17.5 |
| P/B | 1.48 | 1.63 | 1.49 | 1.41 | 1.47 |
| Current Ratio | 1.02 | 1.14 | 1.01 | 1.04 | 0.22 |
| Quick Ratio | 0.94 | 1.10 | 0.94 | 0.96 | 0.22 |
| D/E | 1.27 | 1.18 | 1.18 | 1.27 | 0.01 |
| Debt-to-Assets | 40.2% | 35.4% | 37.7% | 39.4% | 1.3% |
| Interest Coverage | 3.05 | 2.75 | 2.26 | 2.30 | 2.38 |
| Asset Turnover | 0.22 | 0.23 | 0.22 | 0.22 | 0.69 |
| Fixed Asset Turnover | 0.28 | 0.33 | 0.29 | 0.29 | 0.00 |
| Dividend Yield | 3.47% | 3.22% | 3.47% | 3.56% | 3.28% |
Evolution of Financial Ratios
Return on Equity (ROE) showed modest improvement, stabilizing around 8.4% in 2025 after fluctuations. The Current Ratio declined sharply to 0.22, indicating weaker liquidity. Debt-to-Equity Ratio dropped to a low 0.01, signaling conservative leverage. Profitability margins remained stable, with net margin steady near 12%, reflecting consistent bottom-line performance.
Are the Financial Ratios Fovorable?
Profitability is favorable, with a net margin of 11.96% and a dividend yield of 3.28%. However, ROE at 8.36% is unfavorable compared to sector averages. Liquidity ratios, including current and quick ratios at 0.22, raise red flags. Leverage is low and favorable, with debt-to-equity at 0.01 and debt-to-assets at 1.28%. Overall, ratios present a slightly favorable profile with mixed signals on financial health.
Shareholder Return Policy
Consolidated Edison, Inc. maintains a consistent dividend policy with a payout ratio near 58% in 2025 and a dividend yield around 3.3%. The dividend per share has trended slightly upward, supported by moderate free cash flow coverage and ongoing share buybacks.
While the dividend payout is substantial, coverage by free cash flow is tight, posing a risk if cash generation weakens. The policy balances income distribution with capital expenditures, suggesting a focus on sustainable long-term value creation for shareholders.
Score analysis
Here is a radar chart summarizing the company’s valuation and financial performance scores:
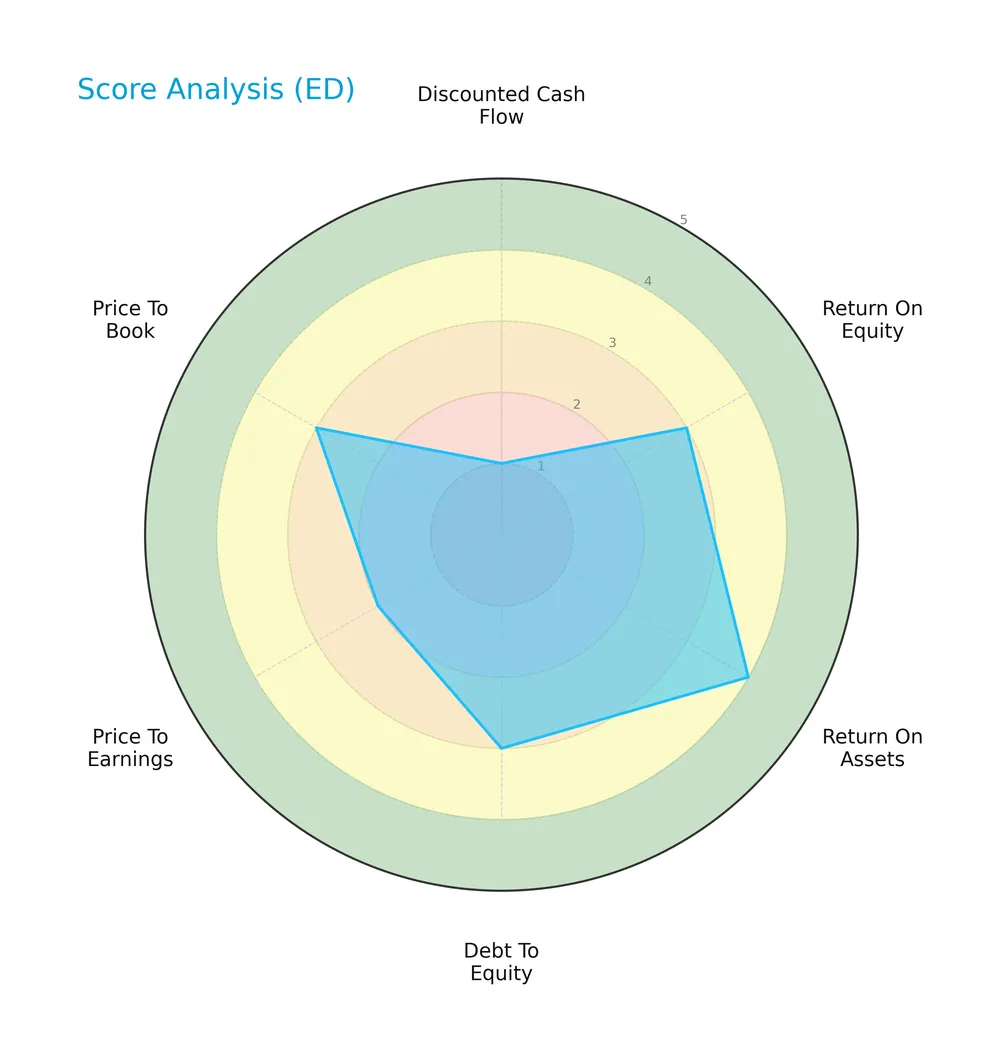
Consolidated Edison scores very low on discounted cash flow, indicating valuation concerns. Return on assets stands out as favorable, while return on equity, debt to equity, and price to book show moderate strength. Price to earnings remains unfavorable.
Analysis of the company’s bankruptcy risk
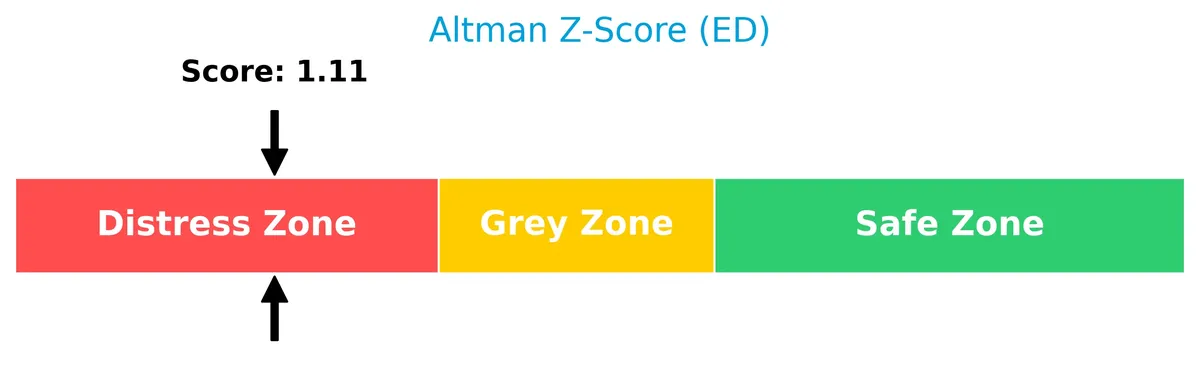
The Altman Z-Score places the company in the distress zone, signaling significant financial distress and a higher bankruptcy risk:
Is the company in good financial health?
The Piotroski Score diagram illustrates the company’s financial health based on nine criteria:

With a Piotroski Score of 5, the company shows average financial strength, reflecting mixed signals in profitability, leverage, and liquidity metrics.
Competitive Landscape & Sector Positioning
This section examines Consolidated Edison, Inc.’s strategic positioning, revenue segments, key products, and main competitors. I will assess whether the company holds a competitive advantage within the regulated electric utilities sector.
Strategic Positioning
Consolidated Edison, Inc. concentrates on regulated electric, gas, and steam delivery in New York and nearby areas. Electricity dominates revenue at $12.6B in 2025, with oil and gas purchased at $3.6B and steam at $703M. The company maintains a focused regional footprint with diversified energy services.
Revenue by Segment
This pie chart illustrates Consolidated Edison, Inc.’s revenue distribution by segment for fiscal year 2025, highlighting the relative contribution of each business unit.
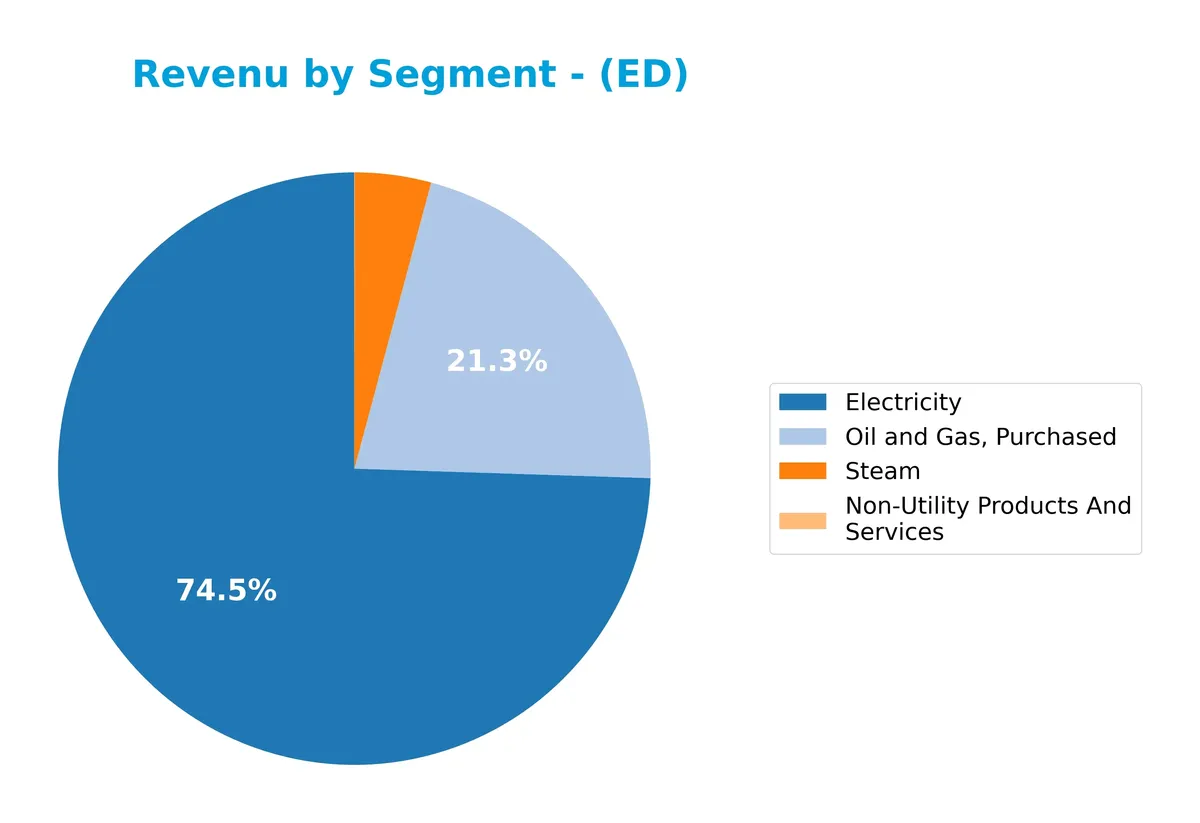
Electricity dominates with $12.6B in revenue, showing consistent growth since 2011. Oil and Gas, Purchased contributes $3.6B, reflecting moderate volatility but overall expansion. Steam remains a smaller but stable segment at $703M. Non-Utility Products and Services revenue has diminished to $3M, signaling a strategic shift away from this area. The 2025 data reveal a concentrated reliance on Electricity and Oil and Gas segments, increasing concentration risk despite robust top-line growth.
Key Products & Brands
The table below outlines Consolidated Edison, Inc.’s key products and services along with their descriptions:
| Product | Description |
|---|---|
| Electricity | Regulated electric delivery to 3.5M customers in New York City, Westchester, and parts of southeastern NY. |
| Gas | Regulated gas delivery to 1.1M customers in Manhattan, Bronx, Queens, Westchester, and southeastern NY areas. |
| Steam | Steam service to approximately 1,555 customers in parts of Manhattan. |
| Oil and Gas, Purchased | Purchased oil and gas supplies supporting energy infrastructure and distribution operations. |
| Non-Utility Products And Services | Energy-related products and services sold to wholesale and retail customers beyond core utility offerings. |
Consolidated Edison’s product mix centers on regulated electricity and gas distribution, supported by steam services and purchased oil and gas. Non-utility offerings contribute a small but diverse revenue stream, reflecting the company’s strategic energy infrastructure investments.
Main Competitors
There are 23 competitors in the Regulated Electric industry; the table lists the top 10 leaders by market capitalization:
| Competitor | Market Cap. |
|---|---|
| NextEra Energy, Inc. | 169B |
| The Southern Company | 96B |
| Duke Energy Corporation | 91B |
| American Electric Power Company, Inc. | 62B |
| Dominion Energy, Inc. | 51B |
| Exelon Corporation | 44B |
| Xcel Energy Inc. | 44B |
| Entergy Corporation | 42B |
| Public Service Enterprise Group Incorporated | 40B |
| Consolidated Edison, Inc. | 36B |
Consolidated Edison ranks 10th among 23 competitors, holding 23.5% of the top player’s market cap. It falls below the 67.5B average of the top 10 but remains above the 34B median for the sector. The company is closely trailing its nearest rival by 1.99%, indicating a tight competition for the ninth position.
Comparisons with competitors
Check out how we compare the company to its competitors:
Does Consolidated Edison have a competitive advantage?
Consolidated Edison does not yet demonstrate a clear competitive advantage, as its ROIC remains below WACC, indicating value is being shed. However, the company maintains favorable profitability metrics and revenue growth, supporting operational strength.
Looking ahead, Consolidated Edison’s expanding renewable and energy infrastructure projects present growth opportunities. Its established customer base in New York and surrounding regions positions it well for steady demand and potential market expansion.
SWOT Analysis
This analysis highlights Consolidated Edison, Inc.’s core strengths, weaknesses, opportunities, and threats to inform strategic decisions.
Strengths
- Stable regulated utility operations
- Strong dividend yield of 3.28%
- Low debt-to-equity ratio at 0.01
Weaknesses
- Low liquidity with current ratio at 0.22
- ROE below industry benchmarks at 8.36%
- Declining gross profit growth (-31.5%)
Opportunities
- Expansion in renewable and energy infrastructure projects
- Increasing demand for clean energy in New York region
- Potential to improve operational efficiency and ROIC
Threats
- Regulatory risks in utility sector
- Rising operational expenses impacting margins
- Economic downturn affecting customer demand
Consolidated Edison’s solid regulated presence and dividend appeal are offset by liquidity concerns and margin pressures. The company must leverage renewable investments while managing regulatory and cost risks to sustain growth.
Stock Price Action Analysis
The weekly stock chart of Consolidated Edison, Inc. (ED) reveals a clear price appreciation pattern over the past year:
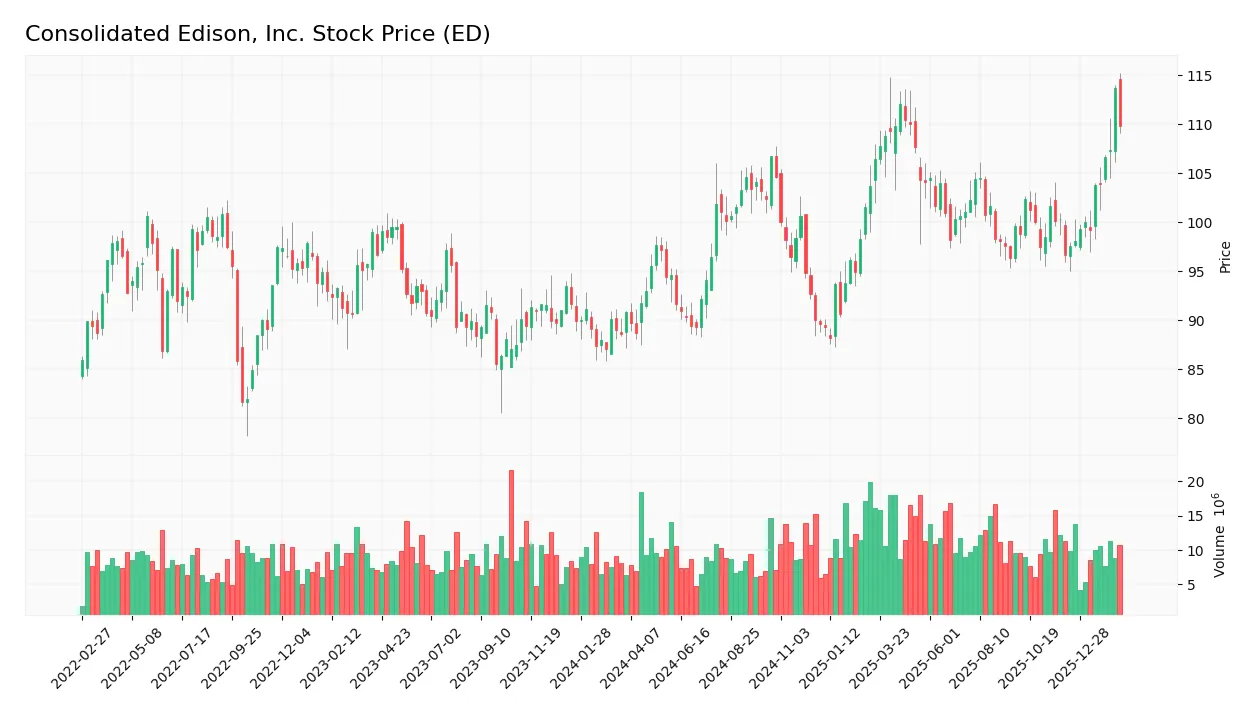
Trend Analysis
Over the past 12 months, ED’s stock price increased by 20.92%, indicating a bullish trend. The price accelerated, reaching a high of 113.72 and a low of 88.15. The standard deviation of 5.85 suggests moderate volatility throughout this period.
Volume Analysis
Trading volume has been increasing, with buyers accounting for 51.79% of total activity over the year. In the recent three months, buyer dominance surged to 72.74%, reflecting strong buyer-driven momentum and heightened investor confidence in the stock.
Target Prices
Analysts show a balanced outlook with a moderate upside potential for Consolidated Edison, Inc.
| Target Low | Target High | Consensus |
|---|---|---|
| 86 | 166 | 112.75 |
The target range reflects cautious optimism, with a consensus price suggesting a modest growth expectation relative to current levels.

Don’t Let Luck Decide Your Entry Point
Optimize your entry points with our advanced ProRealTime indicators. You’ll get efficient buy signals with precise price targets for maximum performance. Start outperforming now!
Analyst & Consumer Opinions
This section reviews recent analyst ratings and consumer feedback on Consolidated Edison, Inc. to gauge market sentiment.
Stock Grades
Here are the latest verified stock grades for Consolidated Edison, Inc., reflecting analysts’ current views:
| Grading Company | Action | New Grade | Date |
|---|---|---|---|
| Scotiabank | Maintain | Sector Perform | 2026-02-20 |
| UBS | Maintain | Neutral | 2026-01-23 |
| Barclays | Maintain | Underweight | 2026-01-22 |
| Wells Fargo | Maintain | Equal Weight | 2026-01-20 |
| UBS | Maintain | Neutral | 2026-01-07 |
| UBS | Maintain | Neutral | 2025-12-17 |
| Keybanc | Maintain | Underweight | 2025-12-12 |
| JP Morgan | Maintain | Underweight | 2025-12-12 |
| Barclays | Maintain | Underweight | 2025-11-10 |
| Barclays | Maintain | Underweight | 2025-10-22 |
The consensus grades indicate a predominance of hold and underweight ratings, with no upgrades to buy or strong buy. Analysts maintain a cautious stance on the stock amid mixed sector outlooks.
Consumer Opinions
Consolidated Edison, Inc. garners mixed reactions from consumers, reflecting both reliable service and areas needing improvement.
| Positive Reviews | Negative Reviews |
|---|---|
| Consistent energy supply with minimal outages | Customer service response times are slow |
| Transparent billing and detailed statements | High energy rates compared to competitors |
| Strong community involvement and sustainability efforts | Occasional billing errors causing confusion |
Consumers appreciate Con Ed’s reliability and transparency but often criticize pricing and customer support delays. The company’s commitment to sustainability stands out, yet rate concerns remain a persistent issue.
Risk Analysis
The table below summarizes key risks facing Consolidated Edison, Inc., including their likelihood and potential impact:
| Category | Description | Probability | Impact |
|---|---|---|---|
| Financial Health | Altman Z-Score at 1.11 signals high bankruptcy risk; liquidity ratios weak. | High | High |
| Regulatory | Utility sector faces evolving environmental regulations increasing costs. | Medium | Medium |
| Operational | Aging infrastructure requires significant capital, risking outages. | Medium | High |
| Market | Low beta (0.38) limits stock volatility but may reduce upside in bull markets. | Low | Low |
| Dividend Safety | Dividend yield at 3.28% is attractive but depends on stable cash flow. | Medium | Medium |
The most pressing risk is financial distress indicated by a low Altman Z-Score and unfavorable liquidity ratios (current and quick ratios at 0.22). This weak liquidity exposes the company to short-term funding challenges. Additionally, regulatory pressures and capital-intensive infrastructure needs could strain margins further. Investors must weigh these risks against the stable, regulated utility business model.
Should You Buy Consolidated Edison, Inc.?
Consolidated Edison’s profile appears to be characterized by improving profitability and a slightly favorable moat with growing ROIC, despite shedding value relative to WACC. Its leverage profile seems manageable, though Altman Z-Score suggests financial distress. Overall, it could be seen as a moderate B-rated investment.
Strength & Efficiency Pillars
Consolidated Edison, Inc. maintains a solid operational profile with a net margin of 11.96% and a favorable gross margin of 39.53%. While its ROIC stands at 9.33%, slightly above the WACC of 8.01%, the company marginally qualifies as a value creator. I observe moderate return on equity at 8.36%, signaling room for improvement. These figures underscore resilient profitability amid a challenging sector landscape, though the company’s capital efficiency gains are still evolving.
Weaknesses and Drawbacks
The Altman Z-Score of 1.11 places Consolidated Edison firmly in the distress zone, signaling high bankruptcy risk despite operational margins. This solvency warning overshadows other metrics. Additionally, liquidity concerns arise with a critically low current ratio of 0.22, raising short-term funding red flags. The price-to-earnings ratio of 17.55 is neutral but, combined with leverage and weak quick ratio, suggests limited margin for financial stress. Investors must weigh these solvency issues heavily against the company’s earnings profile.
Our Final Verdict about Consolidated Edison, Inc.
Despite decent profitability and a bullish stock trend, the company’s Altman Z-Score in the distress zone makes its investment profile highly speculative. This solvency risk dominates the outlook, making Consolidated Edison too risky for conservative capital allocation. Margins and growth could appear attractive, yet financial distress overrides these positives, requiring caution until balance sheet health improves.
Disclaimer: This content is for informational purposes only and does not constitute financial, investment, or other professional advice. Investing in financial markets involves a significant risk of loss, and past performance is not indicative of future results.
Additional Resources
- Consolidated Edison (ED) Q4 Earnings and Revenues Top Estimates – Yahoo Finance (Feb 19, 2026)
- Consolidated Edison Inc. Q4 Profit Drops – Nasdaq (Feb 19, 2026)
- ED: Scotiabank Raises Price Target for Consolidated Edison | ED Stock News – GuruFocus (Feb 20, 2026)
- Consolidated Edison Q4 Earnings Beat Estimates, Revenues Rise Y/Y – The Globe and Mail (Feb 20, 2026)
- Con Ed: Q4 Earnings Snapshot – kens5.com (Feb 19, 2026)
For more information about Consolidated Edison, Inc., please visit the official website: conedison.com