Home > Analyses > Energy > ConocoPhillips
ConocoPhillips fuels the global economy by extracting and delivering essential energy resources. It commands a diverse portfolio spanning conventional oil, shale gas, LNG, and oil sands, making it a powerhouse in oil and gas exploration and production. Known for operational excellence and innovation, it influences energy markets worldwide. As energy transitions reshape demand, I ask: does ConocoPhillips’ financial strength and strategic positioning justify its current valuation and growth outlook?

Table of contents
Business Model & Company Overview
ConocoPhillips, founded in 1917 and headquartered in Houston, Texas, dominates the global oil & gas exploration and production sector. It integrates a vast ecosystem spanning crude oil, natural gas, LNG, and bitumen extraction. This broad portfolio includes conventional and unconventional assets across North America, Europe, Asia, and Australia, reinforcing its status as a cornerstone in energy supply.
The company’s revenue engine balances production from tight oil, shale gas, and oil sands with strategic LNG developments. Its global footprint leverages diverse regional markets to optimize output and resilience. ConocoPhillips’ enduring competitive advantage stems from its extensive asset base and operational scale, shaping the future of energy through innovation and resource stewardship.
Financial Performance & Fundamental Metrics
I will analyze ConocoPhillips’ income statement, key financial ratios, and dividend payout policy to assess its underlying financial health and shareholder value creation.
Income Statement
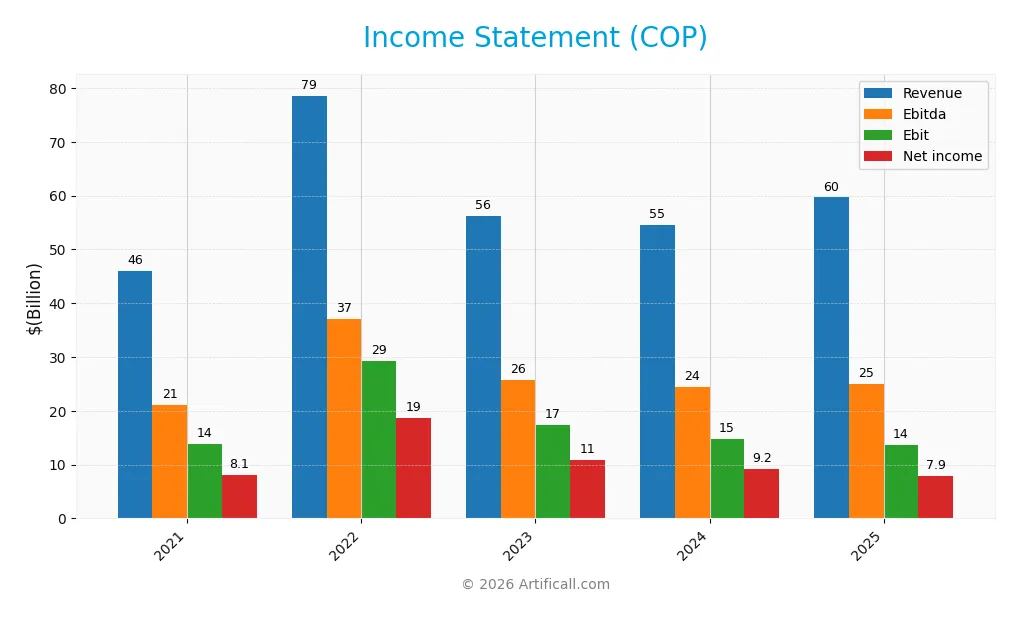
The table below summarizes ConocoPhillips’ key income statement metrics over the past five fiscal years, highlighting revenue, profitability, and earnings per share trends.
| 2021 | 2022 | 2023 | 2024 | 2025 | |
|---|---|---|---|---|---|
| Revenue | 46.1B | 78.6B | 56.1B | 54.6B | 59.7B |
| Cost of Revenue | 31.3B | 48.9B | 37.9B | 38.6B | 38.7B |
| Operating Expenses | 2.4B | 4.0B | 3.2B | 3.2B | 9.1B |
| Gross Profit | 14.7B | 29.6B | 18.2B | 16.0B | 21.0B |
| EBITDA | 21.1B | 37.1B | 25.8B | 24.4B | 25.0B |
| EBIT | 13.8B | 29.3B | 17.4B | 14.8B | 13.7B |
| Interest Expense | 1.1B | 1.1B | 1.1B | 1.1B | 1.1B |
| Net Income | 8.1B | 18.6B | 10.9B | 9.2B | 7.9B |
| EPS | 6.10 | 14.62 | 9.08 | 7.82 | 6.34 |
| Filing Date | 2022-02-17 | 2023-02-16 | 2024-02-15 | 2025-02-18 | 2026-02-17 |
Income Statement Evolution
ConocoPhillips’ revenue grew by 29.6% from 2021 to 2025, with a 9.3% rise in 2025 alone. Despite this, net income declined slightly by 1.8% over the period and dropped 21.3% in 2025. Gross margin remained strong at 35.2%, while net margin contracted by 24.2%, signaling margin pressure despite top-line growth.
Is the Income Statement Favorable?
The 2025 income statement shows mixed signals. Revenue and gross profit growth were favorable, but EBIT and net income declined year-over-year. Operating expenses rose at the same rate as revenue, eroding profitability. Interest expense remained low at 1.9% of revenue, supporting earnings stability. Overall, the fundamentals lean favorable, tempered by margin compression and earnings softness.
Financial Ratios
The following table summarizes key financial ratios for ConocoPhillips (COP) over the last five fiscal years, providing insight into profitability, valuation, liquidity, leverage, and efficiency:
| Ratios | 2021 | 2022 | 2023 | 2024 | 2025 |
|---|---|---|---|---|---|
| Net Margin | 17.5% | 23.7% | 19.5% | 16.9% | 13.3% |
| ROE | 17.8% | 38.8% | 22.2% | 14.2% | 12.3% |
| ROIC | 9.8% | 20.8% | 11.6% | 7.7% | 6.9% |
| P/E | 11.8x | 8.1x | 12.8x | 12.7x | 14.1x |
| P/B | 2.11x | 3.13x | 2.83x | 1.80x | 1.74x |
| Current Ratio | 1.34 | 1.46 | 1.43 | 1.29 | 1.30 |
| Quick Ratio | 1.23 | 1.36 | 1.29 | 1.14 | 1.14 |
| D/E | 0.44 | 0.36 | 0.40 | 0.39 | 0.36 |
| Debt-to-Assets | 22.0% | 18.3% | 20.5% | 20.6% | 19.2% |
| Interest Coverage | 11.0x | 24.3x | 14.1x | 11.5x | 10.4x |
| Asset Turnover | 0.51 | 0.84 | 0.59 | 0.44 | 0.49 |
| Fixed Asset Turnover | 0.71 | 1.20 | 0.79 | 0.57 | 0.64 |
| Dividend Yield | 2.5% | 3.8% | 4.0% | 3.1% | 3.6% |
Evolution of Financial Ratios
From 2021 to 2025, ConocoPhillips’ Return on Equity (ROE) declined from 17.8% to 12.3%, signaling weakening shareholder profitability. The Current Ratio remained relatively stable around 1.3, indicating consistent liquidity. Meanwhile, the Debt-to-Equity Ratio improved, falling from 0.44 to 0.36, reflecting better leverage management over the period.
Are the Financial Ratios Favorable?
In 2025, profitability ratios show mixed signals with a favorable net margin of 13.3% but neutral ROE and ROIC, suggesting moderate returns relative to capital costs. Liquidity is stable with a neutral current ratio and favorable quick ratio. Leverage measures such as debt-to-equity (0.36) and debt-to-assets (19.2%) are favorable, indicating controlled debt levels. Efficiency ratios like asset turnover are unfavorable, while market valuation metrics like P/E (14.13) and dividend yield (3.57%) are favorable overall.
Shareholder Return Policy
ConocoPhillips maintains a consistent dividend policy, with a payout ratio around 50% and a dividend yield near 3.5% in 2025. Dividends are well-covered by free cash flow, supported by a dividend paid and capex coverage ratio above 2.8.
The company also engages in share buybacks, complementing its dividend distributions. This balanced approach indicates a focus on sustainable shareholder returns, aligning with long-term value creation without excessive financial strain.
Score analysis
The radar chart below presents an overview of ConocoPhillips’s key financial scores as of 2026:
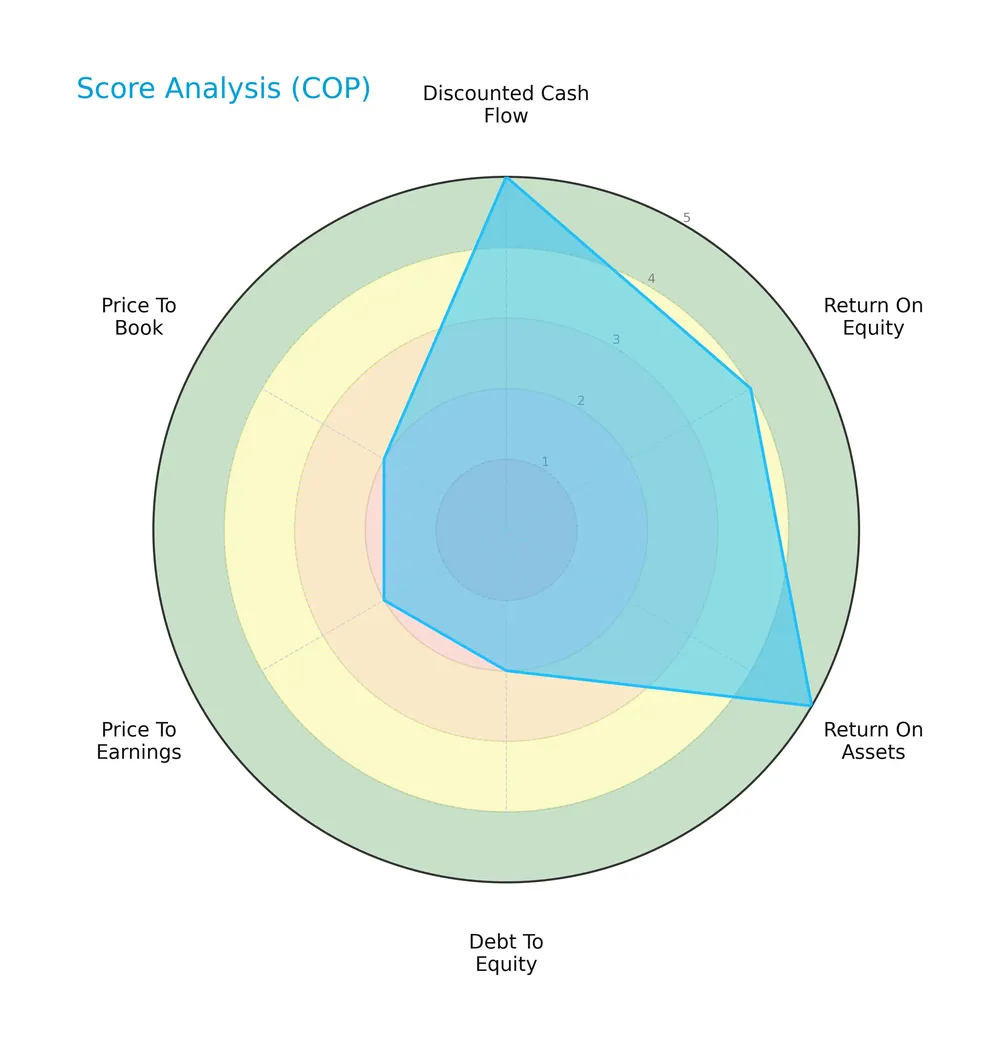
ConocoPhillips scores very favorably in discounted cash flow and return on assets, indicating strong profitability and valuation. However, its debt-to-equity and valuation multiples (PE, PB) scores lag, suggesting leverage concerns and market pricing pressures.
Analysis of the company’s bankruptcy risk
The Altman Z-Score places ConocoPhillips safely above the distress threshold, indicating a low risk of bankruptcy:

Is the company in good financial health?
The Piotroski Score diagram highlights ConocoPhillips’s solid financial condition, scoring in the strong range:

A score of 7 reflects robust profitability and efficiency metrics, underscoring overall financial strength despite some valuation and leverage challenges.
Competitive Landscape & Sector Positioning
This sector analysis reviews ConocoPhillips’ strategic positioning, revenue sources, key products, and competitors. I will evaluate whether ConocoPhillips holds a competitive advantage within the oil and gas exploration and production industry.
Strategic Positioning
ConocoPhillips maintains a diversified product portfolio focused on crude oil (39B in 2025), natural gas (8.9B), and natural gas liquids (3.7B). Geographically, it spans North America, Europe, Asia Pacific, and the Middle East, with significant revenue from the Lower 48 US states (41.4B) and Canada (5.6B).
Revenue by Segment
The pie chart illustrates ConocoPhillips’ revenue distribution by product segment for the fiscal year 2025, highlighting the contribution of crude oil, natural gas, and related products.
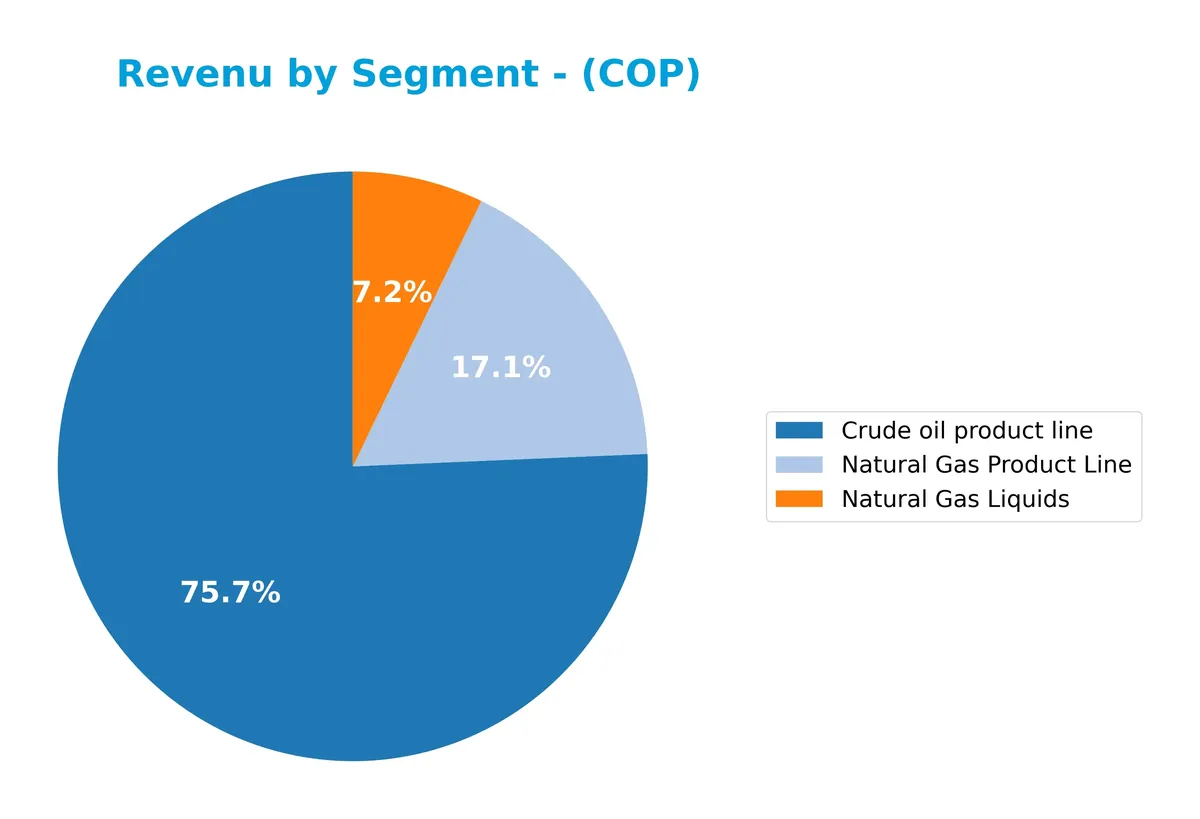
In 2025, the crude oil product line dominates with $39.1B in revenue, showing stability from 2024. Natural gas products contribute $8.9B, up from $6.4B last year, indicating a recovery. Natural gas liquids reached $3.7B, growing notably. The absence of “Other Products” in 2025 suggests a strategic focus on core segments. The business remains heavily reliant on crude oil, with natural gas segments gaining momentum.
Key Products & Brands
ConocoPhillips generates revenue from several core oil and gas product lines as detailed below:
| Product | Description |
|---|---|
| Crude Oil Product Line | Exploration, production, transport, and marketing of crude oil globally. |
| Natural Gas Product Line | Production and sale of natural gas, including shale and conventional sources. |
| Natural Gas Liquids | Extraction and marketing of natural gas liquids (NGLs) from gas streams. |
| Other Products | Miscellaneous hydrocarbons and byproducts not classified under main lines. |
ConocoPhillips’ revenue mix centers on crude oil and natural gas products. Crude oil consistently leads, complemented by sizable natural gas and NGL contributions. Other products add diversification but represent a smaller share.
Main Competitors
ConocoPhillips faces 10 main competitors in the Oil & Gas Exploration & Production sector. Below are the top 10 leaders by market capitalization:
| Competitor | Market Cap. |
|---|---|
| ConocoPhillips | 120B |
| EOG Resources, Inc. | 59B |
| Diamondback Energy, Inc. | 44B |
| Occidental Petroleum Corporation | 42B |
| EQT Corporation | 33B |
| Expand Energy Corporation | 26B |
| Devon Energy Corporation | 24B |
| Texas Pacific Land Corporation | 21B |
| Coterra Energy Inc. | 20B |
| APA Corporation | 9B |
ConocoPhillips ranks first among its competitors, with a market cap 12% above the nearest rival. It stands well above both the 40B average market cap of the top 10 and the 30B median for the sector. The company’s lead over the next competitor is substantial, reflecting a dominant position in this industry segment.
Comparisons with competitors
Check out how we compare the company to its competitors:
Does ConocoPhillips have a competitive advantage?
ConocoPhillips shows a slight competitive advantage with a ROIC exceeding its WACC by 2.1%, signaling value creation despite a declining profitability trend. Its favorable gross margin of 35.15% supports efficient capital use, but a reduction in net margin highlights emerging challenges.
The company’s diverse global footprint, including conventional and unconventional assets across North America, Europe, and Asia, offers growth opportunities. Continued LNG developments and unconventional plays position ConocoPhillips to capitalize on evolving energy markets and demand shifts.
SWOT Analysis
This analysis highlights ConocoPhillips’ core strengths, weaknesses, opportunities, and threats to clarify its strategic position.
Strengths
- strong market cap at 134B USD
- favorable gross margin at 35.15%
- low beta of 0.29 indicating stability
Weaknesses
- declining ROIC trend by 30%
- unfavorable EBIT and net margin growth in last year
- asset turnover ratios below industry norms
Opportunities
- expanding LNG and unconventional resource portfolio
- geographic diversification across North America and Asia
- favorable dividend yield at 3.57%
Threats
- volatile oil prices impacting revenue
- regulatory risks in multiple jurisdictions
- rising operational expenses affecting margins
Overall, ConocoPhillips maintains a solid value-creating business with stable profitability. However, recent declines in operational efficiency and margin growth require strategic focus on cost control and asset productivity. The company’s global footprint and energy transition investments offer growth pathways but demand vigilant risk management.
Stock Price Action Analysis
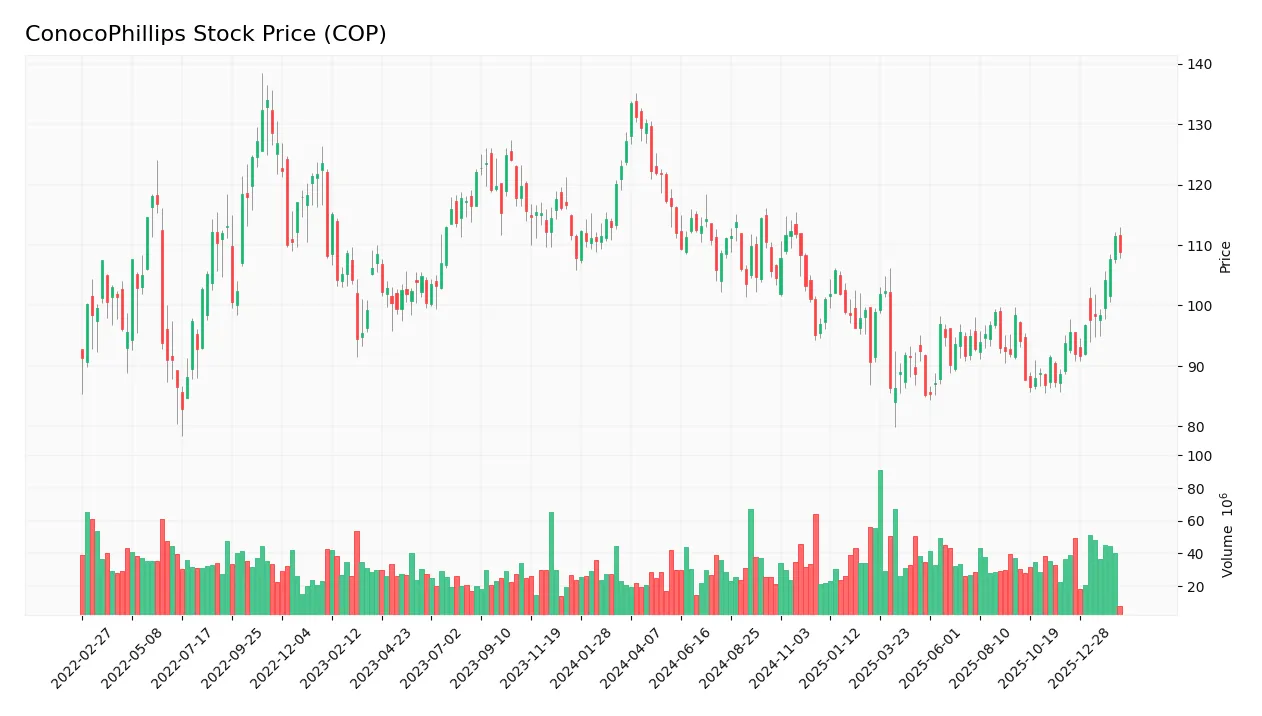
The weekly stock chart illustrates ConocoPhillips’ price fluctuations over the past 100 weeks, highlighting key support and resistance levels:
Trend Analysis
Over the past 12 months, ConocoPhillips’ stock price declined by 14.53%, indicating a clear bearish trend with accelerating downward momentum. Price volatility remains high, with a standard deviation of 11.41. The stock ranged between a high of 133.52 and a low of 85.19 during this period.
Volume Analysis
Trading volume shows an increasing trend, totaling nearly 4B shares traded overall. Buyers accounted for 54.72% of volume, suggesting moderate buyer dominance. In the recent three months, buyer volume surged to 360M versus 75M sellers, reflecting strong buyer control and heightened market participation.
Target Prices
Analysts set a consensus target price reflecting moderate upside potential for ConocoPhillips.
| Target Low | Target High | Consensus |
|---|---|---|
| 98 | 133 | 116.79 |
The target range indicates expectations of a 10-20% gain from current levels, signaling cautious optimism on the stock’s growth prospects.

Don’t Let Luck Decide Your Entry Point
Optimize your entry points with our advanced ProRealTime indicators. You’ll get efficient buy signals with precise price targets for maximum performance. Start outperforming now!
Analyst & Consumer Opinions
This section examines ConocoPhillips’ recent analyst ratings alongside consumer feedback to provide a balanced perspective.
Stock Grades
Here are the latest verified stock grades for ConocoPhillips from major financial institutions:
| Grading Company | Action | New Grade | Date |
|---|---|---|---|
| Citigroup | Maintain | Buy | 2026-02-09 |
| Wells Fargo | Maintain | Overweight | 2026-02-06 |
| BMO Capital | Maintain | Outperform | 2026-02-06 |
| Piper Sandler | Maintain | Overweight | 2026-02-06 |
| Susquehanna | Maintain | Positive | 2026-01-26 |
| Morgan Stanley | Maintain | Overweight | 2026-01-23 |
| JP Morgan | Downgrade | Neutral | 2026-01-20 |
| B of A Securities | Downgrade | Underperform | 2026-01-16 |
| JP Morgan | Maintain | Overweight | 2026-01-13 |
| Wells Fargo | Upgrade | Overweight | 2026-01-12 |
The grades mostly maintain a positive outlook with a majority recommending buy or overweight positions. Recent downgrades from JP Morgan and B of A Securities signal some caution, but the overall trend still favors a buy consensus.
Consumer Opinions
ConocoPhillips evokes a mix of respect for its operational strength and concern over environmental impacts among consumers.
| Positive Reviews | Negative Reviews |
|---|---|
| Reliable energy supply even during volatile markets. | Environmental concerns related to fossil fuels. |
| Transparent communication on company strategy. | Perceived slow adoption of renewable initiatives. |
| Strong commitment to safety and worker welfare. | Price fluctuations affect consumer energy costs. |
| Solid dividends appeal to long-term investors. | Occasional operational disruptions reported. |
Overall, consumers appreciate ConocoPhillips’ consistent energy delivery and transparency. However, environmental impact and slow green transition remain persistent concerns.
Risk Analysis
Below is a summary of key risks facing ConocoPhillips, highlighting their likelihood and potential impact:
| Category | Description | Probability | Impact |
|---|---|---|---|
| Commodity Price Risk | Oil and gas price volatility heavily influences revenue and profit margins. | High | High |
| Regulatory Risk | Stricter environmental regulations could increase operating costs. | Medium | Medium |
| Operational Risk | Exploration and production disruptions can delay projects and increase costs. | Medium | High |
| Debt and Financing Risk | Moderate leverage; tightening credit conditions may raise borrowing costs. | Low | Medium |
| Market Competition | Intense competition pressures margins and market share. | Medium | Medium |
| Environmental Risk | Exposure to climate change policies and potential asset impairments. | Medium | High |
Commodity price fluctuations remain the most critical risk for ConocoPhillips, given its direct effect on cash flow. The company’s favorable Altman Z-score of 3.09 signals financial stability amid these risks. However, rising regulatory pressures and operational challenges could impact profitability and asset valuations. Investors should monitor these factors closely.
Should You Buy ConocoPhillips?
ConocoPhillips appears to be a profitable company with robust value creation despite a declining ROIC trend. Its leverage profile is manageable but shows some weakness. Supported by an A- rating and a safe-zone Altman Z-Score, the profile could be seen as slightly favorable.
Strength & Efficiency Pillars
ConocoPhillips exhibits solid operational efficiency with a net margin of 13.29% and an EBIT margin of 22.88%. Its ROIC stands at 6.86%, exceeding the WACC of 4.72%, confirming that the company is a clear value creator. While the ROIC trend shows some decline, the firm maintains favorable debt metrics, including a debt-to-equity ratio of 0.36 and strong interest coverage of 11.99. These factors underscore its ability to generate returns above capital costs, a positive sign amid sector volatility.
Weaknesses and Drawbacks
Despite operational strengths, ConocoPhillips faces challenges. Its stock price trend remains bearish with a 14.53% decline over the past year, reflecting market headwinds. Although the Altman Z-Score of 3.09 places it safely above distress levels, valuation metrics present mixed signals: a P/E of 14.13 is reasonable, but the price-to-book ratio of 1.74 is only neutral. Asset turnover ratios are unfavorable, indicating less efficient asset use. The moderate current ratio of 1.3 suggests liquidity is adequate but not robust.
Our Final Verdict about ConocoPhillips
The company’s fundamentals appear sound, supported by value creation and a strong solvency profile. However, the bearish long-term price trend signals caution. Despite recent strong buyer dominance with an 82.7% buyer volume share, the broader downward momentum suggests investors might consider a wait-and-see stance for a more favorable entry point. ConocoPhillips may appear attractive for disciplined investors seeking exposure to energy, but risks remain amid sector cyclicality.
Disclaimer: This content is for informational purposes only and does not constitute financial, investment, or other professional advice. Investing in financial markets involves a significant risk of loss, and past performance is not indicative of future results.
Additional Resources
- Analysts Are Neutral on Top Energy Stocks: Conocophillips (COP), TC Energy (TRP) – The Globe and Mail (Feb 18, 2026)
- Decoding ConocoPhillips (COP): A Strategic SWOT Insight – GuruFocus (Feb 18, 2026)
- Why ConocoPhillips Stock Dropped on Tuesday – The Motley Fool (Feb 17, 2026)
- Stock Traders Buy Large Volume of Call Options on ConocoPhillips (NYSE:COP) – MarketBeat (Feb 17, 2026)
- ConocoPhillips sees no effect on Alaska drilling plans after rig collapse (COP:NYSE) – Seeking Alpha (Feb 17, 2026)
For more information about ConocoPhillips, please visit the official website: conocophillips.com