Home > Analyses > Consumer Defensive > Conagra Brands, Inc.
Conagra Brands, Inc. feeds millions daily with its diverse portfolio of trusted food products, from frozen meals to savory snacks. As a major player in the packaged foods industry, it commands a strong presence through iconic brands like Birds Eye and Healthy Choice, known for quality and innovation. With a strategic footprint across grocery, foodservice, and international markets, Conagra’s ability to adapt and grow remains crucial. The key question: does its current financial health and market position support sustainable long-term growth?

Table of contents
Business Model & Company Overview
Conagra Brands, Inc., founded in 1861 and headquartered in Chicago, IL, stands as a dominant player in the packaged foods industry across North America. Its ecosystem integrates a diverse portfolio of well-known brands like Birds Eye, Duncan Hines, and Slim Jim, serving grocery, refrigerated, frozen, international, and foodservice channels. This cohesive mission centers on delivering trusted, convenient food products that cater to evolving consumer preferences in multiple temperature formats and retail environments.
The company’s revenue engine balances shelf-stable and temperature-controlled food sales with branded and custom foodservice offerings. Conagra thrives on its strategic footprint spanning the US and international markets, leveraging strong retail and foodservice distribution networks. This multi-segment approach underpins a resilient economic moat, reinforcing its role in shaping the future of consumer packaged foods through innovation and scale.
Financial Performance & Fundamental Metrics
I will analyze Conagra Brands, Inc.’s income statement, key financial ratios, and dividend payout policy to assess its overall financial health and investment potential.
Income Statement
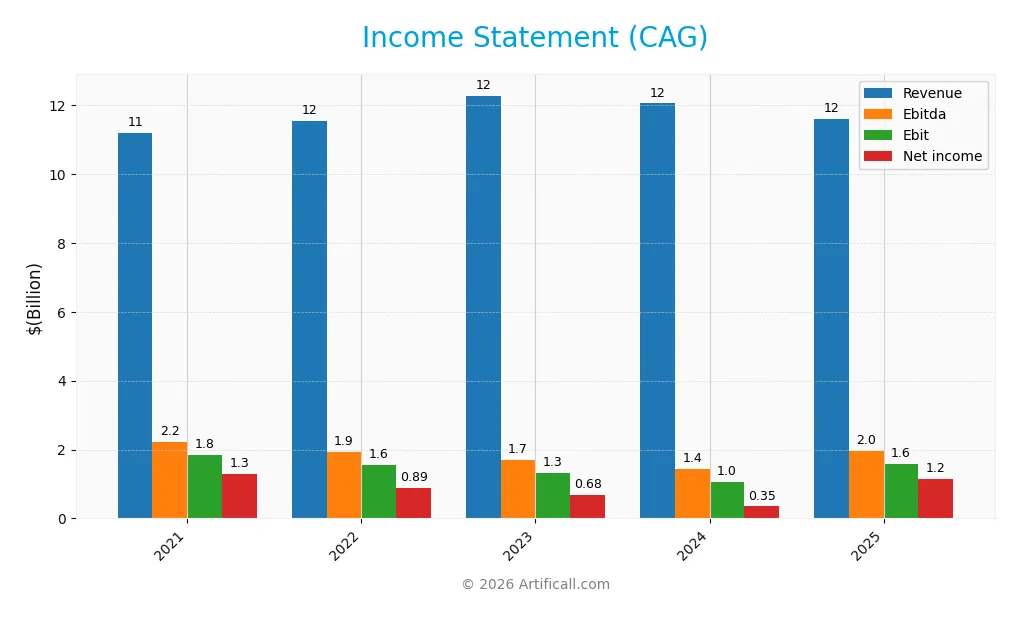
Below is the Income Statement for Conagra Brands, Inc. (ticker: CAG) presenting key financial figures for the fiscal years 2021 through 2025.
| 2021 | 2022 | 2023 | 2024 | 2025 | |
|---|---|---|---|---|---|
| Revenue | 11.18B | 11.54B | 12.28B | 12.05B | 11.61B |
| Cost of Revenue | 8.01B | 8.70B | 9.01B | 8.72B | 8.61B |
| Operating Expenses | 1.40B | 1.49B | 2.19B | 2.48B | 1.64B |
| Gross Profit | 3.18B | 2.84B | 3.26B | 3.33B | 3.00B |
| EBITDA | 2.22B | 1.94B | 1.69B | 1.45B | 1.97B |
| EBIT | 1.83B | 1.56B | 1.32B | 1.05B | 1.58B |
| Interest Expense | 422M | 382M | 414M | 436M | 417M |
| Net Income | 1.30B | 888M | 684M | 347M | 1.15B |
| EPS | 2.67 | 1.85 | 1.43 | 0.73 | 2.41 |
| Filing Date | 2021-07-23 | 2022-07-21 | 2023-07-13 | 2024-07-11 | 2025-07-10 |
Income Statement Evolution
From 2021 to 2025, Conagra Brands, Inc. experienced a modest revenue growth of 3.8%, ending at $11.6B in 2025, though revenue declined by 3.6% in the last year. Net income showed a negative trend over the full period, declining by 11.3%, despite a significant rebound in 2025. Margins improved recently, with gross margin at 25.9% and net margin at 9.9%, reflecting better profitability despite recent revenue softness.
Is the Income Statement Favorable?
In 2025, Conagra’s fundamentals appear generally favorable, supported by a 50.5% increase in EBIT and a remarkable 244% net margin growth year-over-year. The firm maintained a healthy EBIT margin of 13.6% and controlled interest expenses at 3.6% of revenue. Earnings per share surged by 235%, indicating improved operational efficiency, even though revenue and gross profit contracted slightly. Overall, the income statement shows signs of strengthening profitability.
Financial Ratios
The table below presents key financial ratios for Conagra Brands, Inc. (CAG) across recent fiscal years, offering a snapshot of profitability, liquidity, leverage, efficiency, and dividend metrics:
| Ratios | 2021 | 2022 | 2023 | 2024 | 2025 |
|---|---|---|---|---|---|
| Net Margin | 12% | 7.7% | 5.6% | 2.9% | 9.9% |
| ROE | 15.2% | 10.1% | 7.8% | 4.1% | 12.9% |
| ROIC | 7.9% | 5.1% | 4.1% | 2.6% | 7.4% |
| P/E | 14.3 | 17.9 | 24.4 | 41.7 | 9.3 |
| P/B | 2.16 | 1.81 | 1.91 | 1.72 | 1.20 |
| Current Ratio | 0.82 | 0.86 | 0.76 | 0.97 | 0.71 |
| Quick Ratio | 0.30 | 0.30 | 0.26 | 0.33 | 0.24 |
| D/E | 1.08 | 1.05 | 1.08 | 1.03 | 0.93 |
| Debt-to-Assets | 42% | 41% | 43% | 41% | 40% |
| Interest Coverage | 4.2 | 3.5 | 2.6 | 2.0 | 3.3 |
| Asset Turnover | 0.50 | 0.51 | 0.56 | 0.58 | 0.55 |
| Fixed Asset Turnover | 4.35 | 4.21 | 4.49 | 4.16 | 4.09 |
| Dividend Yield | 2.6% | 3.7% | 3.7% | 4.5% | 6.2% |
Evolution of Financial Ratios
Over the analyzed period, Conagra Brands, Inc. saw Return on Equity (ROE) fluctuate, peaking in 2021 at 15.19% before stabilizing near 12.9% in 2025. The Current Ratio consistently declined from 0.82 in 2021 to 0.71 in 2025, indicating decreasing short-term liquidity. Debt-to-Equity Ratio showed a slight downward trend, moving from about 1.08 in 2021 to 0.93 in 2025, reflecting modest deleveraging. Profitability margins remained relatively stable with net margins hovering around 10% in 2025.
Are the Financial Ratios Fovorable?
In 2025, Conagra’s profitability ratios, including ROE at 12.9% and net margin near 9.9%, are evaluated as neutral, showing moderate returns without significant improvement. Liquidity ratios, such as the Current Ratio (0.71) and Quick Ratio (0.24), are unfavorable, suggesting limited short-term financial flexibility. Leverage metrics like Debt-to-Equity at 0.93 and interest coverage around 3.8 are neutral, indicating manageable debt levels. Efficiency is mixed with asset turnover neutral, but fixed asset turnover favorable. Market valuation ratios, including P/E of 9.3 and P/B of 1.2, are favorable, supporting a slightly favorable overall ratio evaluation.
Shareholder Return Policy
Conagra Brands, Inc. maintains a consistent dividend policy, with a payout ratio around 58% in 2025 and a dividend yield near 6.25%, supported by free cash flow coverage of approximately 77%. The steady increase in dividend per share and moderate payout ratio suggest balanced distributions, with no excessive risk from repurchases noted.
The company also engages in share buybacks, complementing dividend payments to return value to shareholders. This dual approach appears sustainable, aligning with long-term value creation by balancing shareholder rewards and financial prudence, given the solid profitability and cash flow metrics observed.
Score analysis
Here is a radar chart illustrating Conagra Brands, Inc.’s key financial scores across multiple valuation and performance metrics:
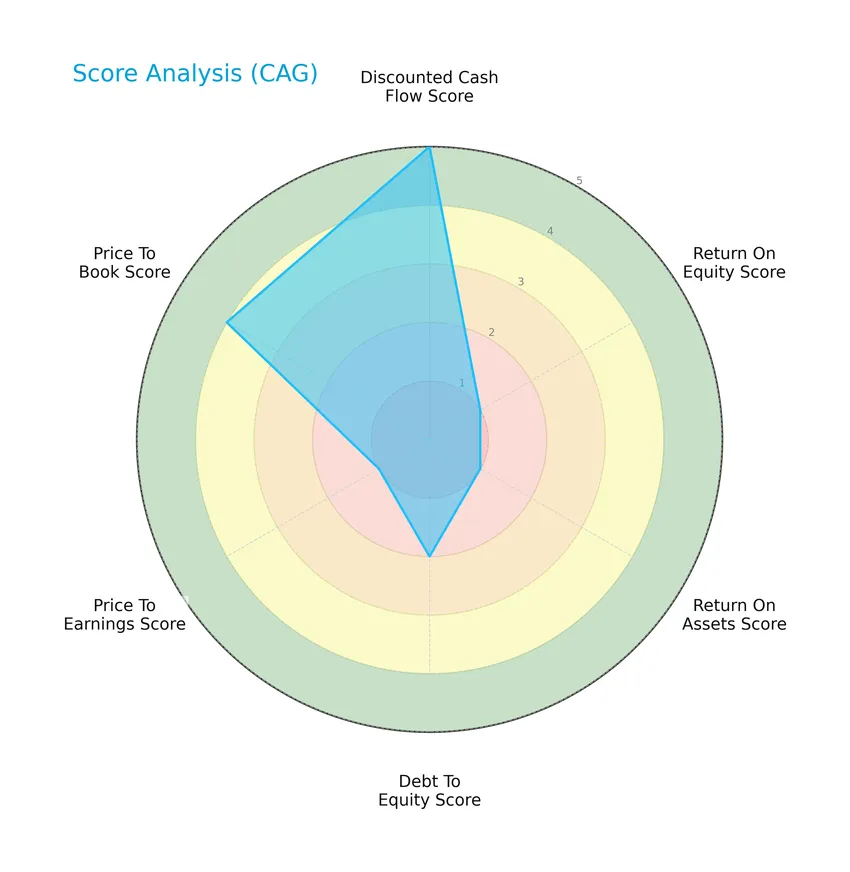
The company’s discounted cash flow score is very favorable at 5, while its price to book score is favorable at 4. However, return on equity and return on assets scores are very unfavorable at 1 each. Debt to equity is moderate at 2, and price to earnings is very unfavorable at 1, reflecting mixed financial health indicators.
Analysis of the company’s bankruptcy risk
Conagra Brands, Inc. currently falls in the distress zone with an Altman Z-Score of approximately 1.5, indicating a higher probability of financial distress and potential bankruptcy risk:

Is the company in good financial health?
The Piotroski Score diagram below reflects the company’s financial strength based on nine criteria:

With a Piotroski Score of 3, Conagra Brands, Inc. is classified as very weak in financial health, suggesting underlying challenges in profitability, leverage, liquidity, or operational efficiency.
Competitive Landscape & Sector Positioning
This section will analyze Conagra Brands, Inc.’s strategic position, revenue breakdown, key products, main competitors, and competitive advantages. I will assess whether Conagra holds a distinct competitive edge over its industry peers.
Strategic Positioning
Conagra Brands, Inc. maintains a diversified product portfolio across four segments: Grocery & Snacks, Refrigerated & Frozen, International, and Foodservice, with a strong North American focus complemented by international exposure. The company leverages multiple retail and foodservice channels to distribute its well-known consumer packaged food brands.
Revenue by Segment
This pie chart illustrates Conagra Brands, Inc.’s revenue distribution by segment for the fiscal year 2025, highlighting the company’s key business areas and their relative contributions.
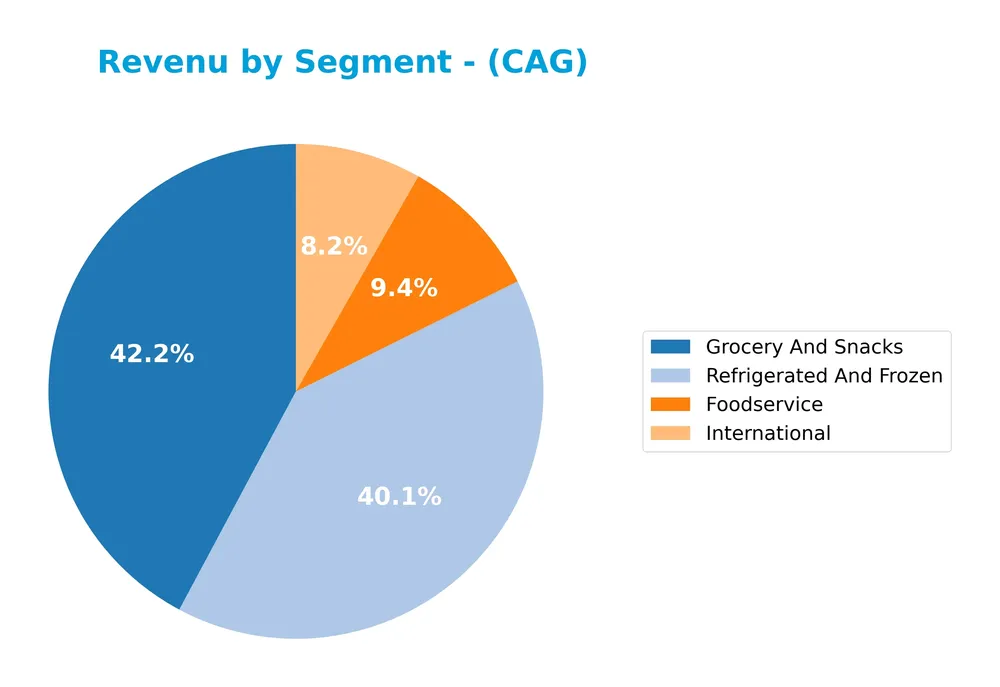
In 2025, Grocery And Snacks led revenue generation with $4.9B, followed closely by Refrigerated And Frozen at $4.7B. Foodservice contributed $1.1B, while the International segment accounted for $957M. The revenue mix shows stability with Grocery And Snacks and Refrigerated And Frozen as primary drivers, though both segments experienced slight declines compared to 2024, indicating a modest slowdown and a concentrated reliance on core U.S. markets.
Key Products & Brands
Below is an overview of Conagra Brands, Inc.’s key products and brands offering diverse food products across multiple segments:
| Product | Description |
|---|---|
| Birds Eye | Brand offering frozen vegetables and prepared frozen meals under the Refrigerated & Frozen segment. |
| Duncan Hines | Brand known for baking mixes and dessert products in the Grocery & Snacks segment. |
| Healthy Choice | Brand focusing on health-conscious frozen meals and food products in the Refrigerated & Frozen segment. |
| Marie Callender’s | Brand providing frozen meals and desserts, part of the Refrigerated & Frozen segment. |
| Reddi-wip | Brand specializing in whipped topping products within Grocery & Snacks. |
| Slim Jim | Brand offering meat snacks, primarily in the Grocery & Snacks segment. |
| Angie’s BOOMCHICKAPOP | Brand producing popcorn and snack foods under Grocery & Snacks. |
| Duke’s | Brand known for condiments and sauces, likely part of Grocery & Snacks. |
| Earth Balance | Brand offering plant-based food products across Grocery & Snacks. |
| Gardein | Brand providing meat alternatives in the Refrigerated & Frozen segment. |
| Frontera | Brand specializing in Mexican-inspired sauces and food products within Grocery & Snacks. |
Conagra Brands operates through four main segments: Grocery & Snacks, Refrigerated & Frozen, International, and Foodservice. Its portfolio includes a broad range of shelf-stable, refrigerated, frozen, and customized food products marketed under well-known brand names.
Main Competitors
There are 11 competitors in the Consumer Defensive sector; below is the list of the top 10 leaders by market capitalization:
| Competitor | Market Cap. |
|---|---|
| JBS N.V. | 31.99B |
| The Kraft Heinz Company | 28.87B |
| General Mills, Inc. | 24.90B |
| McCormick & Company, Incorporated | 18.06B |
| Hormel Foods Corporation | 12.87B |
| The J. M. Smucker Company | 10.31B |
| The Magnum Ice Cream Company N.V. | 9.70B |
| Pilgrim’s Pride Corporation | 9.26B |
| Conagra Brands, Inc. | 8.28B |
| Campbell Soup Company | 8.26B |
Conagra Brands ranks 9th among its 11 competitors, with a market cap roughly 26% that of the leader, JBS N.V. The company’s market capitalization is below both the average market cap of the top 10 competitors (16.25B) and the sector median (10.31B). It is positioned 10.64% below the next competitor above, Pilgrim’s Pride Corporation, indicating a moderate gap in scale.
Comparisons with competitors
Check out how we compare the company to its competitors:
Does CAG have a competitive advantage?
Conagra Brands, Inc. demonstrates a competitive advantage through its ability to create value, with a ROIC exceeding its WACC by nearly 3%, indicating efficient use of invested capital and consistent profitability. Despite this, the company faces a declining ROIC trend, suggesting some erosion in profitability over recent years.
Looking ahead, Conagra’s diverse portfolio across Grocery & Snacks, Refrigerated & Frozen, International, and Foodservice segments positions it to explore new market opportunities and product innovations. Continued focus on brand strength and expanding its presence in temperature-controlled and international food markets may support future growth prospects.
SWOT Analysis
This SWOT analysis highlights Conagra Brands, Inc.’s key internal strengths and weaknesses alongside external opportunities and threats to guide strategic decisions.
Strengths
- strong brand portfolio
- favorable EBIT and net margins
- low WACC supporting value creation
Weaknesses
- declining revenue and net income growth
- weak liquidity ratios
- low Piotroski score indicating financial weakness
Opportunities
- growth potential in international markets
- expanding frozen and refrigerated segments
- increasing demand for convenient packaged foods
Threats
- intense competition in packaged foods
- sensitivity to raw material costs
- financial distress risk per Altman Z-score
Overall, Conagra shows solid profitability and brand strength but faces challenges in revenue growth and financial stability. Its strategy should focus on leveraging brand equity and operational efficiency while improving liquidity and addressing financial risk.
Stock Price Action Analysis
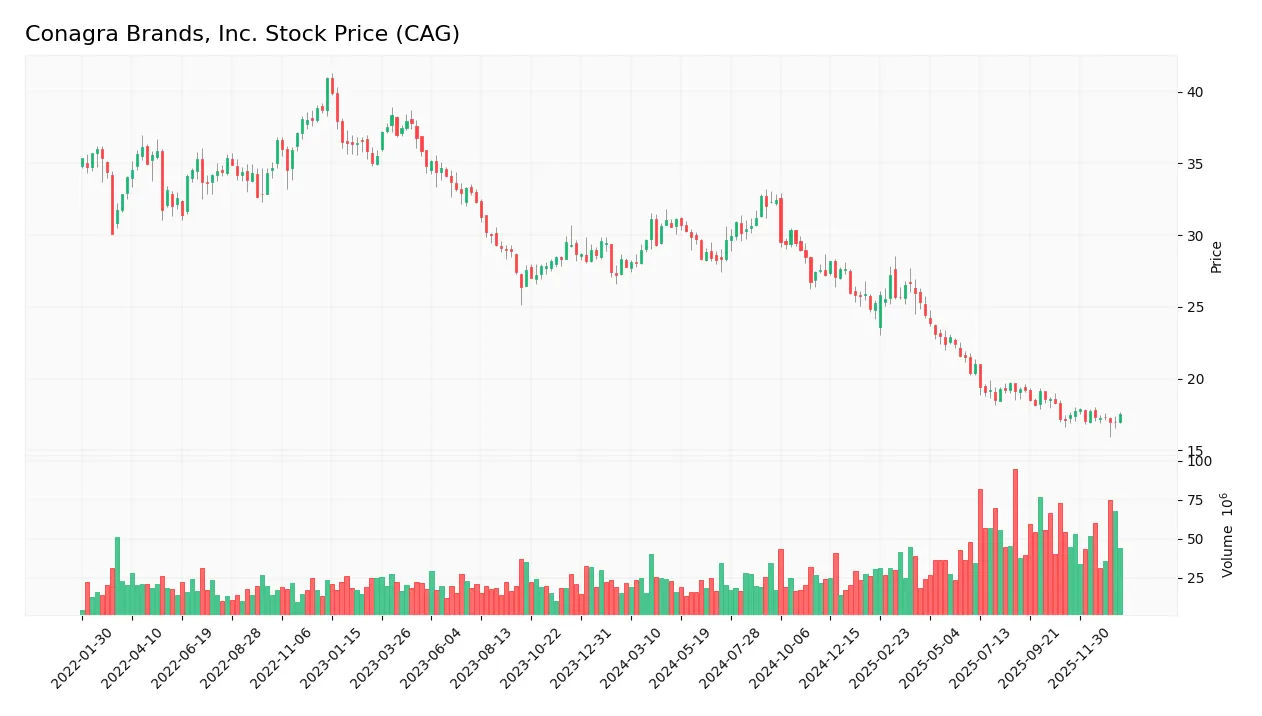
The following weekly stock chart illustrates Conagra Brands, Inc. (CAG) price movements over the past 12 months, highlighting key highs and lows:
Trend Analysis
Over the past 12 months, CAG’s stock price declined by 37.01%, indicating a clear bearish trend with accelerating downward momentum. The price range stretched from a high of 32.74 to a low of 16.94, supported by a volatility measure of 4.97, confirming significant fluctuations during this period.
Volume Analysis
Trading volume has been increasing overall, with a total volume near 3.9B shares and seller volume exceeding buyer volume at about 59%. However, in the recent three-month period, buyer volume slightly dominates at 55.68%, suggesting a shift toward buyer interest and increased market participation.
Target Prices
The consensus among analysts sets a clear price range for Conagra Brands, Inc. (CAG) with defined expectations.
| Target High | Target Low | Consensus |
|---|---|---|
| 22 | 16 | 18.5 |
Analysts generally expect CAG’s stock price to trade between $16 and $22, with a consensus target around $18.5, indicating moderate upside potential.

Don’t Let Luck Decide Your Entry Point
Optimize your entry points with our advanced ProRealTime indicators. You’ll get efficient buy signals with precise price targets for maximum performance. Start outperforming now!
Analyst & Consumer Opinions
This section reviews the latest analyst ratings and consumer feedback regarding Conagra Brands, Inc. (CAG).
Stock Grades
The latest stock grades for Conagra Brands, Inc. from reputable financial institutions are summarized below:
| Grading Company | Action | New Grade | Date |
|---|---|---|---|
| Morgan Stanley | Maintain | Equal Weight | 2026-01-16 |
| Wells Fargo | Maintain | Equal Weight | 2026-01-05 |
| UBS | Maintain | Neutral | 2025-12-23 |
| TD Cowen | Maintain | Hold | 2025-12-22 |
| Deutsche Bank | Maintain | Hold | 2025-12-22 |
| RBC Capital | Maintain | Sector Perform | 2025-12-22 |
| Evercore ISI Group | Maintain | In Line | 2025-12-22 |
| Morgan Stanley | Maintain | Equal Weight | 2025-12-22 |
| B of A Securities | Maintain | Underperform | 2025-12-22 |
| JP Morgan | Maintain | Neutral | 2025-12-16 |
Overall, the consensus among these institutions remains cautious, with most maintaining neutral, hold, or equal weight ratings. There is a clear predominance of moderate outlooks, reflecting a stable but unspectacular market position for Conagra Brands.
Consumer Opinions
Consumers of Conagra Brands, Inc. express a mix of satisfaction and constructive criticism, reflecting their varied experiences with the company’s products.
| Positive Reviews | Negative Reviews |
|---|---|
| “Great variety of products with consistent quality.” | “Some items occasionally have packaging issues.” |
| “Affordable prices and widely available in stores.” | “Customer service response times could be improved.” |
| “Innovative flavors that cater to diverse tastes.” | “Nutritional content could be healthier.” |
Overall, consumers appreciate Conagra’s product variety and affordability but often point out packaging concerns and suggest improvements in customer service and nutritional offerings.
Risk Analysis
Below is a summary table highlighting key risks associated with Conagra Brands, Inc., focusing on their likelihood and potential impact:
| Category | Description | Probability | Impact |
|---|---|---|---|
| Financial Health | Altman Z-Score in distress zone indicates potential bankruptcy risk | High | High |
| Profitability | Low Piotroski Score (3) suggests weak financial strength | High | Medium |
| Liquidity | Unfavorable current (0.71) and quick ratios (0.24) indicating liquidity issues | Medium | Medium |
| Market Valuation | Low P/E (9.3) and moderate P/B (1.2) favorable but reflects market caution | Low | Low |
| Debt Level | Moderate debt-to-equity (0.93) and interest coverage (3.78) | Medium | Medium |
| Operational Efficiency | Neutral asset turnover and ROIC suggest no strong operational edge | Medium | Medium |
The most pressing risks for Conagra are its financial distress signals, with an Altman Z-Score below 1.8 and a very weak Piotroski score, reflecting vulnerability to financial stress. Despite favorable valuation metrics, liquidity constraints and moderate debt levels warrant careful monitoring.
Should You Buy Conagra Brands, Inc.?
Conagra Brands, Inc. appears to be generating value with a slightly favorable moat despite declining profitability and operational efficiency. Its leverage profile could be seen as moderate amid financial distress signals, resulting in a B- overall rating suggesting cautious consideration.
Strength & Efficiency Pillars
Conagra Brands, Inc. presents a solid profitability profile with a net margin of 9.92% and a return on equity (ROE) of 12.9%, reflecting moderate efficiency in generating shareholder returns. Its return on invested capital (ROIC) stands at 7.36%, comfortably above the weighted average cost of capital (WACC) of 4.37%, confirming the company as a value creator. Despite this, the Altman Z-Score at 1.5 signals financial distress risk, while a Piotroski score of 3 indicates very weak financial strength, suggesting areas for caution despite operational efficiency.
Weaknesses and Drawbacks
The company faces valuation and liquidity concerns with a price-to-earnings ratio of 9.3 and price-to-book ratio of 1.2, which are favorable, but liquidity ratios are troubling: the current ratio at 0.71 and quick ratio at 0.24 indicate potential short-term liquidity stress. Additionally, the bearish overall stock trend (-37.01% price change) and a seller-dominant volume at 59.04% over the longer term underline ongoing market pressure, creating near-term headwinds for investors. The Altman Z-Score in the distress zone further underscores financial fragility risks.
Our Verdict about Conagra Brands, Inc.
The long-term fundamental profile of Conagra Brands, Inc. may appear mixed but leans toward favorable due to value creation and decent profitability. However, the bearish technical trend paired with prior seller dominance suggests that, despite recent slight buyer dominance, a cautious, wait-and-see approach might be prudent to identify a more opportune entry point. Investors should weigh operational strengths against liquidity and market risks before considering exposure.
Disclaimer: This content is for informational purposes only and does not constitute financial, investment, or other professional advice. Investing in financial markets involves a significant risk of loss, and past performance is not indicative of future results.
Additional Resources
- Do These 3 Checks Before Buying Conagra Brands, Inc. (NYSE:CAG) For Its Upcoming Dividend – Yahoo Finance (Jan 22, 2026)
- Conagra Brands: Positive Demand Signs, But More Proof Is Needed (NYSE:CAG) – Seeking Alpha (Jan 21, 2026)
- Why It Might Not Make Sense To Buy Conagra Brands, Inc. (NYSE:CAG) For Its Upcoming Dividend – simplywall.st (Jan 22, 2026)
- March 6th Options Now Available For Conagra Brands (CAG) – Nasdaq (Jan 22, 2026)
- Sumitomo Mitsui Trust Group Inc. Sells 1,391,812 Shares of Conagra Brands $CAG – MarketBeat (Jan 20, 2026)
For more information about Conagra Brands, Inc., please visit the official website: conagrabrands.com