Home > Comparison > Technology > ZBRA vs CGNX
The strategic rivalry between Zebra Technologies Corporation and Cognex Corporation shapes the trajectory of the technology sector. Zebra, a diversified communication equipment leader, integrates asset intelligence with mobility solutions. Cognex, a specialized hardware and machine vision innovator, focuses on automating manufacturing processes. This head-to-head pits broad industrial integration against targeted technological precision. This analysis will clarify which corporate path offers the superior risk-adjusted return for a diversified investment portfolio.
Table of contents
Companies Overview
Zebra Technologies and Cognex Corporation shape critical enterprise automation and manufacturing sectors. Both lead with advanced hardware and software solutions that drive efficiency worldwide.
Zebra Technologies Corporation: Enterprise Asset Intelligence Leader
Zebra dominates the communication equipment sector with robust asset intelligence solutions. It generates revenue through printers, barcode scanners, RFID readers, and rugged mobile devices. In 2026, Zebra focuses strategically on expanding cloud-based software subscriptions and robotics automation, enhancing real-time location systems and workflow management for retail, logistics, and healthcare.
Cognex Corporation: Machine Vision Pioneer
Cognex excels in machine vision technology, automating manufacturing and distribution processes worldwide. Its revenue comes from vision systems, sensors, barcode readers, and proprietary software like VisionPro and deep learning solutions. The 2026 strategy emphasizes advancing software tools for complex inspection and robotic guidance across automotive, electronics, and pharmaceutical industries.
Strategic Collision: Similarities & Divergences
Zebra and Cognex share a technology-driven automation focus but diverge in approach. Zebra offers a broad ecosystem combining hardware and cloud services, while Cognex specializes in vision software and sensors. Their primary battleground lies in supplying manufacturers and logistic operators with precision tracking versus visual inspection capabilities. These differences create distinct investment profiles: Zebra as a diversified solutions provider, Cognex as a niche innovator in machine vision.
Income Statement Comparison
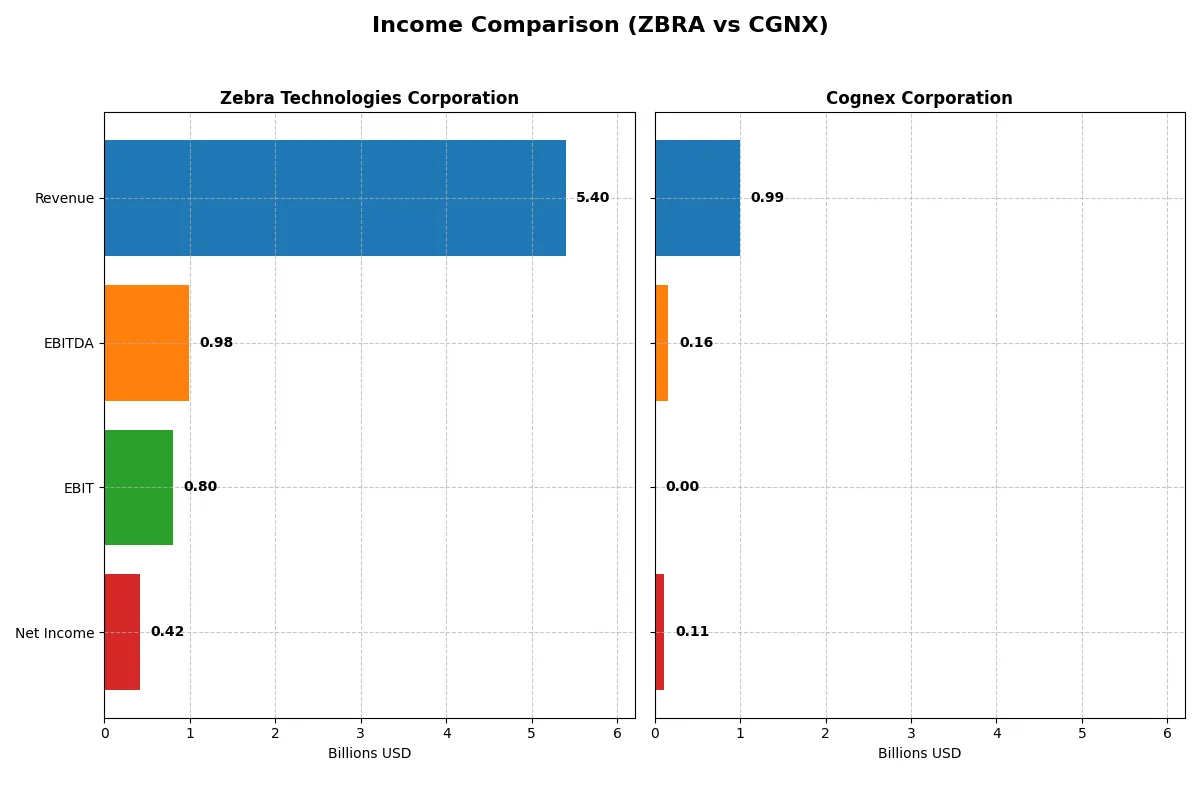
The following data dissects the core profitability and scalability of both corporate engines to reveal who dominates the bottom line:
| Metric | Zebra Technologies Corporation (ZBRA) | Cognex Corporation (CGNX) |
|---|---|---|
| Revenue | 5.40B | 994M |
| Cost of Revenue | 2.92B | 329M |
| Operating Expenses | 1.68B | 503M |
| Gross Profit | 2.48B | 665M |
| EBITDA | 985M | 163M |
| EBIT | 800M | 0 |
| Interest Expense | 108M | 0 |
| Net Income | 419M | 114M |
| EPS | 8.24 | 0.68 |
| Fiscal Year | 2025 | 2025 |
Income Statement Analysis: The Bottom-Line Duel
This income statement comparison reveals each company’s true operational efficiency and profit-generating power over recent years.
Zebra Technologies Corporation Analysis
Zebra’s revenue grew steadily from $4.58B in 2023 to $5.40B in 2025, showcasing solid top-line momentum. Gross margin holds strong near 46%, while net margin slipped to 7.8% in 2025, reflecting cost pressures. Despite a 4.6% EBIT increase in 2025, net income fell 20%, signaling margin compression and earnings volatility.
Cognex Corporation Analysis
Cognex’s revenue climbed from $837M in 2023 to nearly $1B in 2025, demonstrating consistent growth. It boasts an impressive gross margin of 67%, but EBIT margin collapsed to zero in 2025, indicating operational challenges. Net margin remains favorable at 11.5%. EPS increased 9.7% in 2025, hinting at improving shareholder returns despite earnings instability.
Margin Strength vs. Earnings Stability
Zebra delivers higher absolute revenue and operating profits but suffers from declining net margins and earnings. Cognex maintains superior gross and net margins with EPS growth, yet its EBIT disappearance raises red flags. Investors seeking scale may favor Zebra, while margin-focused profiles might find Cognex’s efficiency more compelling.
Financial Ratios Comparison
These vital ratios act as a diagnostic tool to expose the underlying fiscal health, valuation premiums, and capital efficiency of companies compared below:
| Ratios | Zebra Technologies (ZBRA) | Cognex Corporation (CGNX) |
|---|---|---|
| ROE | 11.7% | 7.7% |
| ROIC | 8.8% | 5.5% |
| P/E | 29.5 | 52.8 |
| P/B | 3.44 | 4.05 |
| Current Ratio | 0.97 | 3.80 |
| Quick Ratio | 0.58 | 3.05 |
| D/E (Debt/Equity) | 0.78 | 0.05 |
| Debt-to-Assets | 33.1% | 3.8% |
| Interest Coverage | 7.41 | 0 (not meaningful) |
| Asset Turnover | 0.63 | 0.49 |
| Fixed Asset Turnover | 10.40 | 6.28 |
| Payout Ratio | 0 | 47.7% |
| Dividend yield | 0 | 0.90% |
| Fiscal Year | 2025 | 2025 |
Efficiency & Valuation Duel: The Vital Signs
Ratios act as a company’s DNA, unveiling hidden risks and operational excellence critical for evaluating investment potential.
Zebra Technologies Corporation
Zebra shows moderate profitability with an 11.7% ROE and a 7.8% net margin, indicating steady efficiency. Its valuation appears stretched, marked by a high 29.5 P/E and 3.44 P/B ratio. The company pays no dividends, opting instead to reinvest heavily in R&D, fueling future growth potential despite a slightly unfavorable WACC and liquidity ratios.
Cognex Corporation
Cognex delivers a stronger net margin of 11.5%, but a weaker 7.7% ROE reflects lower equity efficiency. The stock trades at a very high 52.8 P/E and 4.05 P/B, signaling expensive valuation. It offers a modest 0.9% dividend yield but faces unfavorable interest coverage and asset turnover. The balance sheet strength shows in high liquidity and low debt levels.
Premium Valuation vs. Operational Safety
Zebra balances moderate profitability with reinvestment and operational efficiency, despite stretched valuation and weak liquidity. Cognex carries higher margin but suffers from expensive multiples and weaker operational metrics. Investors favoring growth with R&D focus may lean toward Zebra; those prioritizing liquidity and dividends might consider Cognex’s profile.
Which one offers the Superior Shareholder Reward?
I compare Zebra Technologies (ZBRA) and Cognex Corporation (CGNX) on their distribution strategies. ZBRA pays no dividends, reinvesting all FCF into growth with a 0% payout ratio and strong FCF coverage near 90%. CGNX distributes about 45-50% of earnings as dividends, yielding roughly 0.9%, supported by solid FCF coverage close to 90%. Both companies engage in buybacks; however, ZBRA’s leverage is higher, and its buyback intensity is less evident. Cognex’s conservative debt and steady dividend alongside buybacks provide a balanced shareholder return. I find CGNX’s mixed model more sustainable and attractive for total return in 2026.
Comparative Score Analysis: The Strategic Profile
The radar chart reveals the fundamental DNA and trade-offs of Zebra Technologies and Cognex Corporation, highlighting their financial strengths and valuation nuances:
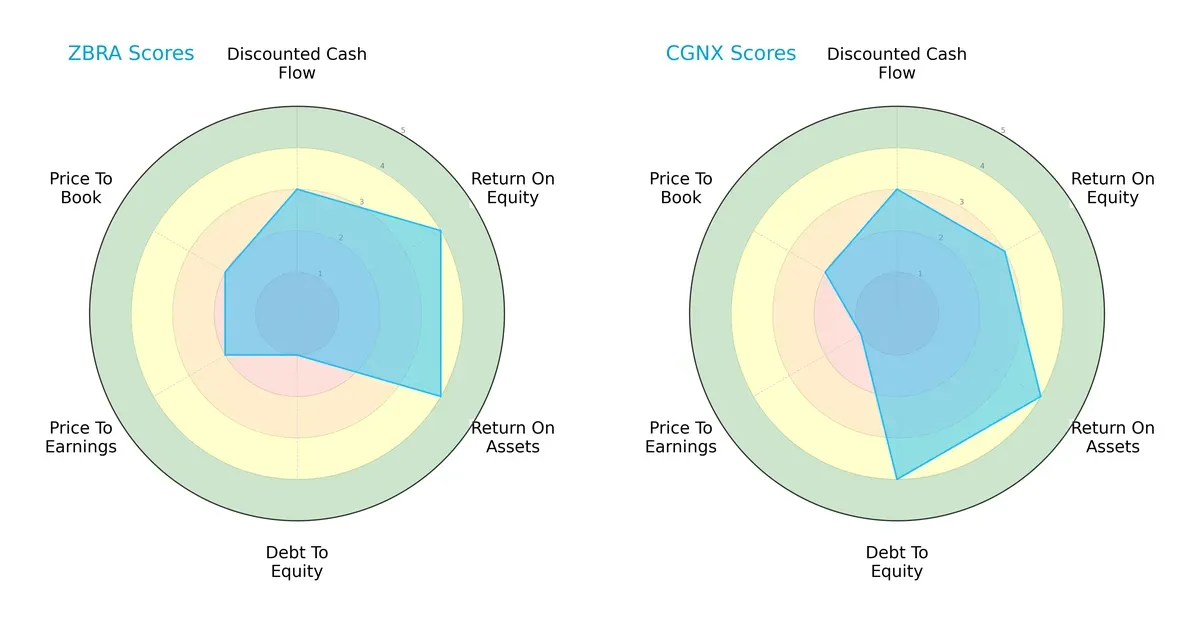
Zebra exhibits higher returns on equity (4) and assets (4), signaling efficient profit generation. However, its debt-to-equity score is critically low (1), indicating significant leverage risk. Cognex balances moderate returns (ROE 3, ROA 4) with a strong debt profile (4), suggesting financial stability. Both share moderate DCF scores (3), but Cognex’s valuation metrics are weaker, especially its price-to-earnings score (1). Overall, Cognex presents a more balanced financial risk profile, while Zebra relies heavily on operational efficiency despite its leverage vulnerability.
Bankruptcy Risk: Solvency Showdown
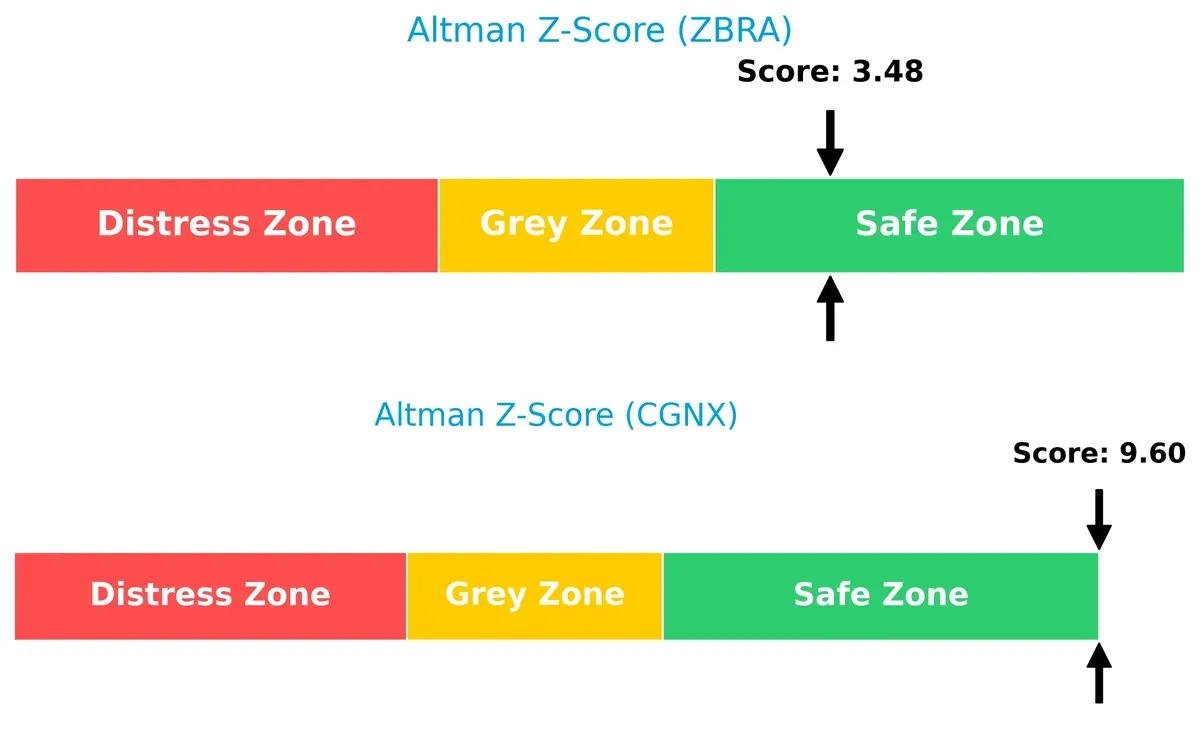
The Altman Z-Scores place both companies comfortably in the safe zone, but Cognex’s score (9.6) far exceeds Zebra’s (3.5), underscoring a wider margin of long-term solvency:
Financial Health: Quality of Operations
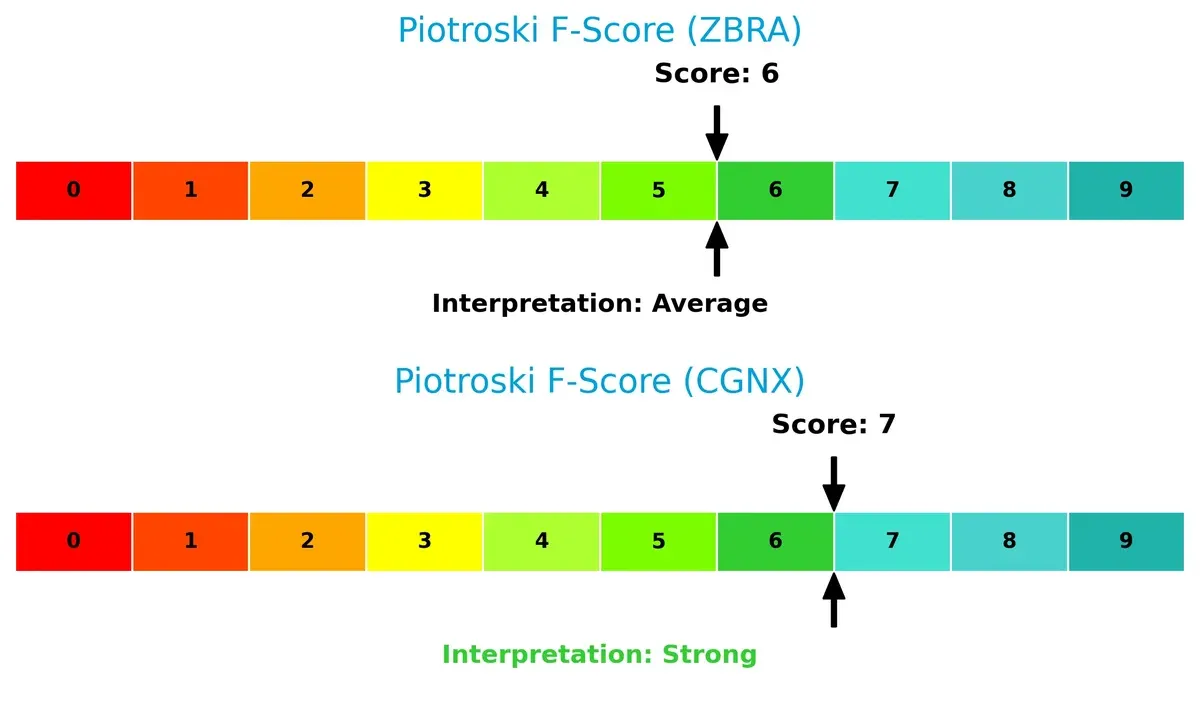
Cognex edges out Zebra in financial health with a Piotroski F-Score of 7 versus 6, indicating stronger internal metrics and fewer red flags in profitability and efficiency:
How are the two companies positioned?
This section dissects the operational DNA of Zebra Technologies and Cognex by comparing their revenue distribution and internal strengths and weaknesses. The goal is to confront their economic moats to reveal which business model delivers the most resilient competitive advantage today.
Revenue Segmentation: The Strategic Mix
This visual comparison dissects how Zebra Technologies and Cognex diversify their income streams and where their primary sector bets lie:
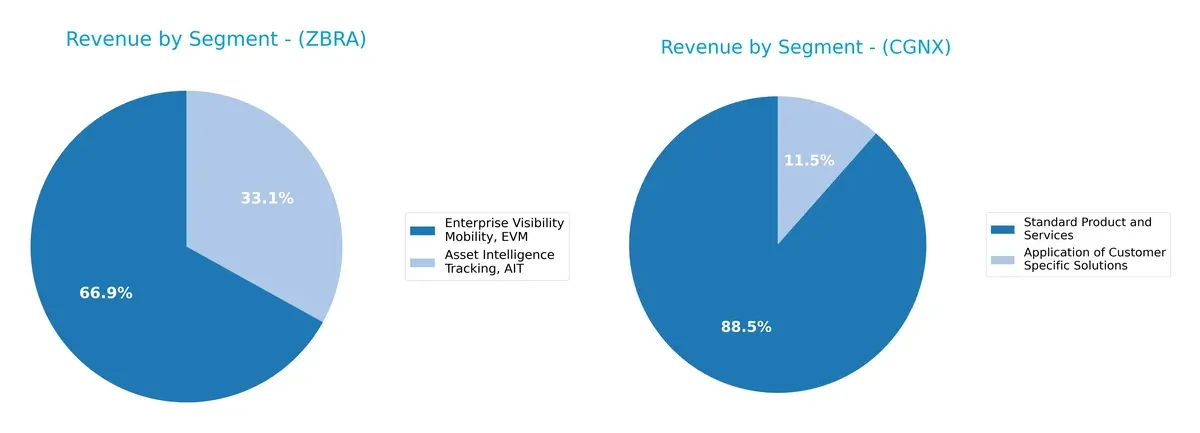
Zebra Technologies pivots heavily on Enterprise Visibility Mobility, generating $3.33B in 2024, dwarfing its Asset Intelligence Tracking at $1.65B. This signals strong reliance on mobility solutions with ecosystem lock-in potential. Cognex, by contrast, leans on Standard Product and Services, $795M in 2024, with Application of Customer Specific Solutions at $119M, showing a more concentrated but slightly diversified product mix. Zebra’s broader scale contrasts with Cognex’s niche focus, exposing differing risk profiles.
Strengths and Weaknesses Comparison
This table compares the Strengths and Weaknesses of Zebra Technologies Corporation and Cognex Corporation:
Zebra Technologies Strengths
- Diverse product segments including Asset Intelligence Tracking and Enterprise Visibility Mobility
- Strong global presence with significant revenue in North America, EMEA, and Asia Pacific
- Favorable interest coverage and fixed asset turnover ratios
Cognex Strengths
- Favorable net margin and quick ratio indicate strong profitability and liquidity
- Low debt to equity and debt to assets ratios signal conservative financial leverage
- Favorable fixed asset turnover ratio supports operational efficiency
Zebra Technologies Weaknesses
- Unfavorable current and quick ratios indicate liquidity concerns
- WACC exceeds ROIC, suggesting capital cost challenges
- High P/E and P/B ratios imply overvaluation risks
- Lack of dividend yield may deter income-focused investors
Cognex Weaknesses
- Unfavorable interest coverage and asset turnover ratios raise operational risks
- High P/E and P/B ratios signal valuation concerns
- Unfavorable current ratio despite favorable quick ratio suggests working capital issues
- Low ROE reflects weaker profitability on equity
Zebra Technologies shows strength in diversified products and global reach but faces liquidity and valuation pressures. Cognex benefits from profitability and low leverage yet struggles with operational efficiency and valuation risks. These factors shape each company’s strategic focus in capital allocation and market positioning.
The Moat Duel: Analyzing Competitive Defensibility
A structural moat is the only thing protecting long-term profits from relentless competition erosion. Let’s examine how these firms defend their turf:
Zebra Technologies Corporation: Asset Intelligence Moat
Zebra’s primary moat stems from its extensive product ecosystem in asset tracking and enterprise mobility. This generates steady margins but declining ROIC signals weakening capital efficiency. Product innovation in RFID and robotics could deepen the moat if execution improves in 2026.
Cognex Corporation: Specialized Machine Vision Moat
Cognex’s moat relies on patented machine vision technology and deep learning software, differentiating it from Zebra’s broader hardware focus. Despite superior gross margins, a sharp ROIC decline reflects operational challenges. Expansion into AI-driven applications offers potential but remains uncertain.
Market Share Defense: Product Ecosystem vs. Technological Specialization
Both companies face value destruction with declining ROIC trends, but Zebra’s diversified asset intelligence platform offers a wider moat than Cognex’s niche vision systems. Zebra is better positioned to leverage new markets and defend share in an evolving technology landscape.
Which stock offers better returns?
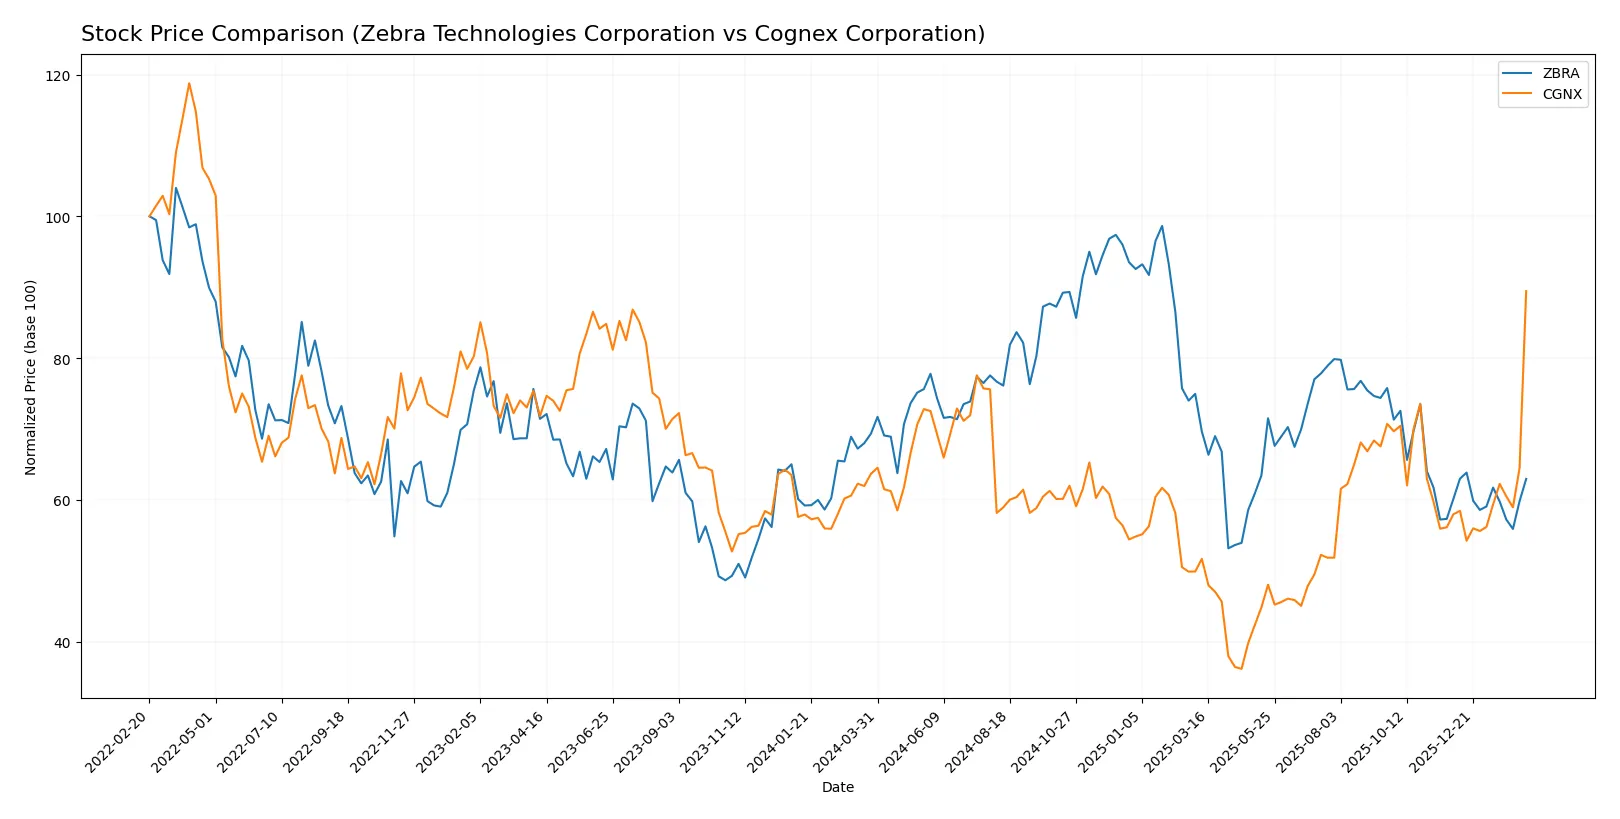
The past 12 months reveal contrasting price dynamics: Zebra Technologies fell sharply, while Cognex surged, showing strong buyer dominance and accelerating momentum.
Trend Comparison
Zebra Technologies shows a 9.2% price decline over the past year, signaling a bearish trend with decelerating momentum and high volatility between $223.49 and $414.61.
Cognex’s stock gained 40.48% over the same period, reflecting a bullish trend with accelerating momentum and lower volatility, hitting a low of $23.77 and a high of $58.79.
Cognex outperformed Zebra significantly, delivering the highest market returns and stronger price acceleration in the past year.
Target Prices
Analysts set a confident target consensus for Zebra Technologies and Cognex, reflecting bullish expectations.
| Company | Target Low | Target High | Consensus |
|---|---|---|---|
| Zebra Technologies Corporation | 291 | 335 | 319.75 |
| Cognex Corporation | 38 | 70 | 54.88 |
The consensus target for Zebra Technologies sits about 21% above its current price of $264.62, signaling strong upside potential. Cognex’s target consensus aligns closely with its current price of $58.79, suggesting limited near-term price appreciation.

Don’t Let Luck Decide Your Entry Point
Optimize your entry points with our advanced ProRealTime indicators. You’ll get efficient buy signals with precise price targets for maximum performance. Start outperforming now!
How do institutions grade them?
The following tables summarize recent institutional grades for Zebra Technologies Corporation and Cognex Corporation:
Zebra Technologies Corporation Grades
This table shows the latest grades issued by notable financial institutions for Zebra Technologies:
| Grading Company | Action | New Grade | Date |
|---|---|---|---|
| Needham | Maintain | Buy | 2026-02-13 |
| Citigroup | Maintain | Neutral | 2026-02-13 |
| Barclays | Maintain | Overweight | 2026-02-13 |
| Barclays | Maintain | Overweight | 2026-01-12 |
| Truist Securities | Maintain | Hold | 2025-12-18 |
| Truist Securities | Maintain | Hold | 2025-10-29 |
| Citigroup | Maintain | Neutral | 2025-10-29 |
| Barclays | Maintain | Overweight | 2025-10-29 |
| Citigroup | Maintain | Neutral | 2025-10-09 |
| Truist Securities | Maintain | Hold | 2025-10-08 |
Cognex Corporation Grades
This table presents recent institutional grades for Cognex Corporation from recognized sources:
| Grading Company | Action | New Grade | Date |
|---|---|---|---|
| Keybanc | Maintain | Overweight | 2026-02-13 |
| Barclays | Maintain | Overweight | 2026-02-13 |
| Needham | Maintain | Buy | 2026-02-12 |
| Barclays | Maintain | Overweight | 2026-01-12 |
| Truist Securities | Maintain | Hold | 2025-12-18 |
| Goldman Sachs | Upgrade | Buy | 2025-12-16 |
| JP Morgan | Downgrade | Underweight | 2025-12-03 |
| DA Davidson | Maintain | Neutral | 2025-11-03 |
| Baird | Maintain | Neutral | 2025-10-31 |
| Needham | Maintain | Buy | 2025-10-31 |
Which company has the best grades?
Both companies receive a mix of Buy and Overweight ratings from reputable firms. Cognex shows more rating volatility, including upgrades and downgrades. Zebra has steadier, predominantly Overweight and Neutral grades. Investors may interpret Cognex’s varied grades as higher risk, while Zebra’s consistency could suggest stable institutional confidence.
Risks specific to each company
The following categories identify the critical pressure points and systemic threats facing both firms in the 2026 market environment:
1. Market & Competition
Zebra Technologies Corporation
- Faces pressure from intense competition in communication equipment, with a wide product range but moderate margins.
Cognex Corporation
- Operates in hardware and equipment with rising competition and product commoditization risks.
2. Capital Structure & Debt
Zebra Technologies Corporation
- Moderate leverage with D/E at 0.78 and interest coverage favorable at 7.41x.
Cognex Corporation
- Extremely low leverage (D/E 0.05) but zero interest coverage indicates no recent earnings buffer for debt.
3. Stock Volatility
Zebra Technologies Corporation
- Beta of 1.656 signals relatively high volatility, typical in technology growth stocks.
Cognex Corporation
- Slightly lower beta at 1.534 but still above market average, indicating notable price swings.
4. Regulatory & Legal
Zebra Technologies Corporation
- Exposure to global regulatory environments in healthcare and logistics sectors.
Cognex Corporation
- Faces regulatory scrutiny in automotive and pharmaceutical sectors, which may tighten compliance costs.
5. Supply Chain & Operations
Zebra Technologies Corporation
- Complex supply chain for printers, scanners, and RFID components, vulnerable to material shortages.
Cognex Corporation
- Dependence on specialized components for machine vision products creates operational risk amid supply disruptions.
6. ESG & Climate Transition
Zebra Technologies Corporation
- Moderate ESG risks with growing demand for sustainable packaging and labeling solutions.
Cognex Corporation
- Increasing pressure to enhance energy efficiency and reduce emissions in manufacturing processes.
7. Geopolitical Exposure
Zebra Technologies Corporation
- Global footprint exposes it to trade tensions, especially US-China relations impacting supply chains.
Cognex Corporation
- Also globally exposed, with key markets sensitive to geopolitical shifts affecting tech exports.
Which company shows a better risk-adjusted profile?
Zebra’s main risk lies in unfavorable liquidity ratios and high valuation multiples, signaling potential financial strain if market conditions worsen. Cognex’s most pressing risk is its negligible interest coverage despite low debt, risking solvency if earnings falter. Cognex scores higher on financial stability metrics like Altman Z-Score (9.6 vs. 3.5) and Piotroski (7 vs. 6), indicating a stronger risk-adjusted profile. However, Cognex’s sky-high P/E ratio (52.8 vs. 29.5) raises valuation concerns. Overall, Cognex offers a more secure balance sheet, but Zebra’s operational scale and interest coverage provide a buffer. I remain cautious on Zebra’s weak current and quick ratios, which could impair short-term resilience.
Final Verdict: Which stock to choose?
Zebra Technologies showcases a superpower in operational efficiency, sustaining solid margins despite a challenging macro environment. Its point of vigilance lies in a current ratio below 1, signaling potential liquidity constraints. Zebra fits well in an aggressive growth portfolio that can tolerate medium-term cash flow variability.
Cognex Corporation’s strategic moat centers on a robust recurring revenue base fueled by its advanced machine vision technology. It offers a stronger liquidity position and a safer balance sheet compared to Zebra. Cognex appeals to investors seeking Growth at a Reasonable Price (GARP) with a preference for stability.
If you prioritize operational efficiency and can manage moderate liquidity risk, Zebra outshines with its compelling growth trajectory. However, if you seek better financial stability and a durable moat in technology, Cognex offers superior downside protection despite commanding a premium valuation. Both present nuanced scenarios tailored to distinct investor risk appetites.
Disclaimer: Investment carries a risk of loss of initial capital. The past performance is not a reliable indicator of future results. Be sure to understand risks before making an investment decision.
Go Further
I encourage you to read the complete analyses of Zebra Technologies Corporation and Cognex Corporation to enhance your investment decisions: