In today’s fast-evolving tech landscape, choosing the right software infrastructure company is critical for investors seeking growth and innovation. Zscaler, Inc. and Wix.com Ltd. both operate in cloud-based software but serve distinct yet overlapping markets—cybersecurity and website development platforms. This comparison highlights their strategic approaches and market potential, guiding you toward the most promising investment opportunity for your portfolio. Let’s explore which company stands out for your wallet.
Table of contents
Companies Overview
I will begin the comparison between Zscaler and Wix by providing an overview of these two companies and their main differences.
Zscaler Overview
Zscaler, Inc. is a cloud security company headquartered in San Jose, California, focused on providing secure access solutions for users, servers, and IoT devices to SaaS applications and internal resources. Its platform includes products for internet access, private access, digital experience monitoring, and workload segmentation to enhance security and compliance. Zscaler serves a diverse range of industries globally and employs over 7,300 people.
Wix Overview
Wix.com Ltd., based in Tel Aviv, Israel, develops and markets a cloud-based platform for website creation and web applications, targeting individuals and businesses worldwide. Its offerings include a drag-and-drop editor, AI-driven website design, business automation tools, payment solutions, and a marketplace for web services. Wix supports approximately 222M registered users and 6M premium subscribers with a workforce of about 4,400 employees.
Key similarities and differences
Both Zscaler and Wix operate in the software infrastructure industry with a focus on cloud-based solutions. Zscaler emphasizes cybersecurity and secure cloud access, while Wix centers on website development and business growth tools. They differ in their core customer bases and product offerings, with Zscaler targeting enterprises needing security and compliance, and Wix catering to users seeking website creation and digital business services.
Income Statement Comparison
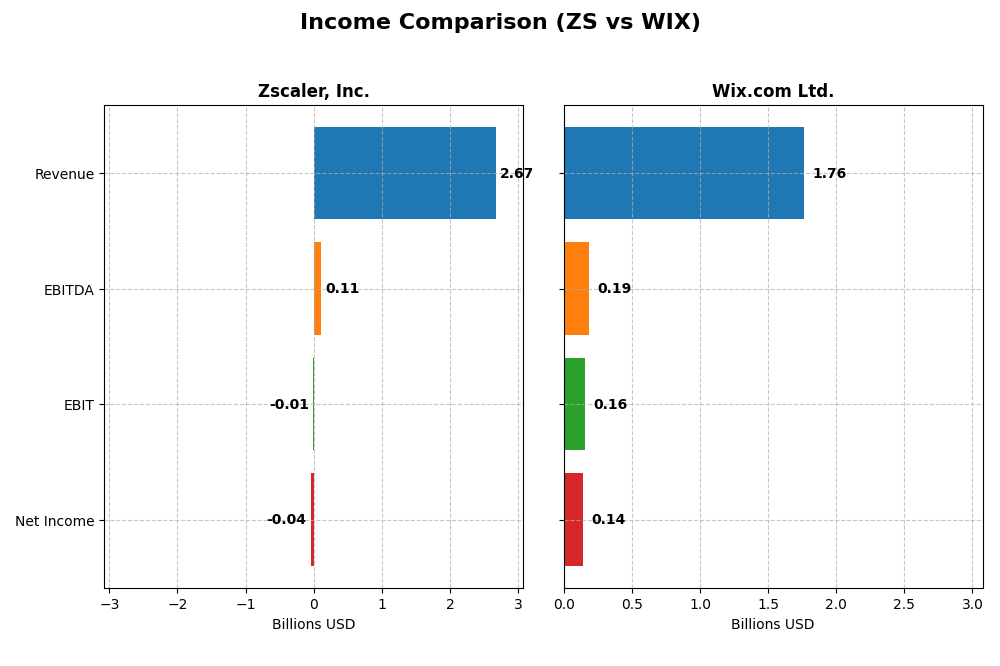
The table below compares the latest full fiscal year income statements of Zscaler, Inc. and Wix.com Ltd., highlighting key financial metrics for investor analysis.
| Metric | Zscaler, Inc. (ZS) | Wix.com Ltd. (WIX) |
|---|---|---|
| Market Cap | 34.1B | 4.5B |
| Revenue | 2.67B | 1.76B |
| EBITDA | 112M | 186M |
| EBIT | -8.8M | 155M |
| Net Income | -41M | 138M |
| EPS | -0.27 | 2.49 |
| Fiscal Year | 2025 | 2024 |
Income Statement Interpretations
Zscaler, Inc.
Zscaler’s revenue showed strong growth from 2021 to 2025, reaching $2.67B in 2025, with net income losses narrowing significantly. Gross margin remained high at 76.87%, indicating efficient cost management, though EBIT and net margins stayed negative. In 2025, revenue growth accelerated 23.31%, and net margin improved by 41.71%, reflecting operational progress despite ongoing losses.
Wix.com Ltd.
Wix demonstrated steady revenue growth from 2020 to 2024, achieving $1.76B in 2024, with net income shifting from negative to a positive $138M. Gross margin was favorable at 67.93%, and EBIT margin improved to 8.81%. The latest year saw revenue rise 12.74%, with substantial net margin growth of 270.25% and EPS growth surpassing 300%, signaling strong profitability gains.
Which one has the stronger fundamentals?
Both companies exhibit favorable income statement trends, but Wix’s positive net income and EBIT margins contrast with Zscaler’s ongoing losses despite improving metrics. Wix also shows a higher percentage of favorable income metrics and stronger recent profitability growth, while Zscaler benefits from a higher gross margin and rapid revenue expansion. The fundamentals reflect different growth and profitability profiles.
Financial Ratios Comparison
The table below presents a side-by-side comparison of key financial ratios for Zscaler, Inc. and Wix.com Ltd., based on their most recent fiscal year data.
| Ratios | Zscaler, Inc. (ZS) | Wix.com Ltd. (WIX) |
|---|---|---|
| ROE | -2.31% | -175.57% |
| ROIC | -3.18% | 9.13% |
| P/E | -1063 | 86.21 |
| P/B | 24.51 | -151.35 |
| Current Ratio | 2.01 | 0.84 |
| Quick Ratio | 2.01 | 0.84 |
| D/E (Debt-to-Equity) | 1.00 | -12.31 |
| Debt-to-Assets | 28.0% | 50.7% |
| Interest Coverage | -13.49 | 25.92 |
| Asset Turnover | 0.42 | 0.92 |
| Fixed Asset Turnover | 4.22 | 3.33 |
| Payout Ratio | 0 | 0 |
| Dividend Yield | 0 | 0 |
Interpretation of the Ratios
Zscaler, Inc.
Zscaler presents a mix of strong and weak ratios, with a favorable current and quick ratio of 2.01, indicating solid short-term liquidity. However, profitability metrics such as net margin (-1.55%), ROE (-2.31%), and ROIC (-3.18%) are unfavorable, raising concerns about operational efficiency. The company does not pay dividends, reflecting a reinvestment strategy likely focused on growth and innovation.
Wix.com Ltd.
Wix.com shows neutral to unfavorable ratios, including a net margin of 7.86% (neutral) and a highly negative ROE at -175.57%, signaling potential profitability challenges. The current ratio of 0.84 is unfavorable, pointing to liquidity pressures. Wix.com does not pay dividends, consistent with its growth phase and investment in product development rather than returning cash to shareholders.
Which one has the best ratios?
Both companies exhibit slightly unfavorable overall ratio profiles, but Zscaler has a higher proportion of favorable liquidity and asset turnover ratios compared to Wix.com. Conversely, Wix.com’s stronger interest coverage and some favorable turnover metrics are offset by weaker liquidity and profitability indicators. Neither company demonstrates a distinctly superior ratio set based on the latest fiscal data.
Strategic Positioning
This section compares the strategic positioning of Zscaler, Inc. and Wix.com Ltd., focusing on Market position, Key segments, and exposure to disruption:
Zscaler, Inc.
- Leading cloud security provider with robust demand, facing competitive pressure in cybersecurity market.
- Focuses on cloud security solutions including Internet Access, Private Access, and workload segmentation.
- Positioned in software infrastructure with evolving cloud security technologies, exposed to tech disruptions.
Wix.com Ltd.
- Cloud-based website platform with strong user base, competing in web development and business solutions.
- Operates in creative subscriptions and business solutions, offering website creation and management tools.
- Faces technological disruption risks in digital platform innovation and AI-driven customer tools.
Zscaler, Inc. vs Wix.com Ltd. Positioning
Zscaler concentrates on cloud security infrastructure, driven by enterprise demand, while Wix diversifies across creative subscription and business solutions. Zscaler’s scale and niche focus contrast with Wix’s broader digital platform approach, each with distinct market and technological challenges.
Which has the best competitive advantage?
Both companies are slightly unfavorable in MOAT evaluation, shedding value but showing growing ROIC trends. Their competitive advantages are challenged, though improving profitability suggests potential for future value creation.
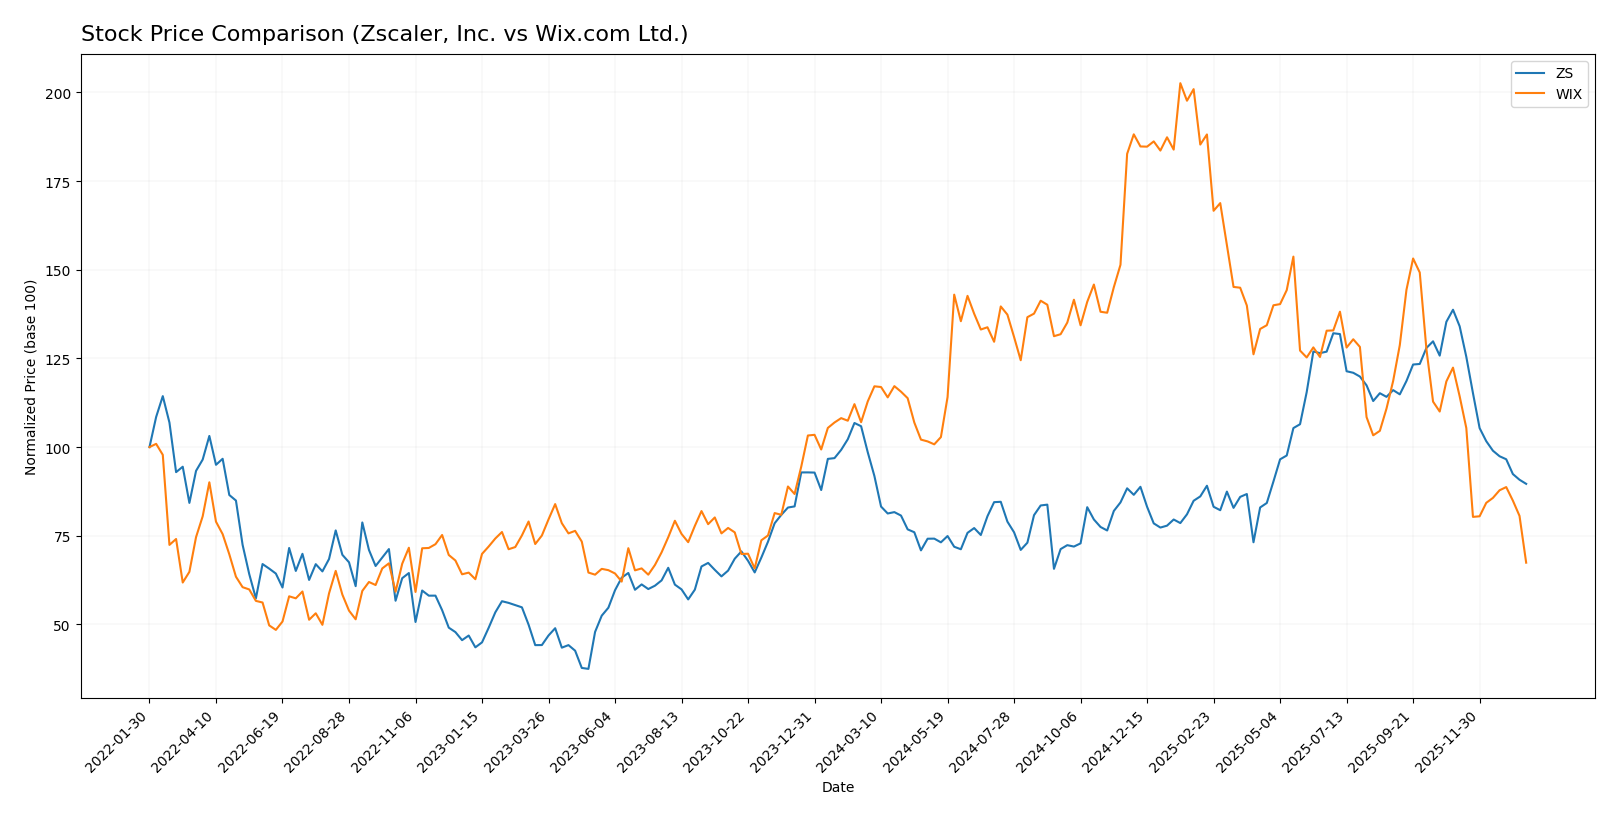
Stock Comparison
The stock prices of Zscaler, Inc. (ZS) and Wix.com Ltd. (WIX) over the past 12 months have shown significant bearish trends, marked by notable declines and decelerating momentum in both cases.
Trend Analysis
Zscaler, Inc. experienced a 9.03% price decline over the past year, reflecting a bearish trend with deceleration. The stock ranged between 156.78 and 331.14, exhibiting high volatility with a 47.11 standard deviation.
Wix.com Ltd. showed a sharper decrease of 40.28% over the same period, also bearish with deceleration. Its price fluctuated between 80.16 and 240.89, with a lower volatility at a standard deviation of 34.39.
Comparing the two, Zscaler, Inc. delivered the higher market performance, with a smaller percentage loss than Wix.com Ltd. during the analyzed 12-month period.
Target Prices
Here is the latest analyst target consensus for Zscaler, Inc. and Wix.com Ltd.
| Company | Target High | Target Low | Consensus |
|---|---|---|---|
| Zscaler, Inc. | 360 | 260 | 311.41 |
| Wix.com Ltd. | 210 | 70 | 160.27 |
Analysts expect Zscaler’s stock to appreciate significantly from its current price of $213.98, targeting a consensus around $311.41. Wix.com also shows upside potential with a consensus target of $160.27 versus a current price near $80.16.
Analyst Opinions Comparison
This section compares analysts’ ratings and grades for Zscaler, Inc. (ZS) and Wix.com Ltd. (WIX):
Rating Comparison
ZS Rating
- Rating: C- indicating a very favorable overall evaluation.
- Discounted Cash Flow Score: 4, considered favorable for valuation.
- ROE Score: 1, very unfavorable, showing low efficiency in equity profit.
- ROA Score: 1, very unfavorable, reflecting poor asset utilization.
- Debt To Equity Score: 1, very unfavorable, indicating higher financial risk.
- Overall Score: 1, very unfavorable summary of financial health.
WIX Rating
- Rating: C indicating a very favorable overall evaluation.
- Discounted Cash Flow Score: 3, moderate valuation assessment.
- ROE Score: 1, very unfavorable, indicating low efficiency in equity profit.
- ROA Score: 4, favorable, showing good asset utilization.
- Debt To Equity Score: 1, very unfavorable, indicating higher financial risk.
- Overall Score: 2, moderate summary of financial health.
Which one is the best rated?
Based strictly on the provided data, WIX holds a slightly better overall rating and a more favorable ROA score compared to ZS. However, both companies share very unfavorable scores on ROE and debt-to-equity, with WIX having a moderate DCF and overall score advantage.
Scores Comparison
Here is a comparison of the financial scores for Zscaler, Inc. and Wix.com Ltd.:
Zscaler, Inc. Scores
- Altman Z-Score: 4.89, indicating a safe zone with low bankruptcy risk.
- Piotroski Score: 3, classified as very weak financial strength.
Wix.com Ltd. Scores
- Altman Z-Score: 1.83, in the grey zone signaling moderate bankruptcy risk.
- Piotroski Score: 6, representing average financial strength.
Which company has the best scores?
Zscaler shows a significantly stronger Altman Z-Score, suggesting better bankruptcy safety. Wix, however, has a higher Piotroski Score, indicating stronger overall financial health. Each company leads in a different score category.
Grades Comparison
Here is a comparison of the recent grades issued by established financial institutions for Zscaler, Inc. and Wix.com Ltd.:
Zscaler, Inc. Grades
The following table summarizes Zscaler’s latest grades from well-known grading firms:
| Grading Company | Action | New Grade | Date |
|---|---|---|---|
| Citigroup | Maintain | Buy | 2026-01-13 |
| Keybanc | Maintain | Overweight | 2026-01-12 |
| Piper Sandler | Maintain | Neutral | 2026-01-05 |
| RBC Capital | Maintain | Outperform | 2026-01-05 |
| Mizuho | Upgrade | Outperform | 2025-12-16 |
| Bernstein | Downgrade | Market Perform | 2025-12-01 |
| Citigroup | Maintain | Buy | 2025-12-01 |
| JP Morgan | Maintain | Overweight | 2025-11-26 |
| Baird | Maintain | Outperform | 2025-11-26 |
| BTIG | Maintain | Buy | 2025-11-26 |
Overall, Zscaler’s grades lean toward Buy and Outperform ratings, with a recent upgrade and one downgrade observed, indicating generally positive analyst sentiment with some caution.
Wix.com Ltd. Grades
The following table shows Wix.com’s recent grades from reputable investment firms:
| Grading Company | Action | New Grade | Date |
|---|---|---|---|
| Morgan Stanley | Maintain | Overweight | 2026-01-15 |
| Wells Fargo | Maintain | Overweight | 2025-12-19 |
| Cantor Fitzgerald | Maintain | Overweight | 2025-12-11 |
| Citigroup | Maintain | Buy | 2025-11-20 |
| Citizens | Maintain | Market Outperform | 2025-11-20 |
| Cantor Fitzgerald | Maintain | Overweight | 2025-11-20 |
| Scotiabank | Maintain | Sector Outperform | 2025-11-20 |
| Evercore ISI Group | Maintain | Outperform | 2025-11-20 |
| Needham | Maintain | Buy | 2025-11-20 |
| B. Riley Securities | Maintain | Buy | 2025-11-20 |
Wix.com consistently receives Overweight and Buy ratings, complemented by several outperform ratings, reflecting strong and stable analyst confidence.
Which company has the best grades?
Both Zscaler and Wix.com maintain predominantly positive grades with Buy and Outperform consensus. However, Wix.com displays slightly more consistent Overweight and Outperform ratings without recent downgrades, suggesting steadier analyst support. This may influence investors seeking more stable grade trends in their portfolio decisions.
Strengths and Weaknesses
Below is a comparison of key strengths and weaknesses for Zscaler, Inc. (ZS) and Wix.com Ltd. (WIX) based on the latest financial and strategic data available.
| Criterion | Zscaler, Inc. (ZS) | Wix.com Ltd. (WIX) |
|---|---|---|
| Diversification | Primarily focused on cloud security; limited product range. | More diversified with Business Solutions and Creative Subscription segments. |
| Profitability | Negative net margin (-1.55%) and ROIC (-3.18%); shedding value but improving ROIC trend. | Positive net margin (7.86%) and positive ROIC (9.13%); slightly unfavorable moat but growing profitability. |
| Innovation | Strong innovation in cybersecurity cloud services. | Innovative platform for website creation and business solutions. |
| Global presence | Established global presence in cybersecurity market. | Strong global customer base, especially in SMBs for web services. |
| Market Share | Significant share in cloud security but facing intense competition. | Growing market share in website creation and online business tools. |
Key takeaways: Both companies show growing profitability trends despite currently shedding value relative to their cost of capital. Wix benefits from greater diversification and positive margins, while Zscaler leads in innovation within a specialized niche but struggles with profitability. Investors should weigh growth potential against current financial challenges.
Risk Analysis
Below is a comparative table presenting key risks for Zscaler, Inc. (ZS) and Wix.com Ltd. (WIX) based on the most recent financial and market data available.
| Metric | Zscaler, Inc. (ZS) | Wix.com Ltd. (WIX) |
|---|---|---|
| Market Risk | Beta 1.02, moderate volatility with price range 165-337 USD | Beta 1.42, higher volatility with price range 80-247 USD |
| Debt Level | Debt-to-assets 28%, Debt/Equity 1.0 (neutral) | Debt-to-assets 51%, Debt/Equity -12.31 (favorable but unusual negative ratio) |
| Regulatory Risk | US-based, moderate exposure to tech regulations | Israel-based, subject to international data and privacy laws |
| Operational Risk | Cloud security operations, risks in SaaS performance | Cloud platform for web creation, risks in platform reliability and user retention |
| Environmental Risk | Low direct environmental impact, focus on data centers | Low direct environmental impact, global server infrastructure |
| Geopolitical Risk | US domestic risks, global client base | Based in Israel, exposed to Middle East geopolitical tensions |
In 2026, Zscaler’s moderate market risk and manageable debt levels contrast with its unfavorable profitability metrics and financial ratios, signaling operational and financial risk. Wix faces higher market volatility and elevated debt-to-assets ratio, plus geopolitical exposure given its location. The most impactful risks are Wix’s financial leverage and geopolitical exposure, and Zscaler’s operational profitability challenges despite a safer financial distress score. Investors should weigh these risks carefully within their portfolio diversification and risk tolerance frameworks.
Which Stock to Choose?
Zscaler, Inc. (ZS) shows a favorable income evolution with significant revenue and net income growth, despite negative profitability ratios and a slightly unfavorable global financial ratio evaluation. Its debt level is moderate, and the company holds a very favorable overall rating.
Wix.com Ltd. (WIX) demonstrates steady income growth and favorable profitability metrics, though some financial ratios and debt indicators are less favorable. Its global financial ratio evaluation is slightly unfavorable, with a very favorable company rating albeit moderate overall scores.
For investors, ZS’s strong rating and robust income growth could appeal to those prioritizing growth potential, while WIX’s stable profitability and moderate rating might be more suitable for investors seeking balance between growth and financial stability. Both companies show value destruction but improving profitability, suggesting cautious consideration based on risk tolerance.
Disclaimer: Investment carries a risk of loss of initial capital. The past performance is not a reliable indicator of future results. Be sure to understand risks before making an investment decision.
Go Further
I encourage you to read the complete analyses of Zscaler, Inc. and Wix.com Ltd. to enhance your investment decisions: