Xcel Energy Inc. (XEL) and WEC Energy Group, Inc. (WEC) are two leading players in the regulated electric utility sector, both committed to delivering reliable energy across multiple U.S. states. Their focus on integrating renewable sources and expanding infrastructure highlights an innovative approach to sustainable energy. This comparison aims to help investors like you identify which company offers the most compelling investment opportunity in 2026. Let’s explore their strengths and potential together.
Table of contents
Companies Overview
I will begin the comparison between Xcel Energy Inc. and WEC Energy Group, Inc. by providing an overview of these two companies and their main differences.
Xcel Energy Inc. Overview
Xcel Energy Inc. is a major player in the regulated electric utility sector, serving about 3.7M electricity and 2.1M natural gas customers across multiple states including Colorado and Minnesota. Founded in 1909 and headquartered in Minneapolis, it operates through diversified energy sources such as coal, nuclear, natural gas, hydroelectric, solar, and wind. Its mission focuses on generating, purchasing, transmitting, and distributing electricity and natural gas efficiently and sustainably.
WEC Energy Group, Inc. Overview
WEC Energy Group, Inc. provides regulated natural gas and electricity services primarily in Wisconsin and Illinois. Incorporated in 1981 and based in Milwaukee, it manages extensive infrastructure including over 35,000 miles of electric distribution lines and 50,900 miles of natural gas mains. WEC’s operations span generation from coal, natural gas, hydroelectric, wind, and solar, alongside electric transmission and nonregulated renewable energy services, emphasizing reliability and infrastructure development.
Key similarities and differences
Both companies operate in the regulated electric utility industry with a strong focus on sustainable energy sources like wind and solar. Xcel Energy serves a broader geographic area and a larger customer base, while WEC Energy emphasizes infrastructure scale and transmission services. Although both provide natural gas and electricity, WEC has a notable presence in electric transmission and non-utility energy infrastructure, distinguishing its business model from Xcel’s diversified energy generation and retail focus.
Income Statement Comparison
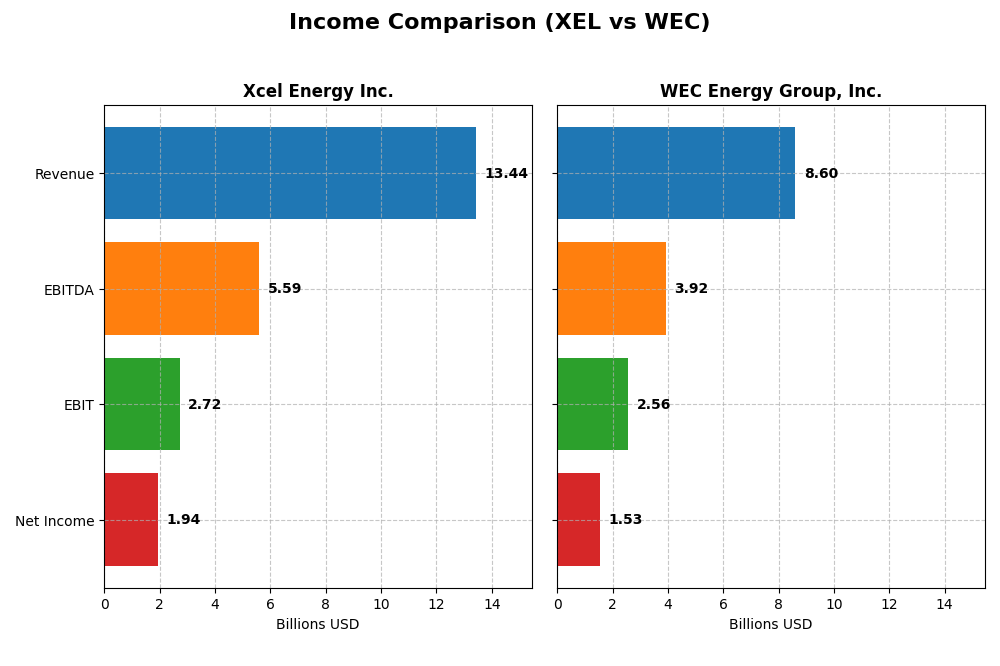
This table presents a side-by-side comparison of key income statement metrics for Xcel Energy Inc. and WEC Energy Group, Inc. for the fiscal year 2024.
| Metric | Xcel Energy Inc. (XEL) | WEC Energy Group, Inc. (WEC) |
|---|---|---|
| Market Cap | 43.9B | 33.5B |
| Revenue | 13.44B | 8.60B |
| EBITDA | 5.59B | 3.92B |
| EBIT | 2.72B | 2.56B |
| Net Income | 1.94B | 1.53B |
| EPS | 3.44 | 4.81 |
| Fiscal Year | 2024 | 2024 |
Income Statement Interpretations
Xcel Energy Inc.
Xcel Energy’s revenue increased by 16.61% from 2020 to 2024, while net income grew 31.43%, reflecting solid profitability gains. Margins improved overall, with a gross margin of 45.74% and net margin expanding 12.71% over the period. However, revenue declined by 5.39% in 2024, though net margin and EPS showed favorable growth, indicating improved operational efficiency.
WEC Energy Group, Inc.
WEC Energy Group saw revenue growth of 18.76% and net income growth of 27.25% over 2020-2024, accompanied by strong margin performance. The EBIT margin stood at 29.79%, with net margin at 17.77%. Despite a 3.3% revenue drop in 2024, gross profit, EBIT, and net margin all improved, supported by favorable operating expense trends and strong EPS growth.
Which one has the stronger fundamentals?
Both companies show favorable income statement trends with margin improvements and solid net income growth. WEC Energy exhibits higher EBIT and net margins, stronger one-year margin growth, and a higher percentage of favorable income metrics. Xcel Energy demonstrates more conservative interest expenses but experienced a steeper recent revenue decline. Overall, WEC’s fundamentals appear somewhat stronger based on margin and growth consistency.
Financial Ratios Comparison
The table below compares key financial ratios for Xcel Energy Inc. (XEL) and WEC Energy Group, Inc. (WEC) based on their most recent fiscal year data (2024).
| Ratios | Xcel Energy Inc. (XEL) | WEC Energy Group, Inc. (WEC) |
|---|---|---|
| ROE | 9.92% | 12.30% |
| ROIC | 4.59% | 4.14% |
| P/E | 19.64 | 19.46 |
| P/B | 1.95 | 2.39 |
| Current Ratio | 0.67 | 0.60 |
| Quick Ratio | 0.57 | 0.43 |
| D/E (Debt-to-Equity) | 1.55 | 1.64 |
| Debt-to-Assets | 43.13% | 42.92% |
| Interest Coverage | 2.02 | 2.64 |
| Asset Turnover | 0.19 | 0.18 |
| Fixed Asset Turnover | 0.23 | 0.25 |
| Payout Ratio | 60.69% | 69.10% |
| Dividend Yield | 3.09% | 3.55% |
Interpretation of the Ratios
Xcel Energy Inc.
Xcel Energy shows mixed financial ratios with favorable net margin (14.4%) and dividend yield (3.09%), but several unfavorable metrics, including return on equity (9.92%), return on invested capital (4.59%), and liquidity ratios below 1.0. Debt levels and asset turnover also raise concerns. The company pays dividends with a steady yield, but coverage by free cash flow appears weak, indicating possible sustainability risks.
WEC Energy Group, Inc.
WEC Energy Group exhibits a stronger net margin (17.77%) and a slightly higher dividend yield (3.55%) compared to Xcel. Its return on equity is neutral at 12.3%, while return on invested capital is unfavorable (4.14%). Liquidity and leverage ratios remain under pressure, but interest coverage is marginally better. Dividend payments are supported but caution is advised on cash flow coverage and debt levels.
Which one has the best ratios?
Both companies present slightly unfavorable global ratio profiles, balancing favorable metrics like net margin and dividend yield against weaknesses in returns and liquidity. WEC Energy Group holds a modest edge with a higher net margin and dividend yield, and better interest coverage, though both face challenges in asset turnover and debt management.
Strategic Positioning
This section compares the strategic positioning of Xcel Energy Inc. and WEC Energy Group, Inc., including market position, key segments, and exposure to technological disruption:
Xcel Energy Inc.
- Larger market cap with NASDAQ listing, facing regulated electric utility competition.
- Focus on regulated electric and natural gas utilities serving multiple states, diverse energy sources.
- Generates electricity from a broad mix including coal, nuclear, renewables, with infrastructure investments.
WEC Energy Group, Inc.
- Smaller market cap on NYSE, operating in regulated electric utility sector with competitive pressure.
- Diversified across Wisconsin, Illinois, other states, electric transmission, and non-utility energy infrastructure.
- Similar energy mix, with significant infrastructure assets including extensive transmission and distribution networks.
Xcel Energy Inc. vs WEC Energy Group, Inc. Positioning
Xcel Energy has a more diversified geographic footprint and business segments centered on regulated utilities and renewables. WEC Energy shows a regional concentration with added focus on non-utility infrastructure. Both face regulated market constraints but differ in scale and segment breadth.
Which has the best competitive advantage?
Both companies are slightly unfavorable in MOAT evaluation due to ROIC below WACC but show growing profitability trends. Neither currently demonstrates a strong sustainable competitive advantage based on provided MOAT data.
Stock Comparison
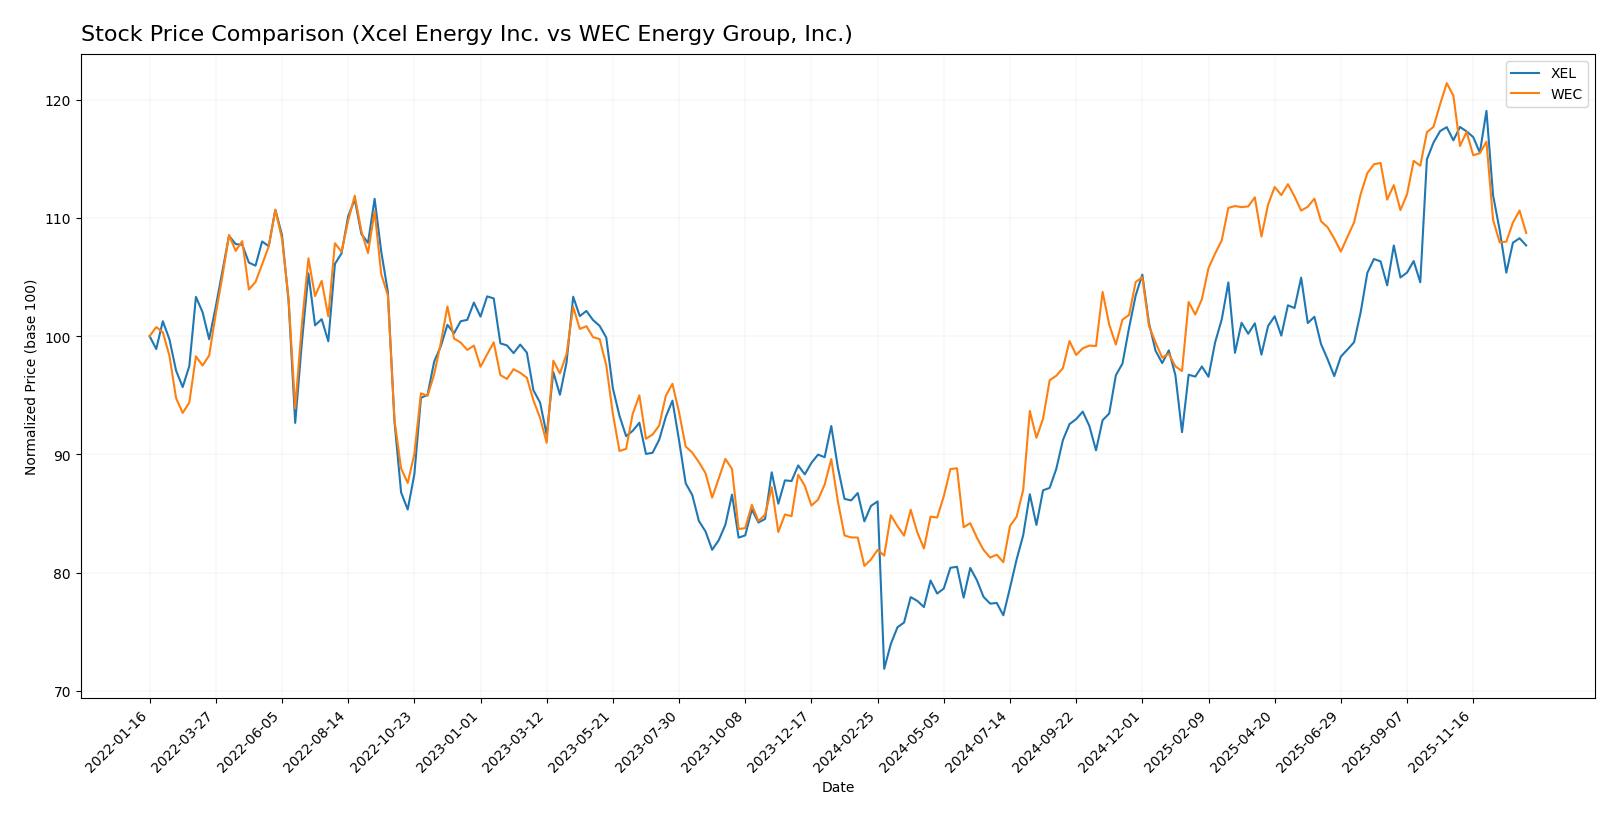
The stock prices of Xcel Energy Inc. (XEL) and WEC Energy Group, Inc. (WEC) experienced notable bullish trends over the past 12 months, followed by recent deceleration and downward corrections in the last quarter.
Trend Analysis
Xcel Energy Inc. (XEL) showed a 25.72% price increase over the past year, indicating a strong bullish trend with deceleration. The stock ranged between 49.57 and 82.11, with recent weeks showing a -7.63% correction.
WEC Energy Group, Inc. (WEC) recorded a 34.05% price rise over 12 months, also bullish but decelerating. It reached a high of 116.84 and a low of 77.85, with a recent decline of -9.65% in the last quarter.
Comparing both, WEC delivered the highest market performance over the past year, outperforming XEL by approximately 8.33 percentage points in total price appreciation.
Target Prices
Analysts present a positive target price consensus for both Xcel Energy Inc. and WEC Energy Group, Inc.
| Company | Target High | Target Low | Consensus |
|---|---|---|---|
| Xcel Energy Inc. | 96 | 81 | 87 |
| WEC Energy Group, Inc. | 136 | 105 | 122.67 |
The target consensus for Xcel Energy at $87 is significantly above its current price of $74.26, indicating upside potential. Similarly, WEC Energy Group’s consensus target of $122.67 exceeds its current price of $104.65, reflecting bullish analyst expectations.
Analyst Opinions Comparison
This section compares analysts’ ratings and grades for Xcel Energy Inc. and WEC Energy Group, Inc.:
Rating Comparison
Xcel Energy Inc. Rating
- Rating: C+ with a “Very Favorable” status
- Discounted Cash Flow Score: 4, indicating a favorable value
- ROE Score: 3, moderate efficiency in profit generation
- ROA Score: 2, moderate utilization of assets
- Debt To Equity Score: 1, very unfavorable financial risk
- Overall Score: 2, moderate financial standing
WEC Energy Group, Inc. Rating
- Rating: B- with a “Very Favorable” status
- Discounted Cash Flow Score: 1, indicating a very unfavorable value
- ROE Score: 4, favorable efficiency in profit generation
- ROA Score: 4, favorable utilization of assets
- Debt To Equity Score: 2, moderate financial risk
- Overall Score: 3, moderate financial standing
Which one is the best rated?
WEC Energy Group, Inc. holds a higher overall rating (B-) compared to Xcel Energy’s C+, supported by stronger ROE and ROA scores, despite a less favorable discounted cash flow score. Overall, WEC is rated better based on the provided data.
Scores Comparison
The following table compares the Altman Z-Score and Piotroski Score for Xcel Energy and WEC Energy Group:
XEL Scores
- Altman Z-Score: 0.89, in distress zone, indicating high bankruptcy risk.
- Piotroski Score: 5, average financial strength based on nine criteria.
WEC Scores
- Altman Z-Score: 1.14, in distress zone, indicating high bankruptcy risk.
- Piotroski Score: 6, average financial strength based on nine criteria.
Which company has the best scores?
WEC has marginally better scores with a higher Altman Z-Score and Piotroski Score, though both remain in the distress zone and indicate average financial strength.
Grades Comparison
Here is the comparison of recent grades and ratings from reputable financial institutions for the two companies:
Xcel Energy Inc. Grades
The following table summarizes recent grades from well-known grading companies for Xcel Energy Inc.:
| Grading Company | Action | New Grade | Date |
|---|---|---|---|
| UBS | Maintain | Neutral | 2025-12-17 |
| Keybanc | Maintain | Overweight | 2025-12-12 |
| JP Morgan | Maintain | Overweight | 2025-12-11 |
| Barclays | Maintain | Overweight | 2025-11-05 |
| Citigroup | Maintain | Buy | 2025-11-03 |
| UBS | Maintain | Neutral | 2025-10-31 |
| Mizuho | Maintain | Outperform | 2025-10-27 |
| Jefferies | Maintain | Buy | 2025-10-16 |
| Keybanc | Maintain | Overweight | 2025-10-15 |
| BMO Capital | Maintain | Outperform | 2025-10-15 |
Xcel Energy shows a consistent pattern of positive ratings with multiple “Buy,” “Overweight,” and “Outperform” grades, suggesting general confidence among analysts.
WEC Energy Group, Inc. Grades
The following table presents the latest grades from recognized grading companies for WEC Energy Group, Inc.:
| Grading Company | Action | New Grade | Date |
|---|---|---|---|
| B of A Securities | Maintain | Neutral | 2025-12-31 |
| UBS | Maintain | Neutral | 2025-12-17 |
| Barclays | Maintain | Underweight | 2025-12-16 |
| Keybanc | Maintain | Overweight | 2025-12-12 |
| JP Morgan | Maintain | Neutral | 2025-12-11 |
| Scotiabank | Maintain | Sector Outperform | 2025-10-31 |
| BMO Capital | Maintain | Market Perform | 2025-10-21 |
| Barclays | Maintain | Equal Weight | 2025-10-21 |
| Keybanc | Maintain | Overweight | 2025-10-15 |
| UBS | Maintain | Neutral | 2025-10-10 |
WEC Energy Group’s grades are more mixed, with several “Neutral,” some “Overweight,” and a few less favorable marks like “Underweight,” indicating a more cautious analyst stance.
Which company has the best grades?
Xcel Energy Inc. has received generally stronger and more consistent positive grades compared to WEC Energy Group, Inc., whose ratings are more mixed and include lower assessments. This contrast may influence investors seeking higher analyst conviction in their portfolio choices.
Strengths and Weaknesses
Below is a comparison table summarizing the key strengths and weaknesses of Xcel Energy Inc. (XEL) and WEC Energy Group, Inc. (WEC) based on their recent financial performance, market position, and operational metrics.
| Criterion | Xcel Energy Inc. (XEL) | WEC Energy Group, Inc. (WEC) |
|---|---|---|
| Diversification | Strong focus on regulated electric (22.3B) and natural gas (4.5B) segments; limited other segments | Revenue diversified across Wisconsin (6.3B), Illinois (1.6B), Non-Utility Energy Infra (0.7B), and other states |
| Profitability | Net margin 14.4% (favorable); ROIC 4.6% (unfavorable vs WACC 5.1%); value shedding but improving ROIC trend | Net margin 17.8% (favorable); ROIC 4.1% (unfavorable vs WACC 5.3%); also shedding value but ROIC growing |
| Innovation | Moderate innovation, primarily in renewable energy transition and grid modernization | Moderate innovation focused on infrastructure upgrades and clean energy investments |
| Global presence | Primarily regional U.S. utility operations, no significant international exposure | Also regional, focused on Midwest U.S., no global operations |
| Market Share | Leading regulated electric and gas utility in service areas with steady revenue growth | Strong presence in Wisconsin and Illinois markets, significant utility infrastructure ownership |
Key takeaways: Both companies operate in regulated utilities with strong regional market positions and stable revenue bases. They currently shed value as ROIC remains below WACC, though improving profitability trends suggest operational efficiencies are progressing. Neither company has significant global diversification, and both face challenges in innovation pace and capital efficiency. Cautious investors should weigh their stable dividends against value creation limitations.
Risk Analysis
Below is a comparative risk assessment table for Xcel Energy Inc. (XEL) and WEC Energy Group, Inc. (WEC) based on the most recent 2024 data:
| Metric | Xcel Energy Inc. (XEL) | WEC Energy Group, Inc. (WEC) |
|---|---|---|
| Market Risk | Low (Beta 0.47) | Low (Beta 0.57) |
| Debt Level | High (Debt-to-Equity 1.55) | High (Debt-to-Equity 1.64) |
| Regulatory Risk | Moderate | Moderate |
| Operational Risk | Moderate | Moderate |
| Environmental Risk | Elevated (coal and natural gas assets) | Elevated (coal and natural gas assets) |
| Geopolitical Risk | Low (US-focused operations) | Low (US-focused operations) |
Both companies face significant debt levels, which heightens financial risk. Their exposure to regulatory shifts and environmental policies is moderate but critical given their reliance on fossil fuels. Market risk is relatively low due to stable utility sectors and low beta values. Operational and geopolitical risks remain moderate to low.
Xcel Energy’s Altman Z-score of 0.89 and WEC’s 1.14 place them in the distress zone, indicating heightened bankruptcy risk. This is a crucial factor for risk-averse investors. The companies’ reliance on coal and natural gas also exposes them to evolving environmental regulations that could impact future profitability.
Which Stock to Choose?
Xcel Energy Inc. (XEL) shows a favorable income statement with solid net margin growth of 12.71% over 2020-2024, yet it faces a slightly unfavorable global financial ratios evaluation, marked by weaknesses in liquidity and leverage metrics. Its rating is C+ with moderate overall financial scores and signs of value destruction despite improving profitability.
WEC Energy Group, Inc. (WEC) presents a more robust income evolution, with 85.71% favorable income statement metrics and better net margin growth of 7.15%. It also has a slightly unfavorable but relatively stronger financial ratios profile and a higher rating of B-, supported by moderate to favorable scores in profitability and solvency, though it too shows value destruction signs.
Considering ratings and comprehensive financial evaluations, WEC might appear to better suit investors seeking moderate risk and growth, while XEL could be more aligned with those accepting some financial risk for potential improving profitability. Each stock’s profile suggests different risk tolerances and investment focuses could influence preference.
Disclaimer: Investment carries a risk of loss of initial capital. The past performance is not a reliable indicator of future results. Be sure to understand risks before making an investment decision.
Go Further
I encourage you to read the complete analyses of Xcel Energy Inc. and WEC Energy Group, Inc. to enhance your investment decisions: