In the competitive pharmaceutical industry, Zoetis Inc. (ZTS) and Viatris Inc. (VTRS) stand out as key players specializing in specialty and generic drug manufacturing. Both companies serve global markets with innovative healthcare solutions, yet they differ in scale, product focus, and strategic approaches. This comparison aims to help investors navigate these nuances and identify which company presents the most compelling investment opportunity in 2026. Let’s explore their strengths and risks together.
Table of contents
Companies Overview
I will begin the comparison between Zoetis and Viatris by providing an overview of these two companies and their main differences.
Zoetis Overview
Zoetis Inc. specializes in the discovery, development, and commercialization of animal health products, including medicines, vaccines, and diagnostics. It serves a broad range of species such as livestock and companion animals. Zoetis markets its products primarily to veterinarians, livestock producers, and retail outlets globally. The company operates in the specialty and generic drug manufacturing sector and is headquartered in Parsippany, New Jersey.
Viatris Overview
Viatris Inc. operates worldwide as a healthcare company offering a wide portfolio of prescription brand drugs, generics, biosimilars, and active pharmaceutical ingredients. Its business spans developed and emerging markets with products addressing numerous therapeutic areas. Viatris distributes through diverse channels including wholesalers, retailers, and specialty pharmacies. Headquartered in Canonsburg, Pennsylvania, it is positioned within the specialty and generic drug manufacturing industry.
Key similarities and differences
Both Zoetis and Viatris operate in the drug manufacturing industry focusing on specialty and generic products. Zoetis centers on animal health while Viatris targets human healthcare with a broader therapeutic scope and geographic segmentation. Viatris has a significantly larger workforce and market capitalization, reflecting its diverse product range and global reach. Zoetis’s expertise is specialized in veterinary medicines, contrasting with Viatris’s comprehensive pharmaceutical offerings.
Income Statement Comparison
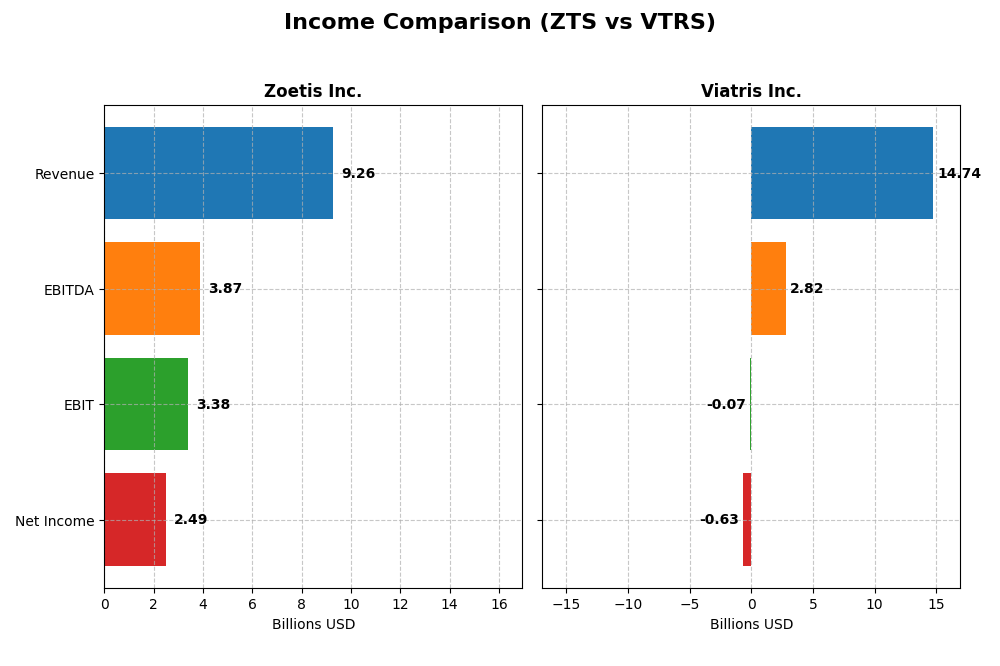
The table below presents a side-by-side comparison of key income statement metrics for Zoetis Inc. and Viatris Inc. for the fiscal year 2024.
| Metric | Zoetis Inc. (ZTS) | Viatris Inc. (VTRS) |
|---|---|---|
| Market Cap | 56B | 14.7B |
| Revenue | 9.26B | 14.7B |
| EBITDA | 3.87B | 2.82B |
| EBIT | 3.38B | -73M |
| Net Income | 2.49B | -634M |
| EPS | 5.47 | -0.53 |
| Fiscal Year | 2024 | 2024 |
Income Statement Interpretations
Zoetis Inc.
Zoetis has shown consistent growth in revenue and net income from 2020 to 2024, with a 38.7% increase in revenue and a 51.8% rise in net income. Margins remain strong, with a gross margin of 69.1% and a net margin near 27%. The 2024 year saw revenue growth of 8.3% and net income increasing by 7.9%, although net margin slightly contracted by 2.1%, suggesting some margin pressure.
Viatris Inc.
Viatris experienced a revenue decline of 4.5% in 2024, continuing a mixed trend over the years, yet overall revenue grew by 23.4% from 2020. Net income remains negative in 2024 at -$634M, a sharp reversal from a small positive in 2023. Margins are weak with a negative EBIT margin and net margin of -4.3%, reflecting ongoing profitability challenges and significant margin contraction in the latest year.
Which one has the stronger fundamentals?
Based on income statement evaluations, Zoetis exhibits stronger fundamentals with mostly favorable margin and growth metrics, including robust profitability and consistent expansion. Viatris shows unfavorable trends in profitability and margin compression despite some overall growth. Zoetis’s stable and improving earnings contrast with Viatris’s recent losses and negative operating income, highlighting Zoetis as having the more favorable income statement profile.
Financial Ratios Comparison
The table below presents a side-by-side comparison of key financial ratios for Zoetis Inc. and Viatris Inc., based on their most recent fiscal year data (2024).
| Ratios | Zoetis Inc. (ZTS) | Viatris Inc. (VTRS) |
|---|---|---|
| ROE | 52.1% | -3.4% |
| ROIC | 22.2% | 0.03% |
| P/E | 29.8 | -23.4 |
| P/B | 15.5 | 0.80 |
| Current Ratio | 1.75 | 1.65 |
| Quick Ratio | 1.08 | 0.98 |
| D/E (Debt to Equity) | 1.41 | 0.77 |
| Debt-to-Assets | 47.4% | 34.5% |
| Interest Coverage | 14.0 | 0.02 |
| Asset Turnover | 0.65 | 0.36 |
| Fixed Asset Turnover | 2.56 | 5.53 |
| Payout Ratio | 31.6% | -90.6% |
| Dividend Yield | 1.06% | 3.87% |
Interpretation of the Ratios
Zoetis Inc.
Zoetis shows strong profitability with a net margin of 26.86%, ROE at 52.12%, and ROIC at 22.2%, all favorable. Liquidity ratios are solid, but its high P/E of 29.77 and P/B of 15.51 raise valuation concerns. The company pays dividends with a 1.06% yield, indicating moderate shareholder returns without excessive payout risks.
Viatris Inc.
Viatris exhibits weak profitability, with negative net margin (-4.3%) and ROE (-3.4%), reflecting operational challenges. Despite a favorable P/E and P/B ratio, interest coverage is negative, signaling financial strain. It pays dividends with a 3.87% yield, but negative earnings and free cash flow highlight risks in sustaining distributions.
Which one has the best ratios?
Zoetis presents a more favorable profile with stronger profitability, liquidity, and coverage ratios despite higher valuation multiples. Viatris faces profitability and financial health challenges, though it offers a higher dividend yield. Both have slightly favorable global ratio opinions, but Zoetis’s fundamentals appear more robust overall.
Strategic Positioning
This section compares the strategic positioning of Zoetis Inc. and Viatris Inc., focusing on Market position, Key segments, and exposure to disruption:
Zoetis Inc.
- Leading animal health specialist with broad international presence and moderate competitive pressure.
- Focused on animal health products, including vaccines, pharmaceuticals, diagnostics across livestock and companion animals.
- Exposure mainly in biotech and diagnostics innovations related to animal health, less affected by broad tech disruption.
Viatris Inc.
- Global healthcare player in pharmaceuticals facing competitive pressure in diversified markets.
- Offers prescription brands, generics, complex generics, biosimilars across multiple global segments.
- Faces disruption from biosimilars and complex generics innovation, plus digital health services expansion.
Zoetis Inc. vs Viatris Inc. Positioning
Zoetis maintains a concentrated focus on animal health with specialized products, providing a clear niche advantage, while Viatris pursues a diversified pharmaceutical portfolio spanning brands, generics, and biosimilars globally, carrying broader market exposure but more complexity.
Which has the best competitive advantage?
Zoetis demonstrates a very favorable moat with consistent value creation and growing profitability, whereas Viatris shows slightly unfavorable moat status, shedding value despite improving profitability, indicating Zoetis holds the stronger competitive advantage.
Stock Comparison
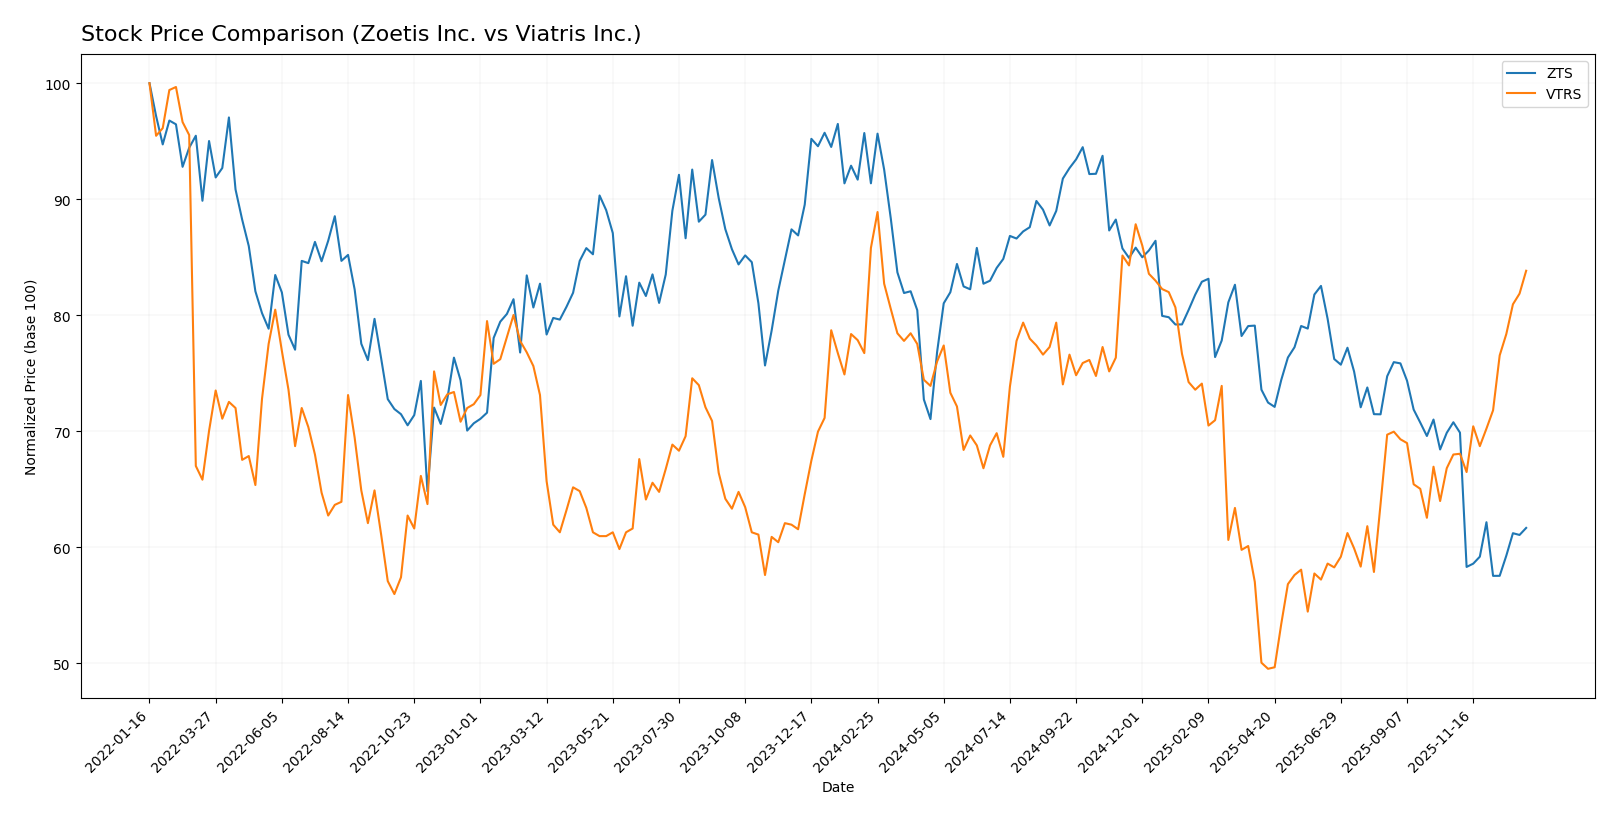
The stock price chart over the past 12 months reveals a marked bearish trend for Zoetis Inc. with significant price decline and volatility, while Viatris Inc. shows a mild overall decrease but strong recent upward momentum.
Trend Analysis
Zoetis Inc. experienced a bearish trend over the past 12 months with a -32.5% price change, decelerating decline, and high volatility (std deviation 18.89). The stock ranged between 118.65 and 197.21.
Viatris Inc. showed a slight bearish trend overall with a -2.3% price change but an accelerating recovery recently, gaining 23.29% over the last 2.5 months with low volatility (std deviation 1.41).
Comparing both, Viatris delivered the highest recent market performance with significant short-term gains, while Zoetis faced a more sustained and volatile price decline during the period.
Target Prices
Analysts present a cautiously optimistic target consensus for Zoetis Inc. and Viatris Inc.
| Company | Target High | Target Low | Consensus |
|---|---|---|---|
| Zoetis Inc. | 215 | 136 | 158.17 |
| Viatris Inc. | 16 | 16 | 16 |
Zoetis shows a significant upside potential compared to its current price of $127.17, while Viatris’s consensus target price of $16 indicates modest growth from the current $12.76.
Analyst Opinions Comparison
This section compares analysts’ ratings and financial grades for Zoetis Inc. and Viatris Inc.:
Rating Comparison
Zoetis Inc. Rating
- Rating: A-, indicating a very favorable status.
- Discounted Cash Flow Score: 4, favorable valuation based on future cash flows.
- ROE Score: 5, very favorable efficiency in generating profit from equity.
- ROA Score: 5, very favorable asset utilization to generate earnings.
- Debt To Equity Score: 4, favorable financial risk profile.
- Overall Score: 4, favorable summary of financial standing.
Viatris Inc. Rating
- Rating: C+, reflecting a moderate overall standing.
- Discounted Cash Flow Score: 5, very favorable cash flow projection.
- ROE Score: 1, very unfavorable profitability from equity.
- ROA Score: 1, very unfavorable asset efficiency.
- Debt To Equity Score: 1, very unfavorable debt management.
- Overall Score: 2, moderate overall financial condition.
Which one is the best rated?
Based strictly on the provided data, Zoetis Inc. is better rated with a higher overall score and more favorable scores in ROE, ROA, and debt management. Viatris shows strength only in discounted cash flow but lags in profitability and financial stability.
Scores Comparison
Here is a comparison of the Altman Z-Score and Piotroski Score for Zoetis Inc. and Viatris Inc.:
Zoetis Inc. Scores
- Altman Z-Score: 6.42, indicating a safe zone with low bankruptcy risk.
- Piotroski Score: 8, reflecting very strong financial health.
Viatris Inc. Scores
- Altman Z-Score: 0.48, indicating distress zone with high bankruptcy risk.
- Piotroski Score: 5, reflecting average financial health.
Which company has the best scores?
Zoetis Inc. has both a significantly higher Altman Z-Score and a stronger Piotroski Score compared to Viatris Inc., suggesting better financial stability and strength based on these metrics.
Grades Comparison
Here is a factual comparison of the recent grades assigned to Zoetis Inc. and Viatris Inc.:
Zoetis Inc. Grades
The following table shows recent grades from recognized grading companies for Zoetis Inc.:
| Grading Company | Action | New Grade | Date |
|---|---|---|---|
| BTIG | Maintain | Buy | 2025-12-03 |
| Stifel | Maintain | Hold | 2025-11-18 |
| BTIG | Maintain | Buy | 2025-11-12 |
| Morgan Stanley | Maintain | Overweight | 2025-11-10 |
| UBS | Maintain | Neutral | 2025-11-05 |
| JP Morgan | Maintain | Overweight | 2025-11-05 |
| UBS | Maintain | Neutral | 2025-10-20 |
| Argus Research | Maintain | Buy | 2025-09-09 |
| Piper Sandler | Maintain | Overweight | 2025-08-11 |
| Leerink Partners | Downgrade | Market Perform | 2025-07-17 |
Zoetis’s grades predominantly range from Hold/Neutral to Buy/Overweight, indicating a generally positive rating trend with a rare recent downgrade.
Viatris Inc. Grades
The following table shows recent grades from recognized grading companies for Viatris Inc.:
| Grading Company | Action | New Grade | Date |
|---|---|---|---|
| Jefferies | Maintain | Buy | 2025-03-07 |
| Piper Sandler | Maintain | Neutral | 2025-03-05 |
| B of A Securities | Maintain | Underperform | 2025-02-28 |
| Barclays | Maintain | Underweight | 2025-02-28 |
| Piper Sandler | Maintain | Neutral | 2024-12-06 |
| Barclays | Maintain | Underweight | 2024-11-08 |
| Piper Sandler | Maintain | Neutral | 2024-03-28 |
| Piper Sandler | Maintain | Neutral | 2023-11-22 |
| B of A Securities | Downgrade | Underperform | 2023-10-23 |
| Barclays | Downgrade | Underweight | 2023-06-23 |
Viatris’s grades mostly range from Neutral to Underperform/Underweight, reflecting a cautious to negative consensus without any upgrades.
Which company has the best grades?
Zoetis Inc. consistently receives better grades, with multiple Buy and Overweight ratings compared to Viatris Inc.’s Neutral to Underperform grades. This suggests Zoetis is viewed more favorably by analysts, potentially impacting investor confidence and portfolio positioning.
Strengths and Weaknesses
Below is a comparative table outlining the key strengths and weaknesses of Zoetis Inc. (ZTS) and Viatris Inc. (VTRS) based on recent financial performance, product diversification, profitability, innovation, global presence, and market share.
| Criterion | Zoetis Inc. (ZTS) | Viatris Inc. (VTRS) |
|---|---|---|
| Diversification | Broad animal health product range: cattle, horses, dogs, cats, poultry, swine, fish | Focus on pharmaceutical brands and generics, including complex generics and biosimilars |
| Profitability | High net margin (26.9%), ROIC 22.2%, ROE 52.1% – very favorable | Negative net margin (-4.3%), very low ROIC (0.03%), negative ROE (-3.4%) – unfavorable |
| Innovation | Consistent growth in ROIC indicating strong value creation and competitive advantage | ROIC slightly improving but still negative value creation; innovation challenges exist |
| Global presence | Strong global reach in animal health markets with steady revenue growth across segments | Large pharmaceutical footprint with diversified brands but struggling profitability |
| Market Share | Leading market position in animal health products with steady revenue growth | Competitive but losing value; market share pressure from generics and biosimilars |
Key takeaways: Zoetis demonstrates a robust competitive moat with strong profitability, diversification, and innovation in animal health. Viatris shows improving operational metrics but currently struggles with profitability and value creation, signaling higher investment risk despite global scale.
Risk Analysis
Below is a comparative overview of key risks for Zoetis Inc. (ZTS) and Viatris Inc. (VTRS) as of 2024:
| Metric | Zoetis Inc. (ZTS) | Viatris Inc. (VTRS) |
|---|---|---|
| Market Risk | Moderate, beta 0.97 indicates near-market volatility | Lower, beta 0.79 suggests less sensitivity to market swings |
| Debt level | Elevated, Debt-to-Equity ratio 1.41 (unfavorable) | Moderate, Debt-to-Equity ratio 0.77 (neutral) |
| Regulatory Risk | High, due to global animal health product approvals | High, complex regulations in multiple markets including biosimilars |
| Operational Risk | Moderate, global supply chain and R&D dependencies | Elevated, integration challenges post-merger and complex product portfolio |
| Environmental Risk | Moderate, animal health sector exposure to sustainability scrutiny | Moderate, pharmaceutical manufacturing environmental impact |
| Geopolitical Risk | Moderate, international operations expose to trade tensions | Elevated, emerging markets exposure increases geopolitical uncertainty |
Zoetis shows strong financial stability but carries higher debt and regulatory risks in animal health markets. Viatris faces operational and financial distress risks, reflected in its Altman Z-score in the distress zone and weak profitability, making it more vulnerable in volatile environments. Investors should weigh Zoetis’s solid fundamentals against Viatris’s turnaround challenges.
Which Stock to Choose?
Zoetis Inc. (ZTS) shows a favorable income evolution with 8.33% revenue growth in 2024 and a strong profitability profile, including a 26.86% net margin and a 52.12% ROE. Its debt level is moderate with a net debt to EBITDA of 1.23, and it holds a very favorable A- rating.
Viatris Inc. (VTRS) experienced unfavorable income trends in 2024 with declines in revenue and profitability, including a -4.3% net margin and negative ROE at -3.4%. While its debt is relatively lower, net debt to EBITDA stands at 4.81, and its overall rating is moderate at C+.
For investors focused on quality and stable profitability, Zoetis might appear more favorable due to its strong margins and robust rating. Conversely, those with a risk-tolerant profile seeking potential turnaround opportunities might consider Viatris, given its improving ROIC trend despite current value destruction.
Disclaimer: Investment carries a risk of loss of initial capital. The past performance is not a reliable indicator of future results. Be sure to understand risks before making an investment decision.
Go Further
I encourage you to read the complete analyses of Zoetis Inc. and Viatris Inc. to enhance your investment decisions: