In the dynamic world of technology, Wix.com Ltd. and Veritone, Inc. stand out as innovators in the software infrastructure sector. Wix excels in cloud-based web development platforms, while Veritone leads with AI-powered data analytics solutions. Both companies target digital transformation but with distinct approaches. This article will analyze their market positions and strategies to help you decide which stock could be the smarter investment in 2026.
Table of contents
Companies Overview
I will begin the comparison between Wix.com Ltd. and Veritone, Inc. by providing an overview of these two companies and their main differences.
Wix.com Ltd. Overview
Wix.com Ltd. operates a cloud-based platform that allows users globally to create websites and web applications, emphasizing ease of use through drag-and-drop tools and AI-powered features. The company supports around 222M registered users and 6M premium subscribers, offering a broad range of products including website building, payment processing, and customer engagement tools. Headquartered in Tel Aviv, Wix is a significant player in the software infrastructure industry.
Veritone, Inc. Overview
Veritone, Inc. provides AI computing solutions primarily in the U.S. and U.K., leveraging its aiWARE platform to extract insights from structured and unstructured data using machine learning and cognitive processes. The company serves diverse verticals such as media, government, and legal markets. Based in Denver, Veritone operates as a smaller entity with 469 employees and focuses on AI-driven analytics and media advertising services.
Key similarities and differences
Both Wix and Veritone operate in the software infrastructure sector, emphasizing advanced technology platforms. Wix focuses on website creation and online business tools targeting a broad user base, while Veritone specializes in AI-powered data analysis for enterprise clients in niche markets. Wix’s business model is subscription and service-driven, contrasting with Veritone’s combination of AI platform licensing and media service offerings. The scale and market capitalization of Wix significantly exceed those of Veritone.
Income Statement Comparison
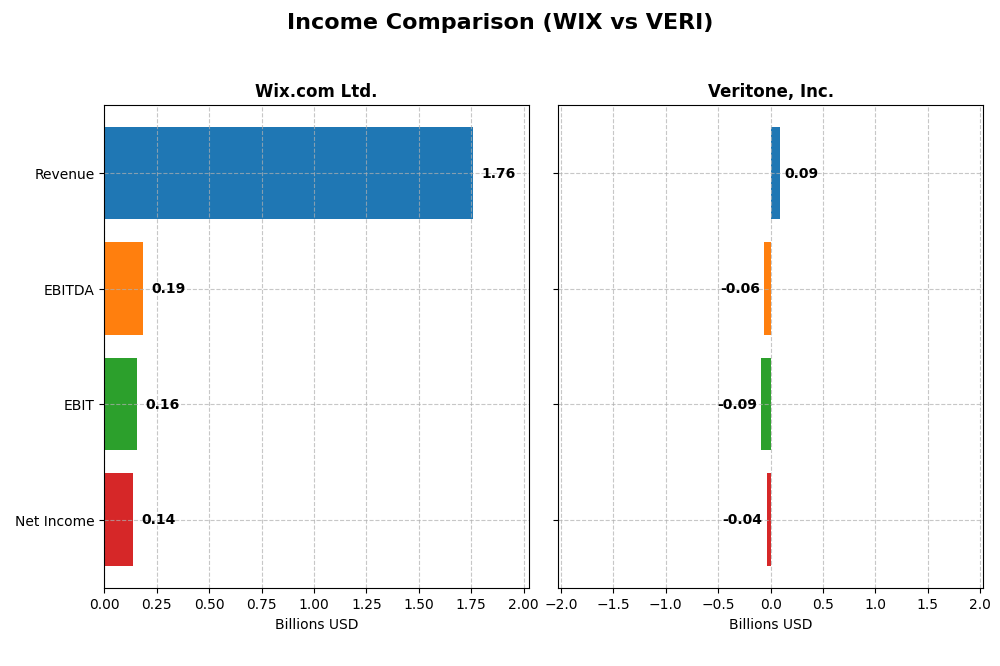
The table below presents a side-by-side comparison of key income statement metrics for Wix.com Ltd. and Veritone, Inc. for the fiscal year 2024.
| Metric | Wix.com Ltd. (WIX) | Veritone, Inc. (VERI) |
|---|---|---|
| Market Cap | 4.46B | 225M |
| Revenue | 1.76B | 93M |
| EBITDA | 186M | -59M |
| EBIT | 155M | -88M |
| Net Income | 138M | -37M |
| EPS | 2.49 | -0.98 |
| Fiscal Year | 2024 | 2024 |
Income Statement Interpretations
Wix.com Ltd.
Wix.com Ltd. shows a strong upward trend in revenue, growing from $984M in 2020 to $1.76B in 2024, with net income turning positive after years of losses, reaching $138M in 2024. Gross margin remained favorable around 68%, and net margin improved significantly to 7.86%. The latest year saw robust revenue growth of 12.7% and a net margin growth exceeding 270%, indicating improved profitability and operational efficiency.
Veritone, Inc.
Veritone, Inc. experienced revenue growth from $57.7M in 2020 to $92.6M in 2024, though with a slight decline in 2024 compared to 2023. The company remains unprofitable, with a net loss of $37M in 2024 despite some margin improvements. Gross margin is favorable at 70.6%, but EBIT and net margins are negative, with EBIT margin at -95%. The recent year showed a revenue decrease of 7.3%, but net margin and EPS growth were positive, indicating some operational improvements.
Which one has the stronger fundamentals?
Wix.com Ltd. demonstrates stronger fundamentals with consistent revenue and net income growth, favorable gross and net margins, and improving profitability ratios. Veritone, while showing revenue growth over the period, struggles with losses and unfavorable EBIT and net margins, despite some recent margin improvements. Wix’s financial health and margin stability position it as the company with more robust income statement fundamentals.
Financial Ratios Comparison
The table below presents the most recent financial ratios for Wix.com Ltd. and Veritone, Inc., offering a snapshot of their performance and financial health as of fiscal year 2024.
| Ratios | Wix.com Ltd. (WIX) | Veritone, Inc. (VERI) |
|---|---|---|
| ROE | -1.76 | -2.78 |
| ROIC | 9.13% | -58.27% |
| P/E | 86.2 | -3.34 |
| P/B | -151.35 | 9.27 |
| Current Ratio | 0.84 | 0.97 |
| Quick Ratio | 0.84 | 0.97 |
| D/E | -12.31 | 8.91 |
| Debt-to-Assets | 50.7% | 60.5% |
| Interest Coverage | 25.92 | -7.31 |
| Asset Turnover | 0.92 | 0.47 |
| Fixed Asset Turnover | 3.33 | 8.51 |
| Payout Ratio | 0 | 0 |
| Dividend Yield | 0% | 0% |
Interpretation of the Ratios
Wix.com Ltd.
Wix.com Ltd. shows a mixed ratio profile with some strengths like favorable debt-to-equity and interest coverage ratios but faces concerns such as low current ratio and negative return on equity. The high price-to-earnings ratio also signals valuation risks. Wix does not pay dividends, likely due to reinvestment in growth and research, prioritizing platform development over shareholder payouts.
Veritone, Inc.
Veritone, Inc. exhibits predominantly unfavorable ratios, including negative net margin, return on equity, and poor interest coverage, reflecting operational and financial challenges. Its quick ratio is neutral, but leverage and asset turnover are weak. Like Wix, Veritone pays no dividends, consistent with its negative earnings and focus on AI platform expansion and R&D investment.
Which one has the best ratios?
Comparing both, Wix.com Ltd. has a more balanced ratio set with a higher proportion of favorable and neutral metrics, whereas Veritone, Inc. faces significant financial weaknesses and a very unfavorable overall ratio assessment. Thus, Wix demonstrates better financial ratio health in this comparison.
Strategic Positioning
This section compares the strategic positioning of Wix.com Ltd. and Veritone, Inc., focusing on Market position, Key segments, and Exposure to technological disruption:
Wix.com Ltd.
- Large market cap of 4.46B USD with significant competitive pressure in cloud-based website platforms.
- Key segments include Creative Subscription and Business Solutions driving most revenues.
- Exposure through AI-powered tools like Wix ADI and Logo Maker integrated into platform services.
Veritone, Inc.
- Smaller market cap of 225M USD facing competitive pressure in AI software infrastructure.
- Revenue driven by AI platform services, licensing, managed services, and advertising.
- High exposure with AI operating system aiWARE focusing on machine learning and cognitive processes.
Wix.com Ltd. vs Veritone, Inc. Positioning
Wix.com Ltd. has a diversified business with strong revenue from subscriptions and business solutions, while Veritone, Inc. is more concentrated on AI software and services. Wix benefits from a broad user base; Veritone focuses on AI innovation in specialized verticals.
Which has the best competitive advantage?
Both companies are currently shedding value, but Wix shows a growing ROIC trend, indicating improving profitability. Veritone’s declining ROIC trend suggests worsening profitability, giving Wix a comparatively better competitive advantage based on MOAT evaluation.
Stock Comparison
The stock price movements over the past 12 months reveal contrasting trends, with Wix.com Ltd. experiencing a significant bearish decline while Veritone, Inc. shows a strong bullish rise, both undergoing recent deceleration phases.
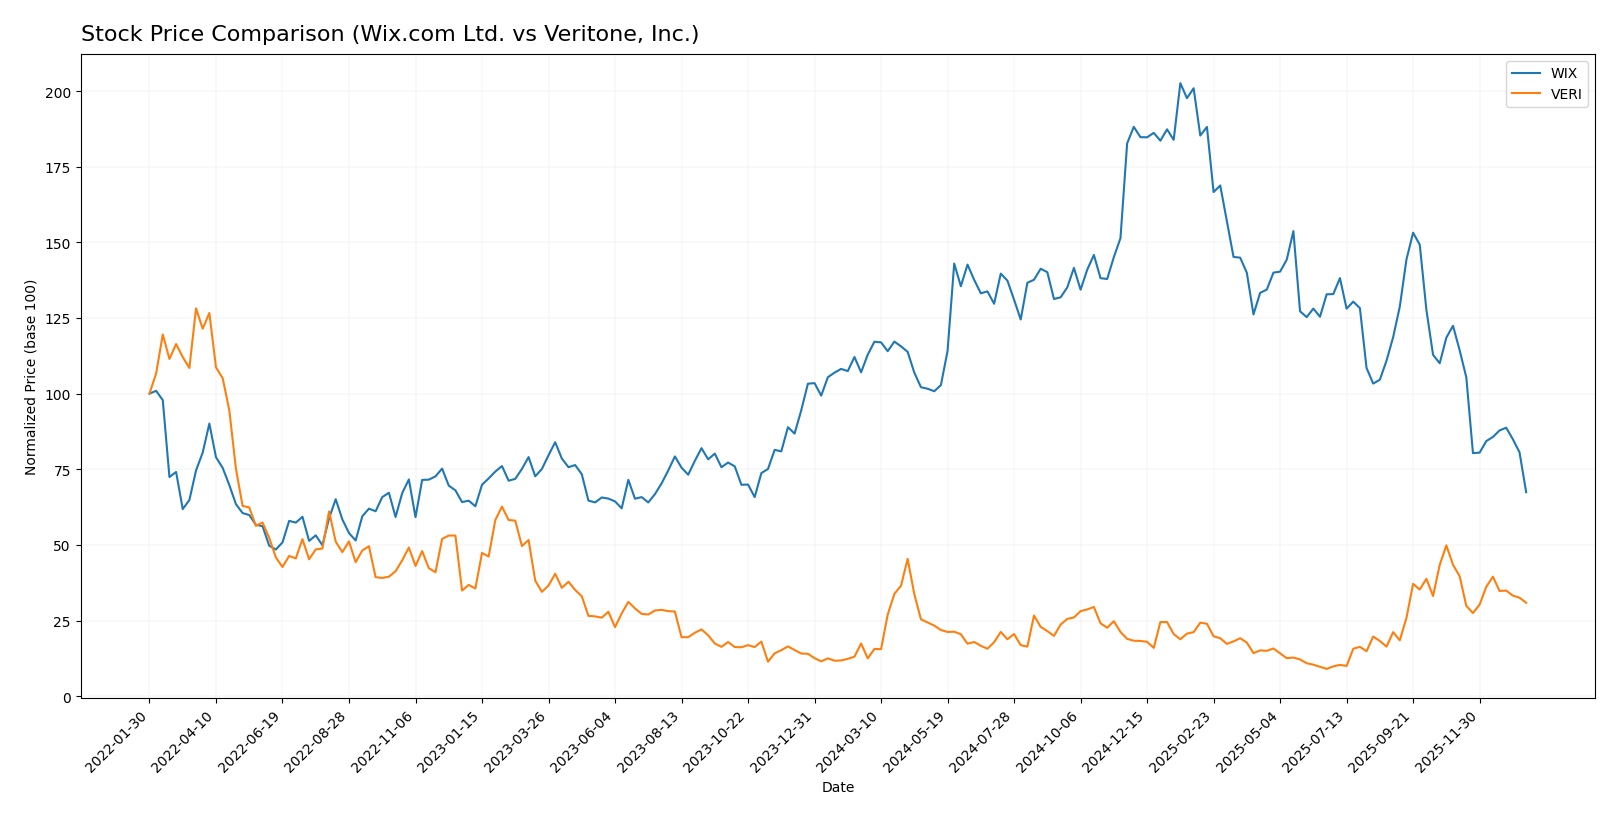
Trend Analysis
Wix.com Ltd.’s stock has declined by 40.28% over the past year, reflecting a bearish trend with decelerating losses and high volatility, ranging from a high of 240.89 to a low of 80.16.
Veritone, Inc. posted a 147.22% gain over the same period, indicating a bullish trend with decelerating momentum and low volatility, with prices moving between 1.3 and 7.18.
Comparing both, Veritone, Inc. delivered the highest market performance with a substantial positive return, while Wix.com Ltd. recorded a notable negative trend.
Target Prices
Here is the current consensus of target prices from recognized analysts for Wix.com Ltd. and Veritone, Inc.:
| Company | Target High | Target Low | Consensus |
|---|---|---|---|
| Wix.com Ltd. | 210 | 70 | 160.27 |
| Veritone, Inc. | 10 | 9 | 9.5 |
Analysts expect Wix.com’s stock to appreciate significantly above its current price of $80.16, indicating strong growth potential. Veritone’s target consensus is also substantially higher than its current price of $4.45, suggesting upside opportunity.
Analyst Opinions Comparison
This section compares analysts’ ratings and grades for Wix.com Ltd. and Veritone, Inc.:
Rating Comparison
WIX Rating
- Rating: Both companies have a “C” rating, classified as Very Favorable.
- Discounted Cash Flow Score: Moderate at 3, indicating average valuation.
- ROE Score: Very Unfavorable at 1, reflecting poor profit generation efficiency.
- ROA Score: Favorable at 4, indicating effective asset utilization.
- Debt To Equity Score: Very Unfavorable at 1, signaling high financial risk.
- Overall Score: Moderate at 2, reflecting average overall performance.
VERI Rating
- Rating: Both companies have a “C” rating, classified as Very Favorable.
- Discounted Cash Flow Score: Very Favorable at 5, suggesting strong valuation.
- ROE Score: Very Unfavorable at 1, showing similar inefficiency in profit generation.
- ROA Score: Very Unfavorable at 1, indicating weak asset utilization.
- Debt To Equity Score: Very Unfavorable at 1, also indicating high financial risk.
- Overall Score: Moderate at 2, reflecting average overall performance.
Which one is the best rated?
Both WIX and VERI share the same overall rating “C” and overall score of 2. WIX shows a more favorable ROA and moderate DCF score, whereas VERI has a stronger DCF score but weaker ROA. Hence, WIX has slightly better asset efficiency while VERI shows better valuation metrics.
Scores Comparison
The scores comparison between Wix.com Ltd. and Veritone, Inc. based on Altman Z-Score and Piotroski Score is as follows:
WIX Scores
- Altman Z-Score: 1.83, in the grey zone indicating moderate bankruptcy risk.
- Piotroski Score: 6, classified as average financial strength.
VERI Scores
- Altman Z-Score: -0.07, in the distress zone indicating high bankruptcy risk.
- Piotroski Score: 3, classified as very weak financial strength.
Which company has the best scores?
Wix.com Ltd. has higher Altman Z-Score and Piotroski Score compared to Veritone, Inc. Wix is in the grey zone with average financial strength, while Veritone is in distress with very weak financials.
Grades Comparison
Here is a detailed comparison of the available grades for Wix.com Ltd. and Veritone, Inc.:
Wix.com Ltd. Grades
The following table summarizes recent grades assigned to Wix.com Ltd. by recognized financial institutions:
| Grading Company | Action | New Grade | Date |
|---|---|---|---|
| Morgan Stanley | Maintain | Overweight | 2026-01-15 |
| Wells Fargo | Maintain | Overweight | 2025-12-19 |
| Cantor Fitzgerald | Maintain | Overweight | 2025-12-11 |
| Wells Fargo | Maintain | Overweight | 2025-11-20 |
| Barclays | Maintain | Overweight | 2025-11-20 |
| Citizens | Maintain | Market Outperform | 2025-11-20 |
| Citigroup | Maintain | Buy | 2025-11-20 |
| Scotiabank | Maintain | Sector Outperform | 2025-11-20 |
| Needham | Maintain | Buy | 2025-11-20 |
| Evercore ISI Group | Maintain | Outperform | 2025-11-20 |
Wix.com Ltd. shows a consistent positive grading trend, with multiple institutions maintaining overweight, buy, and outperform ratings over recent months.
Veritone, Inc. Grades
Below are the recent grades for Veritone, Inc. from financial firms:
| Grading Company | Action | New Grade | Date |
|---|---|---|---|
| D. Boral Capital | Maintain | Buy | 2025-12-09 |
| D. Boral Capital | Maintain | Buy | 2025-12-04 |
| Needham | Maintain | Buy | 2025-12-02 |
| D. Boral Capital | Maintain | Buy | 2025-12-02 |
| D. Boral Capital | Maintain | Buy | 2025-11-07 |
| D. Boral Capital | Maintain | Buy | 2025-10-28 |
| HC Wainwright & Co. | Maintain | Buy | 2025-10-20 |
| D. Boral Capital | Maintain | Buy | 2025-10-15 |
| D. Boral Capital | Maintain | Buy | 2025-09-24 |
| D. Boral Capital | Maintain | Buy | 2025-09-09 |
Veritone, Inc. grades are exclusively from a limited number of sources, primarily D. Boral Capital, all maintaining a buy rating, indicating a uniform positive outlook.
Which company has the best grades?
Wix.com Ltd. has received a broader range of positive grades from multiple reputable firms, reflecting diverse analyst confidence and a stable outlook. Veritone, Inc. has consistent buy ratings but from fewer sources, suggesting less varied analyst coverage. This difference may affect investor perception of market consensus and risk exposure.
Strengths and Weaknesses
Below is a comparison table summarizing key strengths and weaknesses of Wix.com Ltd. and Veritone, Inc. based on their latest financial data and market positioning.
| Criterion | Wix.com Ltd. | Veritone, Inc. |
|---|---|---|
| Diversification | Moderate: Focused on Creative Subscription and Business Solutions segments with steady growth in both | Limited: Revenue concentrated in Software Products and Managed Services with some fluctuation |
| Profitability | Neutral: Positive net margin (~7.9%) but ROE is highly negative; ROIC near WACC | Unfavorable: Negative net margin (-40%) and declining ROIC well below WACC |
| Innovation | Favorable fixed asset turnover (3.33) indicates efficient asset use, innovation in web platform | Strong fixed asset turnover (8.51) but overall profitability and margins suffer |
| Global presence | Established global platform with wide user base | Smaller scale with niche AI and media services focus |
| Market Share | Strong in website building and online presence markets | Niche player in AI-driven media and advertising services |
Key takeaways: Wix.com shows improving profitability with solid asset utilization but faces challenges in returns on equity and liquidity. Veritone struggles with profitability and value creation, despite operational efficiency in asset use. Caution is advised due to value destruction in both companies, with Wix showing potential for recovery.
Risk Analysis
Below is a comparative risk table for Wix.com Ltd. (WIX) and Veritone, Inc. (VERI) based on the most recent 2024 data:
| Metric | Wix.com Ltd. (WIX) | Veritone, Inc. (VERI) |
|---|---|---|
| Market Risk | Beta 1.42 indicates moderate volatility | Beta 2.05 shows high volatility and market sensitivity |
| Debt level | Debt-to-assets 50.7% (unfavorable) but negative debt-to-equity suggesting complex capital structure | Debt-to-assets 60.5%, high leverage and unfavorable debt-to-equity ratio |
| Regulatory Risk | Moderate, operates globally but no major recent regulatory issues reported | Moderate, US/UK operation with potential AI regulation impacts |
| Operational Risk | Neutral asset turnover, solid operational efficiency | Low asset turnover, operational challenges evident |
| Environmental Risk | Low to moderate, tech sector with limited direct environmental impact | Low, primarily software-focused with minimal direct environmental footprint |
| Geopolitical Risk | Based in Israel, some exposure to regional tensions | Based in US, less geopolitical risk but potential international market exposure |
In summary, Veritone faces higher market volatility and financial distress risks, with very unfavorable profitability and solvency ratios, including a distress-zone Altman Z-Score. Wix shows moderate market risk and leverage but is in a grey zone for bankruptcy risk with average financial health. Investors should weigh Veritone’s higher risk against potential growth, while Wix presents a more balanced risk profile.
Which Stock to Choose?
Wix.com Ltd. displays a favorable income evolution with 12.7% revenue growth in 2024 and strong profitability, yet its financial ratios reveal mixed signals: neutral net margin and ROIC, but unfavorable ROE and current ratio, alongside slightly unfavorable global ratio status and a “very favorable” overall rating. The company has a net debt to EBITDA of 1.66 and is considered to be shedding value, although its ROIC shows a positive growth trend.
Veritone, Inc. shows a less favorable income trajectory with negative net margin and EBIT margin, and declines in revenue and profitability growth in 2024. Its financial ratios are largely unfavorable, including negative ROE, ROIC, and a very unfavorable global ratio opinion. The company carries higher debt ratios and is shedding value with declining ROIC, despite a very favorable rating driven by discounted cash flow metrics.
Investors with a growth focus might find Wix.com’s improving income and profitability metrics appealing, despite some financial ratio weaknesses and value destruction signals. Conversely, risk-tolerant investors intrigued by Veritone’s recent bullish price trend and discounted cash flow score may see potential, though financial and profitability metrics remain very unfavorable, suggesting higher risk.
Disclaimer: Investment carries a risk of loss of initial capital. The past performance is not a reliable indicator of future results. Be sure to understand risks before making an investment decision.
Go Further
I encourage you to read the complete analyses of Wix.com Ltd. and Veritone, Inc. to enhance your investment decisions: