In today’s fast-evolving technology landscape, Zscaler, Inc. and VeriSign, Inc. stand out as pivotal players in software infrastructure. Both companies operate in cybersecurity and internet infrastructure, addressing critical needs for secure, reliable digital environments. Their innovation strategies and market presence offer intriguing contrasts. This article will guide you through their strengths to identify which company presents the most compelling investment opportunity in 2026.

Table of contents
Companies Overview
I will begin the comparison between Zscaler and VeriSign by providing an overview of these two companies and their main differences.
Zscaler Overview
Zscaler, Inc. operates globally as a cloud security company focused on providing secure access to externally managed applications and internal resources through its Zscaler Internet Access and Private Access solutions. The company also offers digital experience monitoring and workload segmentation to enhance security and compliance. Headquartered in San Jose, California, Zscaler serves diverse industries including financial services, healthcare, and telecommunications, positioning itself as a key player in the software infrastructure sector.
VeriSign Overview
VeriSign, Inc. specializes in domain name registry services and internet infrastructure, supporting recognized global domain names such as .com and .net. It maintains critical internet root servers and ensures the security and stability of internet navigation. Based in Reston, Virginia, VeriSign provides authoritative resolution and backend systems for various domain names, underpinning global e-commerce and internet services. It operates within the software infrastructure industry with a focus on internet resiliency and security.
Key similarities and differences
Both Zscaler and VeriSign operate in the software infrastructure industry, focusing on internet security and stability. Zscaler emphasizes cloud security and application access, while VeriSign concentrates on domain name registry and internet root server maintenance. Zscaler has a larger workforce and market cap, reflecting its broader cloud services scope, whereas VeriSign’s business centers on foundational internet infrastructure and domain management, including dividend payments which Zscaler does not offer.
Income Statement Comparison
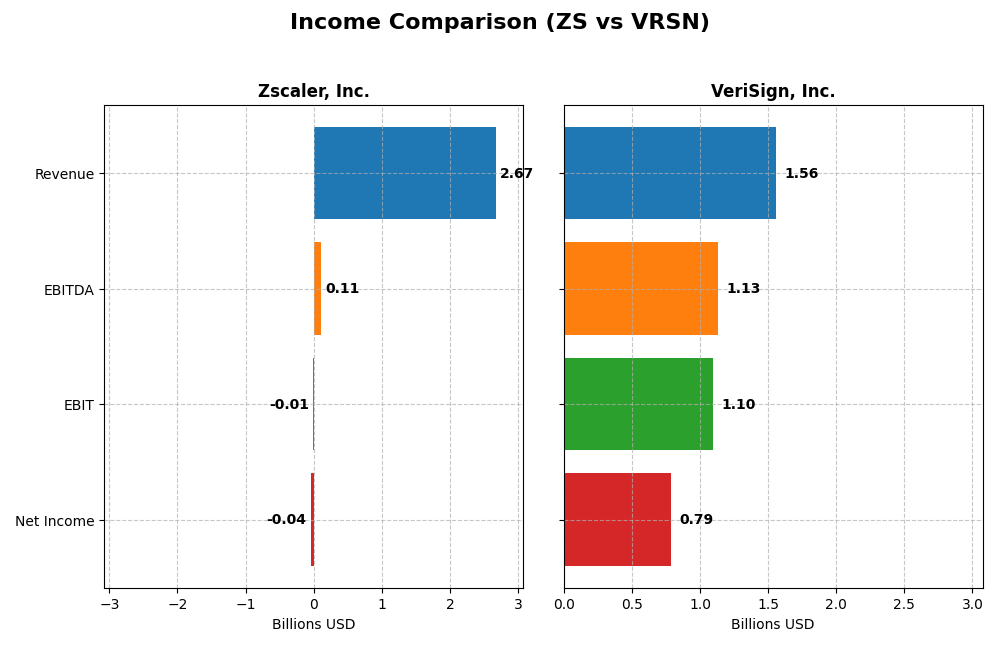
The table below provides a side-by-side comparison of the most recent full fiscal year income statement figures for Zscaler, Inc. and VeriSign, Inc.
| Metric | Zscaler, Inc. (ZS) | VeriSign, Inc. (VRSN) |
|---|---|---|
| Market Cap | 34.1B | 23.1B |
| Revenue | 2.67B | 1.56B |
| EBITDA | 112M | 1.13B |
| EBIT | -8.8M | 1.10B |
| Net Income | -41.5M | 786M |
| EPS | -0.27 | 8.01 |
| Fiscal Year | 2025 | 2024 |
Income Statement Interpretations
Zscaler, Inc.
Zscaler’s revenue grew substantially from $673M in 2021 to $2.67B in 2025, reflecting a 297% increase over five years. Despite this growth, the company posted net losses throughout, though losses narrowed from -$262M in 2021 to -$41M in 2025. Gross margins remained strong at 76.87% in 2025, while net margins improved but stayed negative at -1.55%. The latest fiscal year showed favorable growth in revenue and margins.
VeriSign, Inc.
VeriSign experienced steady revenue growth from $1.27B in 2020 to $1.56B in 2024, a 23% increase overall. Net income fluctuated, peaking at $815M in 2020, then declining to $786M in 2024. Gross margin was high at 87.71%, with a robust net margin of 50.45% in 2024. Although revenue growth slowed recently, the company maintained favorable profitability and solid operating margins.
Which one has the stronger fundamentals?
VeriSign exhibits stronger profitability with consistent positive net income and high margins, despite slower recent revenue growth. Zscaler shows rapid revenue expansion and improving margins but continues to operate at a net loss. Overall, VeriSign’s income statement reflects more stable and favorable fundamentals, while Zscaler demonstrates strong growth potential accompanied by ongoing profitability challenges.
Financial Ratios Comparison
The table below presents a side-by-side comparison of key financial ratios for Zscaler, Inc. (ZS) and VeriSign, Inc. (VRSN) based on the most recent fiscal year data available.
| Ratios | Zscaler, Inc. (2025) | VeriSign, Inc. (2024) |
|---|---|---|
| ROE | -2.31% | -40.13% |
| ROIC | -3.18% | 451.00% |
| P/E | -1063 | 25.84 |
| P/B | 24.51 | -10.37 |
| Current Ratio | 2.01 | 0.43 |
| Quick Ratio | 2.01 | 0.43 |
| D/E | 0.999 | -0.92 |
| Debt-to-Assets | 27.98% | 128.08% |
| Interest Coverage | -13.49 | 14.05 |
| Asset Turnover | 0.42 | 1.11 |
| Fixed Asset Turnover | 4.22 | 6.66 |
| Payout ratio | 0 | 0 |
| Dividend yield | 0% | 0% |
Interpretation of the Ratios
Zscaler, Inc.
Zscaler shows a mixed financial profile with several unfavorable ratios, including negative net margin (-1.55%) and return on equity (-2.31%), indicating profitability challenges. Its strong liquidity is reflected in favorable current and quick ratios (~2.01), while valuation metrics like a high price-to-book ratio (24.51) raise concerns. The company does not pay dividends, likely due to ongoing reinvestment and growth initiatives.
VeriSign, Inc.
VeriSign presents generally favorable ratios, such as a strong net margin (50.45%) and return on invested capital (451%), despite a negative return on equity (-40.13%). The company has a weak liquidity position with a current ratio of 0.43 but benefits from solid asset turnover and interest coverage ratios. VeriSign pays dividends, supported by a consistent payout, though its dividend yield remains modest.
Which one has the best ratios?
VeriSign’s ratios are overall more favorable, showing strong profitability and capital efficiency despite liquidity weaknesses. Zscaler, while liquid, struggles with profitability and valuation concerns. VeriSign’s higher proportion of favorable metrics (57.14%) versus Zscaler’s (35.71%) suggests a financially stronger position, albeit with some risks to consider.
Strategic Positioning
This section compares the strategic positioning of Zscaler, Inc. and VeriSign, Inc., focusing on Market position, Key segments, and disruption:
Zscaler, Inc.
- Positioned in cloud security with growing competition risk.
- Focused on cloud security, SaaS access, and workload segmentation.
- Faces disruption in cloud security and SaaS application spaces.
VeriSign, Inc.
- Leading domain registry with stable market and less pressure.
- Specializes in domain registry and internet infrastructure.
- Less exposed, operates critical internet infrastructure.
Zscaler, Inc. vs VeriSign, Inc. Positioning
Zscaler pursues a diversified cloud security platform across industries, potentially increasing growth opportunities but also competition. VeriSign concentrates on domain registry and internet infrastructure, offering stability but limited diversification.
Which has the best competitive advantage?
VeriSign exhibits a very favorable MOAT with strong value creation and durable competitive advantage, while Zscaler shows a slightly unfavorable MOAT, currently destroying value despite improving profitability.
Stock Comparison
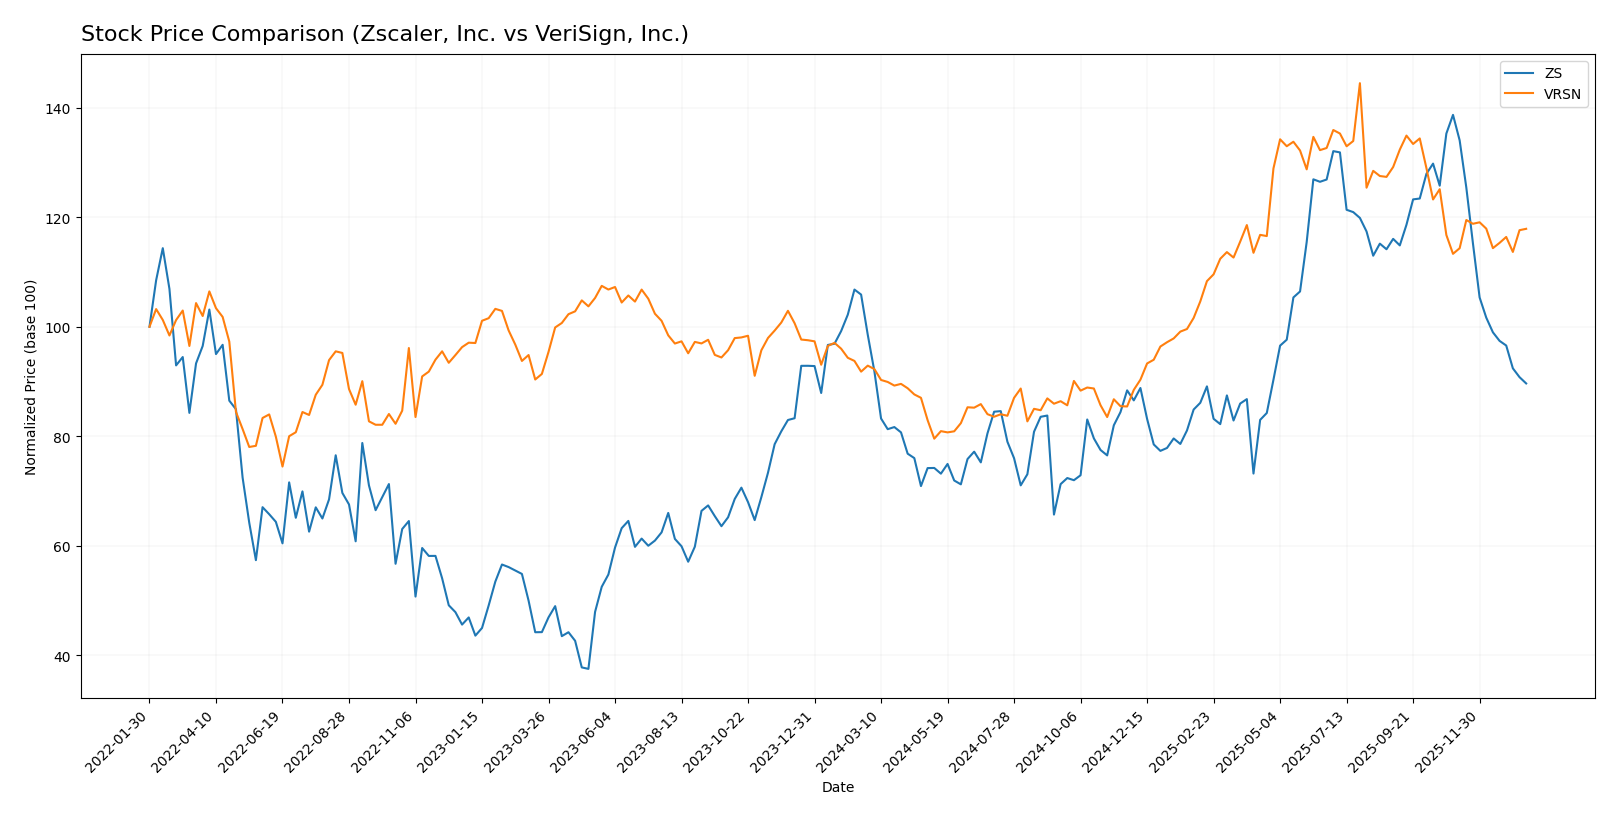
The stock price chart over the past year reveals contrasting trajectories for Zscaler, Inc. and VeriSign, Inc., highlighting a bearish trend for Zscaler and a bullish yet decelerating trend for VeriSign amid shifting trading volumes.
Trend Analysis
Zscaler, Inc. (ZS) exhibited a bearish trend with a -9.03% price decline over the past 12 months, marked by deceleration and high volatility (std deviation 47.11). The stock peaked at 331.14 and bottomed at 156.78.
VeriSign, Inc. (VRSN) showed a bullish trend with a 26.92% price increase over the past year, though with deceleration and moderate volatility (std deviation 40.88). The highest price reached 305.79, and the lowest was 168.32.
Between the two, VeriSign outperformed with a positive market trend and price appreciation, while Zscaler experienced a significant decline over the same period.
Target Prices
Analysts present a clear target price consensus for Zscaler, Inc. and VeriSign, Inc.
| Company | Target High | Target Low | Consensus |
|---|---|---|---|
| Zscaler, Inc. | 360 | 260 | 311.41 |
| VeriSign, Inc. | 325 | 325 | 325 |
The consensus target prices indicate strong upside potential for both stocks compared to current prices of $213.98 for Zscaler and $249.47 for VeriSign, reflecting positive analyst expectations in the software infrastructure sector.
Analyst Opinions Comparison
This section compares analysts’ ratings and grades for Zscaler, Inc. and VeriSign, Inc.:
Rating Comparison
Zscaler, Inc. Rating
- Rating: C-, indicating a very favorable status
- Discounted Cash Flow Score: 4, favorable rating
- ROE Score: 1, very unfavorable
- ROA Score: 1, very unfavorable
- Debt To Equity Score: 1, very unfavorable
- Overall Score: 1, very unfavorable
VeriSign, Inc. Rating
- Rating: B-, indicating a very favorable status
- Discounted Cash Flow Score: 4, favorable rating
- ROE Score: 1, very unfavorable
- ROA Score: 5, very favorable
- Debt To Equity Score: 1, very unfavorable
- Overall Score: 2, moderate
Which one is the best rated?
VeriSign holds a better overall rating with a B- and a moderate overall score of 2, compared to Zscaler’s C- and very unfavorable overall score of 1. VeriSign also outperforms Zscaler on the ROA score, while other scores are similar or unfavorable.
Scores Comparison
Here is a comparison of the Altman Z-Score and Piotroski Score for the two companies:
ZS Scores
- Altman Z-Score: 4.89, indicating a safe zone with low bankruptcy risk.
- Piotroski Score: 3, classified as very weak financial strength.
VRSN Scores
- Altman Z-Score: -4.67, indicating a distress zone with high bankruptcy risk.
- Piotroski Score: 8, classified as very strong financial strength.
Which company has the best scores?
ZS has a much higher Altman Z-Score, placing it in the safe zone, while VRSN is in distress. Conversely, VRSN’s Piotroski Score shows very strong financial health, surpassing ZS’s very weak score. Each company leads in one score category.
Grades Comparison
Here is the comparison of recent grades assigned by reputable financial institutions to both companies:
Zscaler, Inc. Grades
The following table summarizes recent grades from leading financial analysts for Zscaler, Inc.:
| Grading Company | Action | New Grade | Date |
|---|---|---|---|
| Citigroup | Maintain | Buy | 2026-01-13 |
| Keybanc | Maintain | Overweight | 2026-01-12 |
| Piper Sandler | Maintain | Neutral | 2026-01-05 |
| RBC Capital | Maintain | Outperform | 2026-01-05 |
| Mizuho | Upgrade | Outperform | 2025-12-16 |
| Bernstein | Downgrade | Market Perform | 2025-12-01 |
| Citigroup | Maintain | Buy | 2025-12-01 |
| JP Morgan | Maintain | Overweight | 2025-11-26 |
| Baird | Maintain | Outperform | 2025-11-26 |
| BTIG | Maintain | Buy | 2025-11-26 |
Zscaler’s grades predominantly show Buy, Overweight, and Outperform ratings with few downgrades, indicating a generally positive analyst sentiment and some recent upgrades.
VeriSign, Inc. Grades
The following table summarizes recent grades from leading financial analysts for VeriSign, Inc.:
| Grading Company | Action | New Grade | Date |
|---|---|---|---|
| JP Morgan | Maintain | Neutral | 2026-01-06 |
| Baird | Maintain | Outperform | 2025-07-01 |
| Baird | Maintain | Outperform | 2025-04-25 |
| Baird | Maintain | Outperform | 2025-04-01 |
| Citigroup | Maintain | Buy | 2025-02-04 |
| Citigroup | Maintain | Buy | 2025-01-03 |
| Baird | Upgrade | Outperform | 2024-12-09 |
| Baird | Maintain | Neutral | 2024-06-27 |
| Baird | Maintain | Neutral | 2024-04-26 |
| Citigroup | Maintain | Buy | 2024-04-02 |
VeriSign’s grades mostly reflect Buy and Outperform ratings with some Neutral ratings, showing consistent analyst confidence and some recent upgrades.
Which company has the best grades?
Both companies hold a consensus “Buy” rating, but Zscaler, Inc. displays a slightly broader range of higher grades including several Outperform and Overweight ratings in recent months. This may reflect stronger analyst conviction, potentially impacting investor sentiment and risk assessment differently compared to VeriSign, Inc.’s more stable Neutral and Outperform ratings.
Strengths and Weaknesses
Below is a comparative table summarizing the key strengths and weaknesses of Zscaler, Inc. (ZS) and VeriSign, Inc. (VRSN) based on the most recent financial and strategic data available.
| Criterion | Zscaler, Inc. (ZS) | VeriSign, Inc. (VRSN) |
|---|---|---|
| Diversification | Moderate – primarily focused on cloud security | Limited – core focus on domain name registry services |
| Profitability | Weak – negative net margin (-1.55%) and ROIC (-3.18%) | Strong – high net margin (50.45%) and ROIC (451.0%) |
| Innovation | Growing ROIC trend indicates improving innovation | Very favorable moat with durable profitability growth |
| Global presence | Solid global reach in cybersecurity sector | Strong global presence in internet infrastructure |
| Market Share | Growing but currently shedding value (ROIC vs WACC negative) | Dominant market position with strong economic moat |
Key takeaways: VeriSign demonstrates a durable competitive advantage with robust profitability and market dominance, making it a favorable investment. Zscaler shows improving innovation and ROIC trends but currently lacks profitability and is slightly unfavorable in value creation, signaling caution for investors.
Risk Analysis
Below is a comparative table summarizing key risks for Zscaler, Inc. (ZS) and VeriSign, Inc. (VRSN) based on the most recent data available in 2026:
| Metric | Zscaler, Inc. (ZS) | VeriSign, Inc. (VRSN) |
|---|---|---|
| Market Risk | Moderate (Beta 1.02) | Lower (Beta 0.77) |
| Debt level | Moderate (Debt/Assets 28%) | High (Debt/Assets 128%) |
| Regulatory Risk | Moderate (Cloud security laws) | Moderate (Domain registry rules) |
| Operational Risk | Moderate (Cloud infrastructure) | Low (Stable internet infrastructure) |
| Environmental Risk | Low (Software sector) | Low (Internet infrastructure) |
| Geopolitical Risk | Moderate (Global operations) | Low (US-centric operations) |
Zscaler faces moderate market and regulatory risks due to its cloud security focus and global footprint, alongside moderate operational risks related to complex infrastructure. VeriSign’s highest risk is its elevated debt level (128% debt to assets), posing financial vulnerability despite strong operational stability. Zscaler’s beta near 1 indicates average market volatility, while VeriSign’s lower beta suggests less price fluctuation, reducing market risk impact. Investors should weigh VeriSign’s financial leverage risk against Zscaler’s operational and market exposure.
Which Stock to Choose?
Zscaler, Inc. (ZS) shows strong revenue growth of 23.3% in 2025 with favorable income statement trends, but profitability remains negative with a net margin of -1.55% and unfavorable returns on equity and capital. Its debt profile is moderate and liquidity ratios are favorable, yet its overall rating is very favorable despite mixed financial ratios and a slightly unfavorable moat indicating value destruction.
VeriSign, Inc. (VRSN) presents a solid income statement with a high net margin of 50.45% and increasing profitability, though revenue growth is modest at 4.3%. Financial ratios are mostly favorable with a very favorable moat suggesting strong value creation, but liquidity is weak and the overall rating is very favorable with some mixed debt signals.
Investors with a growth orientation might find Zscaler’s improving income growth and liquidity metrics appealing despite its current profitability challenges, while those prioritizing value and competitive moat strength may see VeriSign’s durable profitability and favorable financial ratios as more aligned with their profile.
Disclaimer: Investment carries a risk of loss of initial capital. The past performance is not a reliable indicator of future results. Be sure to understand risks before making an investment decision.
Go Further
I encourage you to read the complete analyses of Zscaler, Inc. and VeriSign, Inc. to enhance your investment decisions: