In the dynamic world of technology infrastructure, VeriSign, Inc. and Wix.com Ltd. stand out as influential players shaping the digital landscape. VeriSign specializes in domain name registry and internet security, while Wix offers a comprehensive cloud-based platform for website creation and business solutions. Both companies innovate within software infrastructure, serving millions globally. This article will help you determine which company presents the most compelling investment opportunity in 2026.
Table of contents
Companies Overview
I will begin the comparison between VeriSign and Wix.com by providing an overview of these two companies and their main differences.
VeriSign Overview
VeriSign, Inc. specializes in domain name registry services and internet infrastructure that supports global internet navigation. The company operates key internet root servers and manages the authoritative registration for the .com and .net domains, crucial for e-commerce worldwide. VeriSign focuses on internet security, stability, and data integrity, positioning itself as a backbone provider in the software infrastructure industry.
Wix.com Overview
Wix.com Ltd. develops a cloud-based platform that allows users globally to create websites and web applications easily. Its suite includes drag-and-drop editors, AI-powered logo makers, payment solutions, and business automation tools. With over 222M registered users and 6M premium subscriptions, Wix serves a diverse market, emphasizing user empowerment and comprehensive digital business solutions across multiple continents.
Key similarities and differences
Both VeriSign and Wix operate in the software infrastructure sector, but their business models differ significantly. VeriSign provides foundational internet services focused on domain registry and security, while Wix offers a user-friendly platform for website creation and digital business management. VeriSign’s services are core internet infrastructure, whereas Wix targets end-users and small to medium businesses with customizable online tools and applications.
Income Statement Comparison
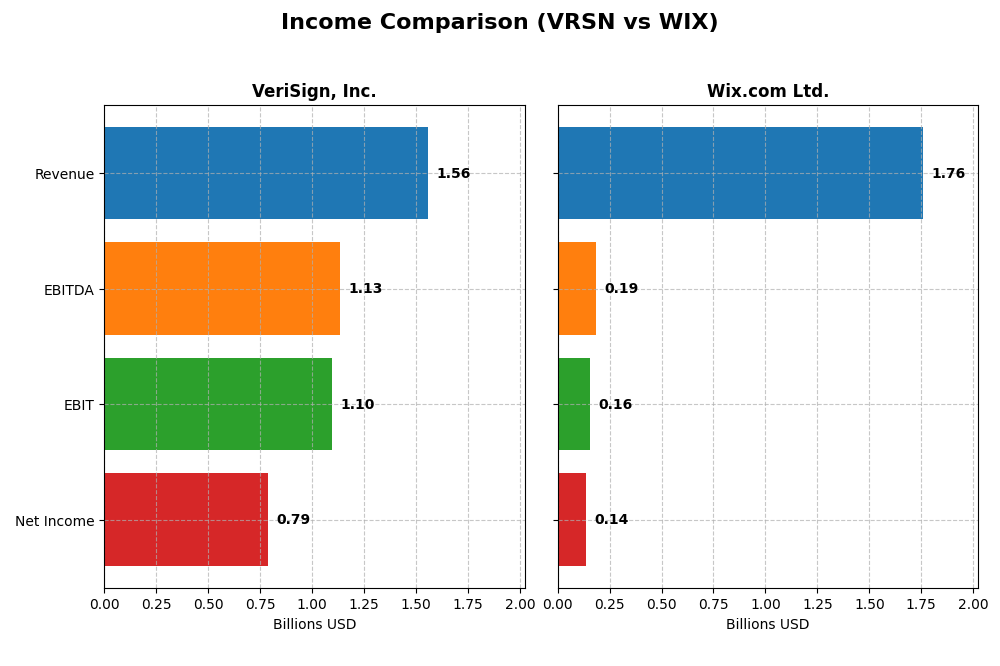
This table compares key income statement metrics for VeriSign, Inc. and Wix.com Ltd. based on their most recent fiscal year data.
| Metric | VeriSign, Inc. (VRSN) | Wix.com Ltd. (WIX) |
|---|---|---|
| Market Cap | 23.1B | 4.46B |
| Revenue | 1.56B | 1.76B |
| EBITDA | 1.13B | 186M |
| EBIT | 1.10B | 155M |
| Net Income | 786M | 138M |
| EPS | 8.01 | 2.49 |
| Fiscal Year | 2024 | 2024 |
Income Statement Interpretations
VeriSign, Inc.
VeriSign’s revenue showed a favorable overall growth of 23.11% from 2020 to 2024, with a slight 4.31% increase in the latest year. Net income declined 3.58% over the period and showed a 7.87% decrease in net margin in 2024. Despite this, gross and EBIT margins remain strong at 87.7% and 70.5%, respectively, reflecting stable profitability, although net margin contracted recently.
Wix.com Ltd.
Wix demonstrated robust revenue growth of 78.9% over 2020-2024 and a strong 12.7% increase in 2024. Net income surged 183% overall, with a remarkable 270% gain in net margin and EPS growth in the last year. Gross margin is solid at 67.9%, and EBIT margin improved significantly, indicating expanding profitability alongside growing operating expenses.
Which one has the stronger fundamentals?
Wix displays stronger growth fundamentals, with consistently favorable trends in revenue, net income, and margin expansions reflecting operational scaling. VeriSign maintains solid margins and profitability but faces some recent net margin pressure and net income decline. Wix’s rapid improvement in profitability contrasts with VeriSign’s more stable but slower growth profile.
Financial Ratios Comparison
The table below presents the key financial ratios for VeriSign, Inc. (VRSN) and Wix.com Ltd. (WIX) based on their most recent fiscal year data from 2024.
| Ratios | VeriSign, Inc. (VRSN) | Wix.com Ltd. (WIX) |
|---|---|---|
| ROE | -40.1% | -175.6% |
| ROIC | 4.51% | 9.13% |
| P/E | 25.8 | 86.2 |
| P/B | -10.4 | -151.4 |
| Current Ratio | 0.43 | 0.84 |
| Quick Ratio | 0.43 | 0.84 |
| D/E | -0.92 (negative) | -12.31 (negative) |
| Debt-to-Assets | 128.1% (above 100%) | 50.7% |
| Interest Coverage | 14.1 | 25.9 |
| Asset Turnover | 1.11 | 0.92 |
| Fixed Asset Turnover | 6.66 | 3.33 |
| Payout ratio | 0 | 0 |
| Dividend yield | 0% | 0% |
Interpretation of the Ratios
VeriSign, Inc.
VeriSign shows a mixed ratio profile with strong net margin at 50.45% and a high return on invested capital (ROIC) of 451%, indicating operational efficiency. However, the company struggles with negative return on equity (ROE) at -40.13% and a low current ratio of 0.43, raising liquidity concerns. It pays no dividend, likely focusing on sustaining growth and reinvestment strategies.
Wix.com Ltd.
Wix has a moderate net margin of 7.86% and a ROIC of 9.13%, reflecting average profitability. The company’s ROE is deeply negative at -175.57%, signaling profitability challenges. Liquidity ratios are below ideal, with a current ratio of 0.84. Wix does not pay dividends, which aligns with its growth phase and prioritization of R&D and acquisitions over shareholder payouts.
Which one has the best ratios?
VeriSign presents a more favorable overall ratio profile with a majority of ratios positive, strong operational returns, and robust interest coverage. Wix’s ratios are more mixed, with higher unfavorable and neutral scores, reflecting ongoing growth investments and profitability struggles. VeriSign’s ratios suggest stronger financial health relative to Wix.
Strategic Positioning
This section compares the strategic positioning of VeriSign, Inc. and Wix.com Ltd., including their market position, key segments, and exposure to technological disruption:
VeriSign, Inc.
- Leading domain registry with authoritative control over .com and .net domains; low beta indicates stable competitive pressure.
- Focuses on domain name registry, internet infrastructure, and root zone maintainer services supporting global e-commerce.
- Operates critical internet infrastructure with high barriers to entry; technology disruption risk is limited by regulatory and technical complexity.
Wix.com Ltd.
- Cloud-based website platform with diverse global user base; higher beta suggests more market volatility and competitive pressure.
- Key revenue drivers are Creative Subscription and Business Solutions, offering website creation, payments, and business automation tools.
- Faces disruption risk due to fast-evolving cloud services and web development technologies but maintains innovation through AI and app marketplace.
VeriSign, Inc. vs Wix.com Ltd. Positioning
VeriSign’s strategy centers on a concentrated, infrastructure-based niche with durable internet registry services, providing stable revenue streams. Wix adopts a diversified approach across creative tools and business solutions, increasing growth potential but also competitive and technological risks.
Which has the best competitive advantage?
VeriSign demonstrates a very favorable MOAT with strong value creation and growing ROIC, indicating a durable competitive advantage. Wix shows a slightly unfavorable MOAT, currently shedding value despite improving profitability.
Stock Comparison
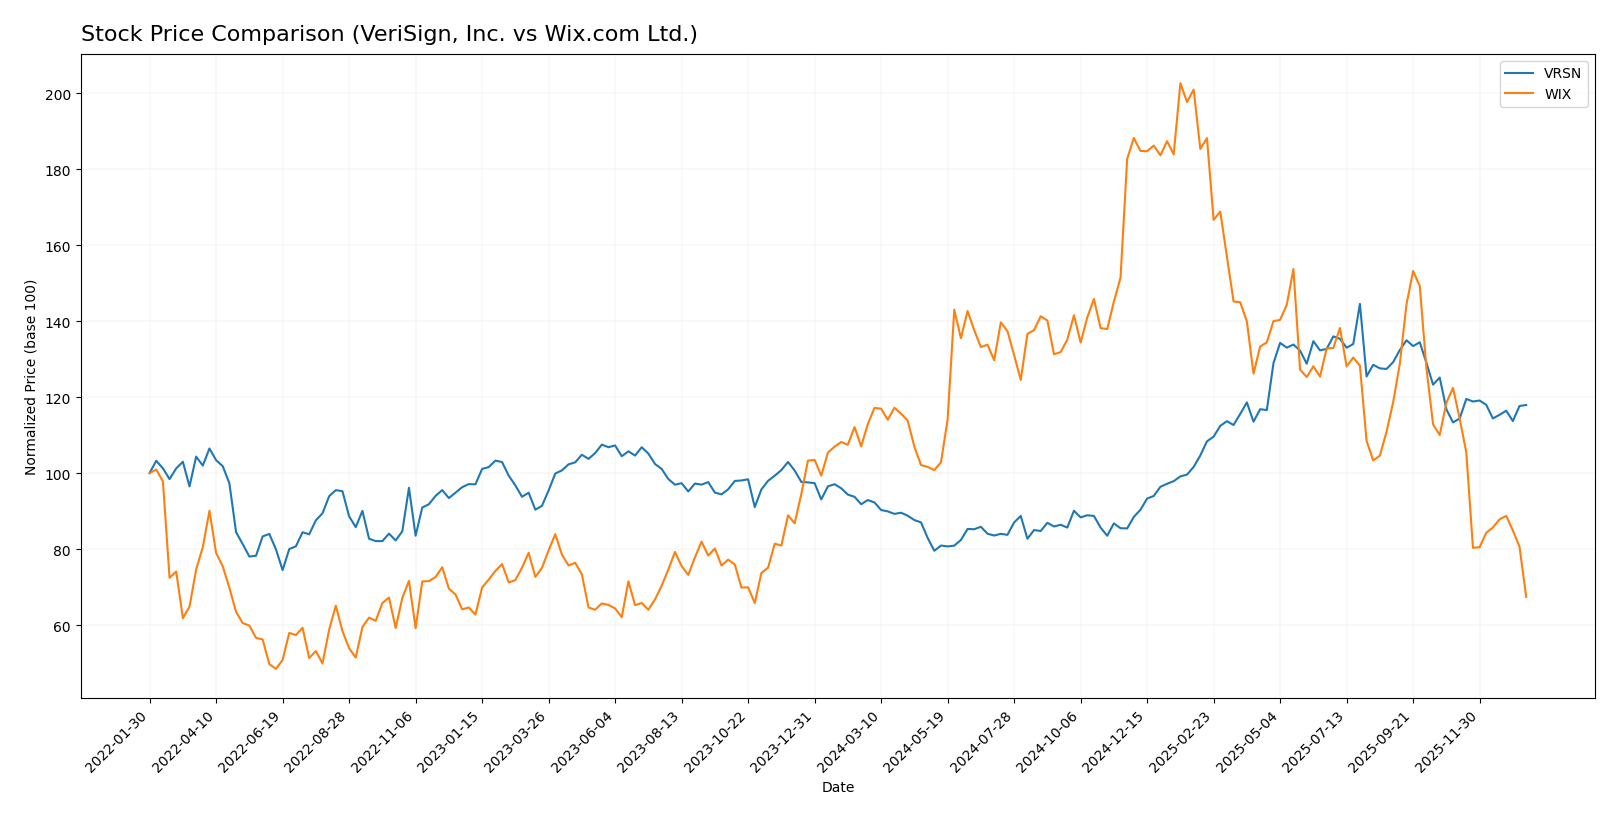
The stock prices of VeriSign, Inc. and Wix.com Ltd. have shown divergent trajectories over the past 12 months, with VeriSign experiencing a notable bullish rise and Wix.com facing a significant bearish decline.
Trend Analysis
VeriSign, Inc. recorded a 26.92% price increase over the past year, indicating a bullish trend with decelerating momentum and a high volatility level (std deviation 40.88). The stock peaked at 305.79 and bottomed at 168.32.
Wix.com Ltd. showed a 40.28% price decrease over the same period, reflecting a bearish trend with decelerating pace and substantial volatility (std deviation 34.39). The stock’s highest and lowest prices were 240.89 and 80.16, respectively.
Comparing both stocks, VeriSign delivered the highest market performance with a strong upward trend, while Wix.com experienced a marked downward trajectory during the 12-month span.
Target Prices
The target consensus for these companies reflects a range of analyst expectations.
| Company | Target High | Target Low | Consensus |
|---|---|---|---|
| VeriSign, Inc. | 325 | 325 | 325 |
| Wix.com Ltd. | 210 | 70 | 160.27 |
Analysts see VeriSign’s stock price rising to 325, well above its current 249.47, indicating strong confidence. Wix’s wider target range suggests uncertainty but an average consensus nearly doubling its current 80.16 price.
Analyst Opinions Comparison
This section compares analysts’ ratings and grades for VeriSign, Inc. and Wix.com Ltd.:
Rating Comparison
VeriSign, Inc. Rating
- Rating: B-, classified as Very Favorable.
- Discounted Cash Flow Score: 4, indicating Favorable valuation.
- ROE Score: 1, considered Very Unfavorable efficiency.
- ROA Score: 5, showing Very Favorable asset use.
- Debt To Equity Score: 1, classified as Very Unfavorable financial risk.
- Overall Score: 2, considered Moderate overall standing.
Wix.com Ltd. Rating
- Rating: C, classified as Very Favorable.
- Discounted Cash Flow Score: 3, indicating Moderate valuation.
- ROE Score: 1, also Very Unfavorable efficiency.
- ROA Score: 4, showing Favorable asset use.
- Debt To Equity Score: 1, classified as Very Unfavorable financial risk.
- Overall Score: 2, considered Moderate overall standing.
Which one is the best rated?
VeriSign holds a better rating at B- compared to Wix’s C, with a stronger Discounted Cash Flow and Return on Assets score. Both share low ROE and debt-to-equity scores, resulting in similar overall scores of 2.
Scores Comparison
Here is a comparison of the Altman Z-Score and Piotroski Score for VeriSign and Wix:
VeriSign Scores
- Altman Z-Score: -4.67, indicating financial distress zone risk
- Piotroski Score: 8, categorized as very strong financial health
Wix Scores
- Altman Z-Score: 1.83, reflecting a moderate bankruptcy risk
- Piotroski Score: 6, indicating average financial strength
Which company has the best scores?
VeriSign exhibits a very strong Piotroski Score of 8 but is in the distress zone for Altman Z-Score. Wix has a better Altman Z-Score in the grey zone but a lower Piotroski Score of 6.
Grades Comparison
The following section compares the latest grades issued by reputable financial institutions for VeriSign, Inc. and Wix.com Ltd.:
VeriSign, Inc. Grades
Below is a summary of VeriSign’s recent grades from established grading companies.
| Grading Company | Action | New Grade | Date |
|---|---|---|---|
| JP Morgan | Maintain | Neutral | 2026-01-06 |
| Baird | Maintain | Outperform | 2025-07-01 |
| Baird | Maintain | Outperform | 2025-04-25 |
| Baird | Maintain | Outperform | 2025-04-01 |
| Citigroup | Maintain | Buy | 2025-02-04 |
| Citigroup | Maintain | Buy | 2025-01-03 |
| Baird | Upgrade | Outperform | 2024-12-09 |
| Baird | Maintain | Neutral | 2024-06-27 |
| Baird | Maintain | Neutral | 2024-04-26 |
| Citigroup | Maintain | Buy | 2024-04-02 |
The overall trend for VeriSign shows a mostly positive outlook with several “Outperform” and “Buy” grades, indicating confidence in the stock’s potential.
Wix.com Ltd. Grades
The table below presents Wix.com’s latest grades from credible financial analysts.
| Grading Company | Action | New Grade | Date |
|---|---|---|---|
| Morgan Stanley | Maintain | Overweight | 2026-01-15 |
| Wells Fargo | Maintain | Overweight | 2025-12-19 |
| Cantor Fitzgerald | Maintain | Overweight | 2025-12-11 |
| Wells Fargo | Maintain | Overweight | 2025-11-20 |
| Barclays | Maintain | Overweight | 2025-11-20 |
| Citizens | Maintain | Market Outperform | 2025-11-20 |
| Citigroup | Maintain | Buy | 2025-11-20 |
| Scotiabank | Maintain | Sector Outperform | 2025-11-20 |
| Needham | Maintain | Buy | 2025-11-20 |
| Evercore ISI Group | Maintain | Outperform | 2025-11-20 |
Wix.com’s grades consistently reflect a strong positive consensus, with multiple “Overweight,” “Buy,” and “Outperform” ratings, signaling strong analyst confidence.
Which company has the best grades?
Wix.com Ltd. has received a broader and more consistently positive set of grades compared to VeriSign, Inc., with numerous “Overweight” and “Buy” ratings from top firms. This suggests stronger analyst conviction, which may influence investor sentiment and portfolio decisions.
Strengths and Weaknesses
Below is a comparison table highlighting the strengths and weaknesses of VeriSign, Inc. (VRSN) and Wix.com Ltd. (WIX) based on their recent financial performance and strategic positioning.
| Criterion | VeriSign, Inc. (VRSN) | Wix.com Ltd. (WIX) |
|---|---|---|
| Diversification | Focused on domain name services with a consistent niche market; limited diversification. | More diversified revenue streams with Business Solutions and Creative Subscription segments. |
| Profitability | High net margin (50.45%) and strong ROIC (451%), but negative ROE and some liquidity concerns. | Moderate net margin (7.86%) and neutral ROIC (9.13%), but negative ROE and high P/E ratio. |
| Innovation | Demonstrates durable competitive advantage with growing ROIC; strong asset turnover metrics. | Growing profitability with innovative subscription models, though value is still being lost. |
| Global presence | Strong global presence as a critical internet infrastructure player. | Global reach through online platform services, expanding customer base worldwide. |
| Market Share | Holds a dominant position in domain registration and internet infrastructure. | Competitive in web development platforms but faces intense competition. |
Key takeaways: VeriSign exhibits a very favorable moat with high profitability and efficient capital use but faces some financial structure risks. Wix shows promising growth and diversification but currently struggles with value creation and profitability metrics. Investors should weigh VeriSign’s stability against Wix’s growth potential with caution.
Risk Analysis
Below is a comparative risk table for VeriSign, Inc. (VRSN) and Wix.com Ltd. (WIX) based on the most recent 2024 data:
| Metric | VeriSign, Inc. (VRSN) | Wix.com Ltd. (WIX) |
|---|---|---|
| Market Risk | Moderate (Beta 0.77, stable range) | Higher (Beta 1.42, volatile range) |
| Debt level | High debt-to-assets at 128% (unfavorable) | Moderate debt-to-assets at 51% (unfavorable) |
| Regulatory Risk | Moderate (US tech infrastructure) | Moderate-High (International exposure, Israel-based) |
| Operational Risk | Low (Stable infrastructure services) | Moderate (High employee count, complex cloud platform) |
| Environmental Risk | Low (Digital infrastructure focus) | Low (Cloud-based services) |
| Geopolitical Risk | Low (US-based, stable jurisdiction) | Moderate-High (International operations with geopolitical exposure) |
VeriSign’s most impactful risk is its elevated debt-to-assets ratio (128%), which could pressure financial stability despite strong operational margins and infrastructure stability. Wix faces higher market volatility and geopolitical risk due to its global presence and higher beta, compounded by moderate financial leverage. Investors should weigh VeriSign’s financial leverage against Wix’s operational and geopolitical uncertainties.
Which Stock to Choose?
VeriSign, Inc. (VRSN) shows a generally favorable income evolution with steady revenue growth of 23.11% over five years, supported by strong profitability metrics like a 50.45% net margin and a robust ROIC of 451%, despite a negative ROE and moderate debt concerns. Its financial ratios are mostly favorable, reflecting efficient asset use and solid value creation, complemented by a very favorable moat rating and a B- overall rating.
Wix.com Ltd. (WIX) demonstrates vigorous income growth, with revenue up 78.86% over five years and improving profitability indicators, including a 7.86% net margin and positive net income growth. However, financial ratios are mixed to slightly unfavorable, with high P/E and negative ROE, a slightly unfavorable moat rating, and a C overall rating, alongside a grey zone Altman Z-score indicating moderate financial risk.
Investors favoring durable competitive advantages and consistent value creation might find VeriSign’s profile more aligned with quality investing, while those prioritizing high growth potential despite financial uncertainties could interpret Wix’s metrics as fitting growth-oriented strategies, recognizing its improving profitability but also its higher risk signals.
Disclaimer: Investment carries a risk of loss of initial capital. The past performance is not a reliable indicator of future results. Be sure to understand risks before making an investment decision.
Go Further
I encourage you to read the complete analyses of VeriSign, Inc. and Wix.com Ltd. to enhance your investment decisions: