VeriSign, Inc. and Veritone, Inc. both operate in the software infrastructure sector but tackle distinct challenges within the technology landscape. VeriSign specializes in domain name registry services and internet security, underpinning global web navigation. Veritone focuses on artificial intelligence solutions, offering advanced AI-powered data insights across industries. This article will analyze their market positions and innovation strategies to help you identify the most promising investment opportunity.
Table of contents
Companies Overview
I will begin the comparison between VeriSign and Veritone by providing an overview of these two companies and their main differences.
VeriSign Overview
VeriSign, Inc. focuses on providing domain name registry services and internet infrastructure to enable secure navigation of recognized domain names globally. It operates root zone maintainer services and authoritative resolution for major domains like .com and .net, supporting global e-commerce. Established in 1995 and headquartered in Reston, Virginia, VeriSign plays a critical role in maintaining internet stability and security.
Veritone Overview
Veritone, Inc. offers artificial intelligence computing solutions through its aiWARE platform, which leverages machine learning and cognitive processes to analyze structured and unstructured data. Founded in 2014 and based in Denver, Colorado, Veritone serves diverse sectors including media, government, and energy, providing services such as media planning, analytics, and AI-driven insights to optimize decision-making.
Key similarities and differences
Both VeriSign and Veritone operate in the technology sector focusing on software infrastructure, yet their core businesses diverge significantly. VeriSign specializes in internet infrastructure and domain registry services, emphasizing security and stability. In contrast, Veritone develops AI platforms and services aimed at data analysis and media solutions. While VeriSign has a longer market presence and larger scale, Veritone targets emerging AI-driven markets with a higher beta, reflecting greater volatility.
Income Statement Comparison
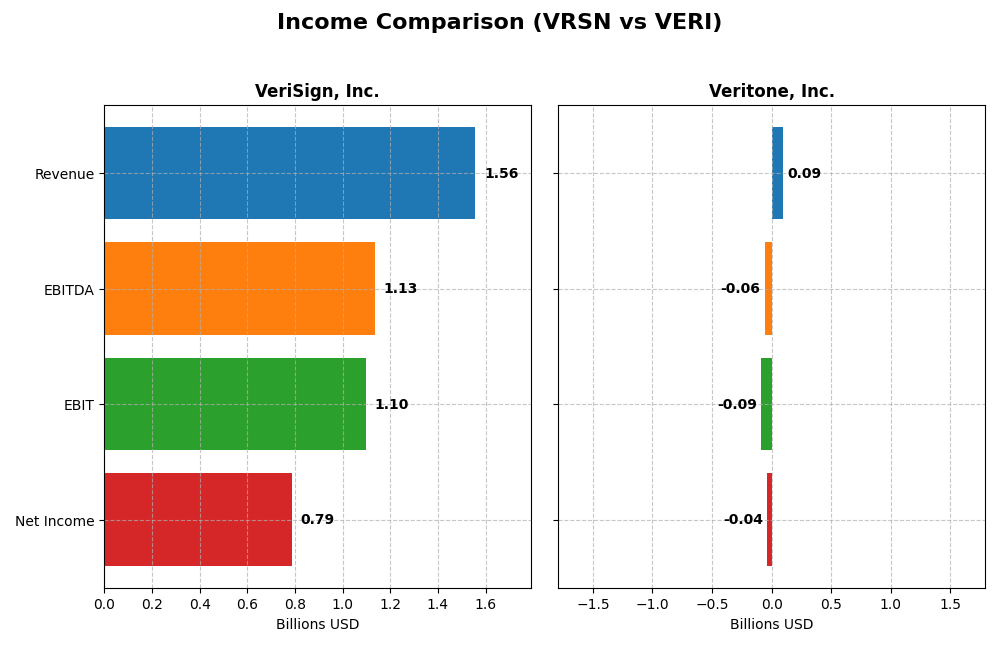
The table below presents a side-by-side comparison of key income statement metrics for VeriSign, Inc. and Veritone, Inc. for the fiscal year 2024.
| Metric | VeriSign, Inc. (VRSN) | Veritone, Inc. (VERI) |
|---|---|---|
| Market Cap | 23.1B | 225M |
| Revenue | 1.56B | 93M |
| EBITDA | 1.13B | -59M |
| EBIT | 1.10B | -88M |
| Net Income | 786M | -37M |
| EPS | 8.01 | -0.98 |
| Fiscal Year | 2024 | 2024 |
Income Statement Interpretations
VeriSign, Inc.
VeriSign has experienced consistent revenue growth from 2020 to 2024, reaching $1.56B in 2024, with net income showing slight fluctuations but generally strong, ending at $786M. Gross and EBIT margins remain robust, above 70%, though net margin declined by nearly 8% in 2024. The latest year shows moderate revenue growth of 4.3% but a small net margin contraction, indicating margin pressures despite solid profitability.
Veritone, Inc.
Veritone’s revenue grew overall by 60.5% from 2020 to 2024 but declined 7.4% in the last year to $93M. Net income turned less negative, improving by 22% over the period, with a smaller net loss of $37M in 2024. Margins remain challenged with a negative EBIT margin near -95%, though recent net margin and EPS growth are favorable, reflecting some operational improvement despite ongoing losses.
Which one has the stronger fundamentals?
VeriSign displays stronger fundamentals with consistently high gross and EBIT margins, positive net income, and steady revenue growth, though with some recent margin pressure. Veritone shows faster revenue growth but remains unprofitable with significant negative margins and losses, despite recent improvements. VeriSign’s stable profitability and margin strength position it with more favorable income fundamentals overall.
Financial Ratios Comparison
This table compares key financial ratios for VeriSign, Inc. and Veritone, Inc. based on their most recent fiscal year data (2024), providing a snapshot of their financial health and performance.
| Ratios | VeriSign, Inc. (VRSN) | Veritone, Inc. (VERI) |
|---|---|---|
| ROE | -40.1% | -277.9% |
| ROIC | 4.51% | -58.3% |
| P/E | 25.8 | -3.34 |
| P/B | -10.4 | 9.27 |
| Current Ratio | 0.43 | 0.97 |
| Quick Ratio | 0.43 | 0.97 |
| D/E (Debt-to-Equity) | -0.92 | 8.91 |
| Debt-to-Assets | 128.1% | 60.5% |
| Interest Coverage | 14.1 | -7.31 |
| Asset Turnover | 1.11 | 0.47 |
| Fixed Asset Turnover | 6.66 | 8.51 |
| Payout Ratio | 0 | 0 |
| Dividend Yield | 0 | 0 |
Interpretation of the Ratios
VeriSign, Inc.
VeriSign shows a generally favorable ratio profile with strong net margin at 50.45% and a high return on invested capital (451%), indicating efficient capital use. However, its negative return on equity (-40.13%) and low current ratio (0.43) raise liquidity and shareholder value concerns. The company pays dividends, but dividend yield is currently zero, signaling no recent payouts.
Veritone, Inc.
Veritone’s ratios are largely unfavorable, including a negative net margin (-40.36%) and poor return on equity (-277.91%), reflecting ongoing losses and inefficient capital use. Its current ratio near 0.97 indicates limited liquidity, while high debt-to-equity (8.91) suggests financial risk. Veritone does not pay dividends, likely due to its negative income and focus on reinvestment.
Which one has the best ratios?
Comparing both, VeriSign holds a more favorable overall ratio profile with stronger profitability and capital efficiency despite some liquidity challenges. Veritone’s ratios indicate significant financial stress and operational inefficiency, resulting in a very unfavorable evaluation. Thus, VeriSign displays superior financial ratio strength based on the available data.
Strategic Positioning
This section compares the strategic positioning of VeriSign, Inc. and Veritone, Inc., covering Market position, Key segments, and Exposure to technological disruption:
VeriSign, Inc.
- Strong market position as domain registry with low beta and stable revenue streams.
- Focused on domain name registry and internet infrastructure services globally.
- Operates critical internet infrastructure with limited direct disruption risk noted.
Veritone, Inc.
- Smaller market cap, higher beta, operating in AI solutions with more volatile financial metrics.
- Diverse AI-driven offerings including licensing, managed services, software products, and advertising.
- Faces potential disruption due to rapid AI technology evolution and competitive AI platform development.
VeriSign, Inc. vs Veritone, Inc. Positioning
VeriSign maintains a concentrated strategy centered on domain registry and internet infrastructure, providing stability. Veritone pursues diversification with AI platforms and media services, exposing it to more dynamic market shifts but broader opportunities.
Which has the best competitive advantage?
VeriSign demonstrates a very favorable MOAT with strong, growing ROIC above WACC, indicating durable competitive advantage. Veritone’s declining ROIC and negative MOAT suggest it currently lacks a sustainable competitive advantage.
Stock Comparison
The past year has seen VeriSign, Inc. (VRSN) exhibit a steady bullish trend with a 26.92% price increase, while Veritone, Inc. (VERI) showed a more pronounced bullish trend overall but faced recent price declines, reflecting contrasting trading dynamics.
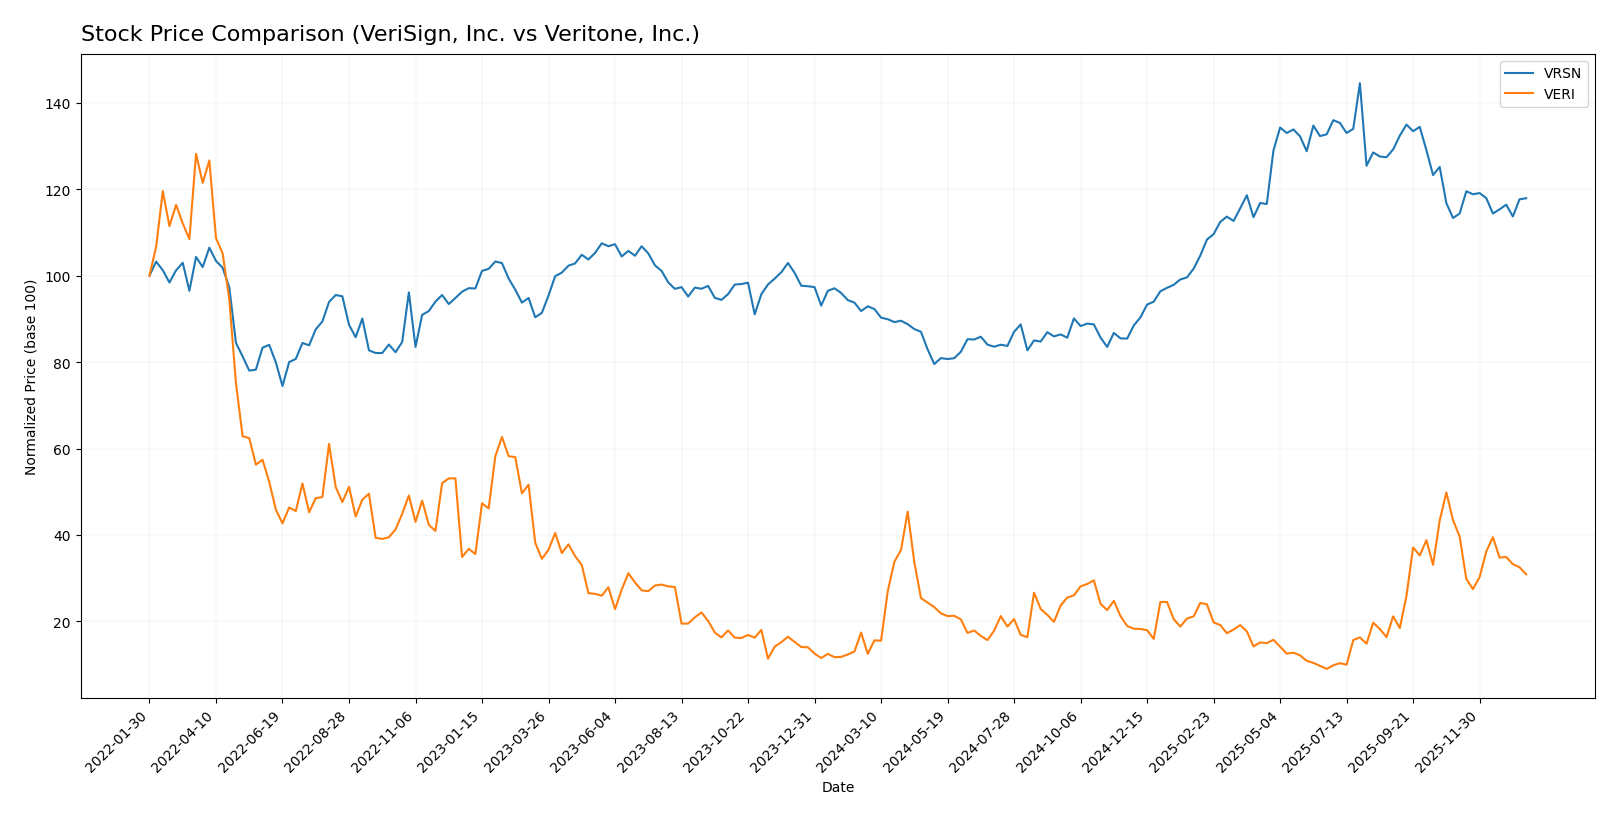
Trend Analysis
VeriSign, Inc. (VRSN) recorded a bullish trend over the past 12 months with a 26.92% price rise, decelerating recently with a modest 4.03% gain and moderate volatility (std dev 40.88).
Veritone, Inc. (VERI) showed a strong bullish trend with a 147.22% increase over the year but experienced a recent bearish correction of -28.91%, accompanied by low volatility (std dev 1.26).
Comparing both, VERI delivered the highest market performance over the 12-month period despite recent weakness, outperforming VRSN’s more stable but lower overall gains.
Target Prices
The consensus target prices indicate optimistic outlooks for both VeriSign, Inc. and Veritone, Inc.
| Company | Target High | Target Low | Consensus |
|---|---|---|---|
| VeriSign, Inc. | 325 | 325 | 325 |
| Veritone, Inc. | 10 | 9 | 9.5 |
Analysts expect VeriSign to reach $325, well above its current $249.47 price, while Veritone’s target consensus near $9.5 suggests significant upside from its $4.45 trading level.
Analyst Opinions Comparison
This section compares analysts’ ratings and grades for VeriSign, Inc. and Veritone, Inc.:
Rating Comparison
VRSN Rating
- Rating: B-, considered very favorable.
- Discounted Cash Flow Score: 4, indicating a favorable valuation based on future cash flows.
- ROE Score: 1, very unfavorable, showing low efficiency in generating profit from equity.
- ROA Score: 5, very favorable, showing high effectiveness in asset utilization.
- Debt To Equity Score: 1, very unfavorable, indicating high financial risk due to debt levels.
- Overall Score: 2, moderate, reflecting an average financial standing.
VERI Rating
- Rating: C, considered very favorable.
- Discounted Cash Flow Score: 5, indicating a very favorable valuation based on future cash flows.
- ROE Score: 1, very unfavorable, showing low efficiency in generating profit from equity.
- ROA Score: 1, very unfavorable, showing poor asset utilization.
- Debt To Equity Score: 1, very unfavorable, indicating high financial risk due to debt levels.
- Overall Score: 2, moderate, reflecting an average financial standing.
Which one is the best rated?
Based on the provided data, VeriSign has a better overall rating (B- vs C) and stronger asset utilization (ROA 5 vs 1), while Veritone scores higher on discounted cash flow. Both have similar moderate overall scores and unfavorable debt-to-equity and ROE scores.
Scores Comparison
The comparison of VeriSign and Veritone scores provides insight into their financial health and bankruptcy risk:
VRSN Scores
- Altman Z-Score: -4.67, in distress zone, indicating high bankruptcy risk.
- Piotroski Score: 8, very strong financial strength and value investment potential.
VERI Scores
- Altman Z-Score: -0.07, also in distress zone, indicating financial distress.
- Piotroski Score: 3, very weak financial strength and low investment appeal.
Which company has the best scores?
Based on the data, VeriSign (VRSN) shows much stronger financial health with a very strong Piotroski score despite a distress Altman Z-Score, while Veritone (VERI) exhibits distress zone risk and very weak financial strength.
Grades Comparison
Here is the grades comparison for VeriSign, Inc. and Veritone, Inc.:
VeriSign, Inc. Grades
The table below summarizes recent grades assigned to VeriSign, Inc. by reputable grading companies.
| Grading Company | Action | New Grade | Date |
|---|---|---|---|
| JP Morgan | maintain | Neutral | 2026-01-06 |
| Baird | maintain | Outperform | 2025-07-01 |
| Baird | maintain | Outperform | 2025-04-25 |
| Baird | maintain | Outperform | 2025-04-01 |
| Citigroup | maintain | Buy | 2025-02-04 |
| Citigroup | maintain | Buy | 2025-01-03 |
| Baird | upgrade | Outperform | 2024-12-09 |
| Baird | maintain | Neutral | 2024-06-27 |
| Baird | maintain | Neutral | 2024-04-26 |
| Citigroup | maintain | Buy | 2024-04-02 |
Overall, VeriSign’s grades largely maintain a positive outlook with consistent Buy and Outperform ratings, reflecting relative confidence from major grading firms.
Veritone, Inc. Grades
The table below presents recent grades for Veritone, Inc. from recognized grading companies.
| Grading Company | Action | New Grade | Date |
|---|---|---|---|
| D. Boral Capital | maintain | Buy | 2025-12-09 |
| D. Boral Capital | maintain | Buy | 2025-12-04 |
| Needham | maintain | Buy | 2025-12-02 |
| D. Boral Capital | maintain | Buy | 2025-12-02 |
| D. Boral Capital | maintain | Buy | 2025-11-07 |
| D. Boral Capital | maintain | Buy | 2025-10-28 |
| HC Wainwright & Co. | maintain | Buy | 2025-10-20 |
| D. Boral Capital | maintain | Buy | 2025-10-15 |
| D. Boral Capital | maintain | Buy | 2025-09-24 |
| D. Boral Capital | maintain | Buy | 2025-09-09 |
Veritone maintains a consistent Buy rating from all grading companies, indicating steady optimism about its prospects.
Which company has the best grades?
VeriSign, Inc. and Veritone, Inc. both show a consensus Buy rating, but VeriSign’s grades include multiple Outperform ratings from Baird, reflecting a slightly stronger endorsement. This could imply a more favorable growth or stability outlook for VeriSign, potentially influencing investor confidence and portfolio allocation decisions.
Strengths and Weaknesses
The following table summarizes key strengths and weaknesses of VeriSign, Inc. (VRSN) and Veritone, Inc. (VERI) based on recent financial and strategic data.
| Criterion | VeriSign, Inc. (VRSN) | Veritone, Inc. (VERI) |
|---|---|---|
| Diversification | Focused primarily on domain name services with strong market dominance | More diversified with AI software, advertising, managed services |
| Profitability | Very high net margin (50.45%), strong ROIC (451%), positive value creation | Negative net margin (-40.36%), negative ROIC (-58.27%), value destructive |
| Innovation | Stable, focused innovation in network infrastructure and security | Innovation in AI platforms, but profitability and efficiency challenges |
| Global presence | Strong global presence in internet infrastructure | Growing but limited global footprint, mostly US-centric |
| Market Share | Dominant player in domain name registry market | Smaller market share in AI and media services, competitive sector |
Key takeaways: VeriSign demonstrates a durable competitive advantage with strong profitability and global leadership, making it a safer investment. Veritone faces significant profitability and efficiency challenges despite its diversification and innovation in AI, posing higher risks for investors.
Risk Analysis
Below is a comparative risk table for VeriSign, Inc. (VRSN) and Veritone, Inc. (VERI) based on the most recent 2024 data and key financial indicators:
| Metric | VeriSign, Inc. (VRSN) | Veritone, Inc. (VERI) |
|---|---|---|
| Market Risk | Moderate (Beta 0.77) | High (Beta 2.05) |
| Debt level | Low (Debt-to-Equity: -0.92, favorable) | High (Debt-to-Equity: 8.91, unfavorable) |
| Regulatory Risk | Moderate | Moderate |
| Operational Risk | Low (Strong infrastructure, stable revenue) | High (Early-stage AI, volatile earnings) |
| Environmental Risk | Low | Low |
| Geopolitical Risk | Moderate (US-based, global internet infrastructure) | Moderate (US & UK operations, AI sector sensitivity) |
The most significant and likely risks for VeriSign relate to leverage and liquidity concerns despite solid operational stability. Veritone faces higher market and operational risks due to its volatile financials, high debt, and nascent AI platform, which could impact investor confidence and valuation. Both companies remain exposed to regulatory and geopolitical uncertainties typical of technology firms.
Which Stock to Choose?
VeriSign, Inc. (VRSN) shows a generally favorable income evolution with 23.11% revenue growth over 2020-2024, strong profitability indicated by a 50.45% net margin, and a positive ROIC of 451% well above WACC. However, it carries significant debt levels and mixed liquidity ratios, reflected in a B- rating that is very favorable overall but with some concerns in ROE and debt-to-equity metrics.
Veritone, Inc. (VERI) presents a more volatile income profile with 60.53% revenue growth over the period but suffers from negative profitability metrics, including a -40.36% net margin and diminishing returns on invested capital. Its financial ratios are predominantly unfavorable, with a very unfavorable global score, high leverage, and liquidity challenges, although it holds a C rating classified as very favorable in some respects.
For investors, VRSN might appear more suitable for those prioritizing value creation and financial stability given its strong moat and favorable income statement, while VERI could be interpreted as more aligned with growth-focused profiles willing to accept higher risk amid operational challenges. The choice could depend on individual risk tolerance and investment strategy preferences.
Disclaimer: Investment carries a risk of loss of initial capital. The past performance is not a reliable indicator of future results. Be sure to understand risks before making an investment decision.
Go Further
I encourage you to read the complete analyses of VeriSign, Inc. and Veritone, Inc. to enhance your investment decisions: