Home > Comparison > Real Estate > WELL vs VTR
The strategic rivalry between Welltower Inc. and Ventas, Inc. shapes the healthcare real estate sector’s evolution. Welltower operates as a capital-intensive REIT focused on seniors housing and outpatient medical properties in major growth markets. Ventas, also a healthcare REIT, emphasizes a diversified portfolio and partnership-driven growth to manage cycles. This analysis aims to identify which firm offers a superior risk-adjusted return for a balanced portfolio amid demographic-driven demand.

Table of contents
Companies Overview
Welltower Inc. and Ventas, Inc. stand as prominent players in the healthcare real estate investment trust (REIT) sector.
Welltower Inc.: Healthcare Infrastructure Innovator
Welltower Inc. is a leading REIT focused on healthcare facilities with investments centered on seniors housing, post-acute communities, and outpatient medical properties. Its core revenue driver is partnering with top seniors housing operators and health systems to finance real estate supporting innovative care models. In 2026, Welltower emphasizes scaling transformative healthcare infrastructure in major North American and UK markets.
Ventas, Inc.: Diversified Healthcare Real Estate Leader
Ventas, Inc. operates as a diversified healthcare REIT, leveraging real estate capital to support a broad range of healthcare providers, developers, and research institutions. Its income stems from a high-quality portfolio of approximately 1,200 properties, aligned with demographic trends like aging populations. Ventas’ 2026 strategy focuses on steady cash flow growth through robust partnerships and strong balance sheet management.
Strategic Collision: Similarities & Divergences
Both firms excel in healthcare real estate but diverge on portfolio breadth and partnership models. Welltower prioritizes specialized seniors housing and outpatient facilities, while Ventas embraces a wider property mix including research and medical institutions. Their primary battleground lies in capturing growth within the aging population’s healthcare needs. Investors face distinct profiles: Welltower bets on transformative care infrastructure, Ventas on portfolio diversification and capital resilience.
Income Statement Comparison
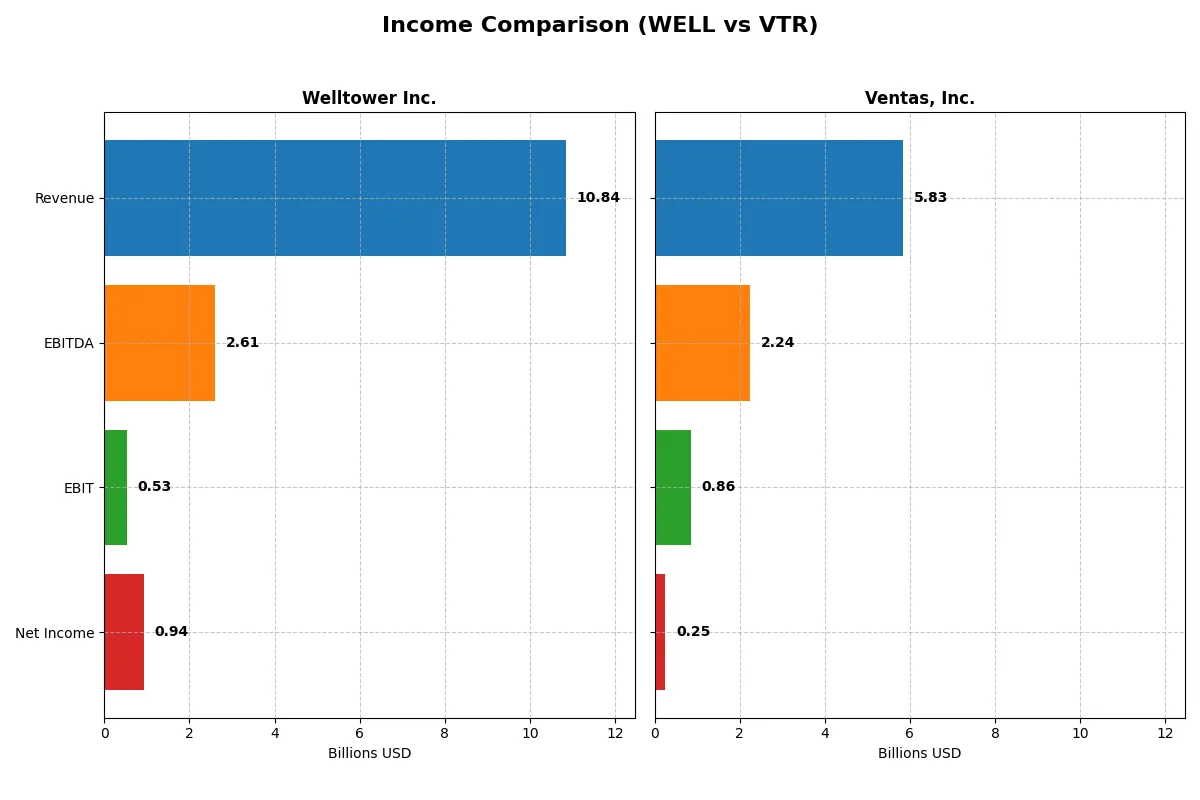
This data dissects the core profitability and scalability of Welltower Inc. and Ventas, Inc. to reveal who dominates the bottom line:
| Metric | Welltower Inc. (WELL) | Ventas, Inc. (VTR) |
|---|---|---|
| Revenue | 10.8B | 5.8B |
| Cost of Revenue | 8.6B | 6.2B |
| Operating Expenses | 6.5B | -1.2B |
| Gross Profit | 2.3B | -0.3B |
| EBITDA | 2.6B | 2.2B |
| EBIT | 526M | 860M |
| Interest Expense | 652M | 612M |
| Net Income | 937M | 251M |
| EPS | 1.41 | 0.55 |
| Fiscal Year | 2025 | 2025 |
Income Statement Analysis: The Bottom-Line Duel
This income statement comparison reveals the true efficiency and profitability of Welltower Inc. and Ventas, Inc. over recent years.
Welltower Inc. Analysis
Welltower’s revenue surged 38% in 2025, reaching $10.8B, supported by a 21% gross margin. Despite growing revenue, net income dipped slightly to $937M, reflecting margin pressure and rising expenses. The net margin remains solid at 8.6%, but EBIT contracted 52%, signaling operational challenges despite strong top-line momentum.
Ventas, Inc. Analysis
Ventas posted $5.8B revenue in 2025, up 18% year-over-year. However, it reported a negative gross margin of -5.9%, highlighting cost management struggles. EBIT expanded 32% to $860M, and net income rose sharply to $251M, lifting net margin to 4.3%. Ventas shows improving profitability amid operational volatility and significant margin recovery.
Margin Resilience vs. Growth Momentum
Welltower leads with higher revenue scale and a consistently positive gross margin, though it faces margin compression and slowing EBIT growth. Ventas exhibits stronger EBIT and net income growth percentages but struggles with cost control, reflected in negative gross margins. Investors seeking scale and steady margins may favor Welltower, while those prioritizing earnings momentum might consider Ventas’s improving profitability profile.
Financial Ratios Comparison
These vital ratios act as a diagnostic tool to expose the underlying fiscal health, valuation premiums, and capital efficiency of the companies compared below:
| Ratios | Welltower Inc. (WELL) | Ventas, Inc. (VTR) |
|---|---|---|
| ROE | 2.22% | 2.01% |
| ROIC | 4.37% | 21.48% |
| P/E | 131.88 | 140.08 |
| P/B | 2.93 | 2.81 |
| Current Ratio | 0 | 0.32 |
| Quick Ratio | 0 | 0.32 |
| D/E (Debt-to-Equity) | 0.07 | 1.08 |
| Debt-to-Assets | 4.18% | 49.06% |
| Interest Coverage | 0.81 | 1.35 |
| Asset Turnover | 0.16 | 0.21 |
| Fixed Asset Turnover | 5.02 | 11.57 |
| Payout ratio | 200.36% | 342.15% |
| Dividend yield | 1.52% | 2.44% |
| Fiscal Year | 2025 | 2025 |
Efficiency & Valuation Duel: The Vital Signs
Ratios act as a company’s DNA, uncovering hidden risks and operational strengths that shape investment decisions with clarity.
Welltower Inc.
Welltower posts a modest 2.22% ROE and a neutral 8.64% net margin, signaling limited profitability. Its valuation is stretched with a P/E of 132 and P/B of 2.93. The firm maintains a 1.52% dividend yield, balancing shareholder returns despite unfavorable liquidity and interest coverage metrics.
Ventas, Inc.
Ventas shows a similar low ROE of 2.01% and weaker 4.31% net margin, reflecting thin profit margins. The stock appears expensive with a P/E of 140 and a neutral P/B of 2.81. Dividend yield is stronger at 2.44%, but high debt levels and weak liquidity ratios raise caution on financial stability.
Premium Valuation vs. Operational Safety
Both companies trade at high multiples with limited profitability, yet Ventas carries heavier debt and weaker liquidity. Welltower offers slightly better financial health and stable dividends. Investors favoring cautious balance sheets might lean toward Welltower, while those prioritizing yield may consider Ventas’s payout profile.
Which one offers the Superior Shareholder Reward?
I compare Welltower Inc. (WELL) and Ventas, Inc. (VTR) on dividends, payout ratios, and buybacks. WELL yields 1.5% with a high payout ratio over 200%, signaling potential sustainability risk. VTR offers a 2.4% yield with a 342% payout ratio, implying overextension. WELL’s free cash flow fully covers dividends, while VTR’s coverage lags at 78%. WELL maintains modest buybacks; VTR’s buyback intensity is unclear but debt levels and leverage are higher, raising caution. WELL’s model appears more sustainable despite modest yield. I favor WELL for superior total shareholder reward in 2026 based on balanced distribution and buyback prudence.
Comparative Score Analysis: The Strategic Profile
The radar chart reveals the fundamental DNA and trade-offs of Welltower Inc. and Ventas, Inc., highlighting their financial strengths and vulnerabilities side by side:
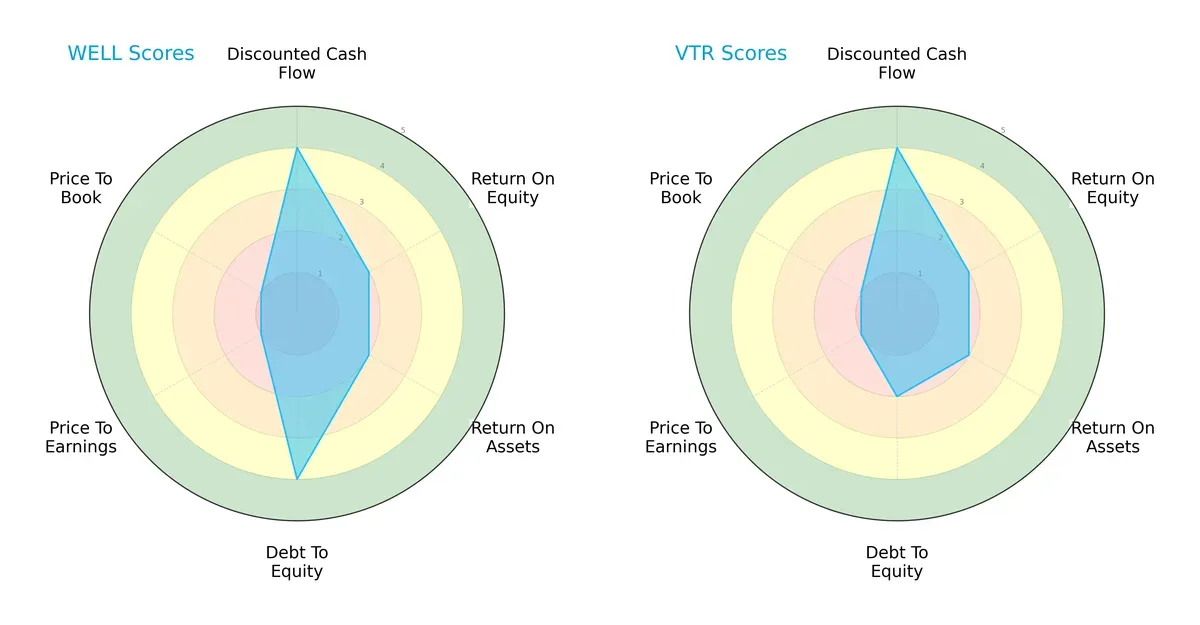
Welltower shows a more balanced profile with favorable scores in discounted cash flow and debt-to-equity, indicating disciplined capital structure management. Ventas matches DCF strength but carries higher leverage risk, reflected in its weaker debt-to-equity score. Both firms share challenges in returns and valuation metrics, but Welltower’s stronger balance sheet offers a strategic edge.
Bankruptcy Risk: Solvency Showdown
Welltower’s Altman Z-Score of 3.67 places it firmly in the safe zone, signaling solid long-term survival prospects. Ventas scores 1.48, deep in the distress zone, indicating heightened bankruptcy risk under current market pressures:

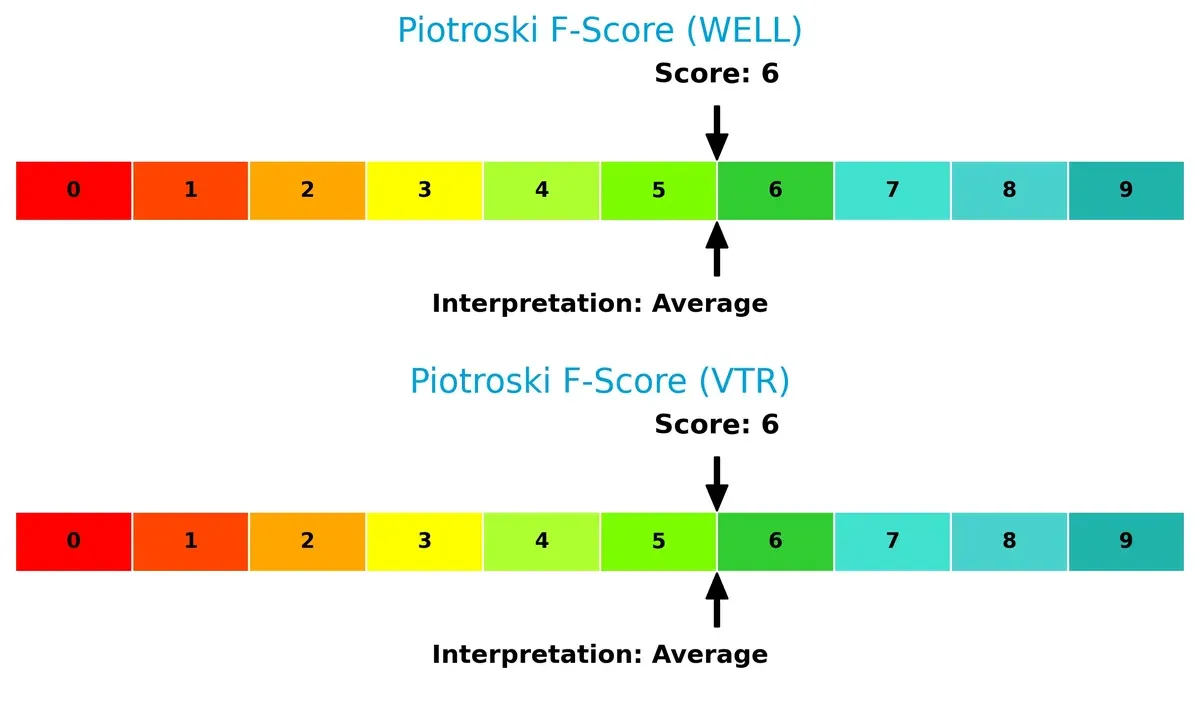
Financial Health: Quality of Operations
Both companies have a Piotroski F-Score of 6, indicating average financial health without immediate red flags. Neither firm excels in operational strength, but neither shows acute internal weaknesses relative to the other:
How are the two companies positioned?
This section dissects WELL’s and VTR’s operational DNA by comparing their revenue distribution and internal strengths and weaknesses. The goal is to confront their economic moats and identify which model offers the most resilient, sustainable advantage today.
Revenue Segmentation: The Strategic Mix
This visual comparison dissects how Welltower Inc. and Ventas, Inc. diversify their income streams and reveals where their primary sector bets lie:
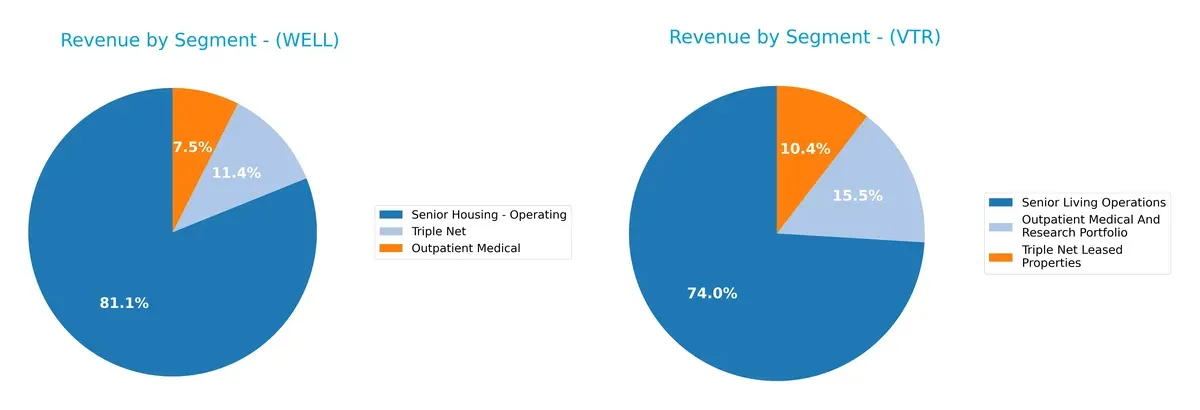
Welltower leans heavily on Senior Housing – Operating, generating $8.5B in 2025, dwarfing its Outpatient Medical ($780M) and Triple Net ($1.2B) segments. Ventas shows a more balanced mix: Senior Living Operations lead with $4.3B, but Outpatient Medical and Triple Net segments also contribute significantly at $900M and $600M respectively. Welltower’s reliance on one segment signals concentration risk, while Ventas pivots toward ecosystem lock-in through diversified healthcare real estate.
Strengths and Weaknesses Comparison
This table compares the strengths and weaknesses of Welltower Inc. and Ventas, Inc.:
Welltower Inc. Strengths
- Strong Senior Housing Operating revenue of 8.5B
- Favorable low debt-to-assets at 4.18%
- Favorable fixed asset turnover at 5.02
Ventas, Inc. Strengths
- High ROIC at 21.48% indicating efficient capital use
- Favorable fixed asset turnover at 11.57
- Higher dividend yield at 2.44%
Welltower Inc. Weaknesses
- Unfavorable ROE at 2.22% and net margin neutral at 8.64%
- Poor liquidity with zero current and quick ratios
- High P/E at 131.88 and weak interest coverage at 0.81
Ventas, Inc. Weaknesses
- Unfavorable net margin at 4.31% and ROE at 2.01%
- High debt-to-equity at 1.08 and weak interest coverage at 1.4
- Elevated P/E at 140.08 and low current ratio at 0.32
Welltower excels in low leverage and asset efficiency but struggles with liquidity and profitability. Ventas shows strong capital returns and dividends but faces higher leverage and weaker margins. These factors critically shape each company’s financial resilience and strategic options.
The Moat Duel: Analyzing Competitive Defensibility
A structural moat is the only defense preserving long-term profits from relentless competition erosion. Let’s dissect how these moats protect value:
Welltower Inc.: Strategic Market Penetration and Partner Ecosystem
Welltower’s moat lies in its expansive healthcare real estate footprint and partnerships with leading care providers. Despite a slightly unfavorable ROIC vs. WACC, improving profitability signals moat strengthening in 2026 through geographic expansion and innovative care models.
Ventas, Inc.: Capital Efficiency and Portfolio Diversification
Ventas boasts a robust moat driven by superior ROIC well above WACC and a diversified property portfolio. Its capital allocation outperforms Welltower’s, with accelerating profitability and growth prospects that reinforce its competitive positioning and resilience in 2026.
Capital Efficiency vs. Strategic Scale: Who Holds the Stronger Moat?
Ventas commands a deeper moat with a ROIC advantage of nearly 15%, signaling superior value creation and sustainable profitability. Welltower’s growing ROIC hints at potential, but Ventas remains better equipped to defend and expand market share in the evolving healthcare REIT sector.
Which stock offers better returns?
Welltower Inc. and Ventas, Inc. both exhibit strong price gains over the past year, with distinct trading dynamics and volume trends shaping their respective performances.
Trend Comparison
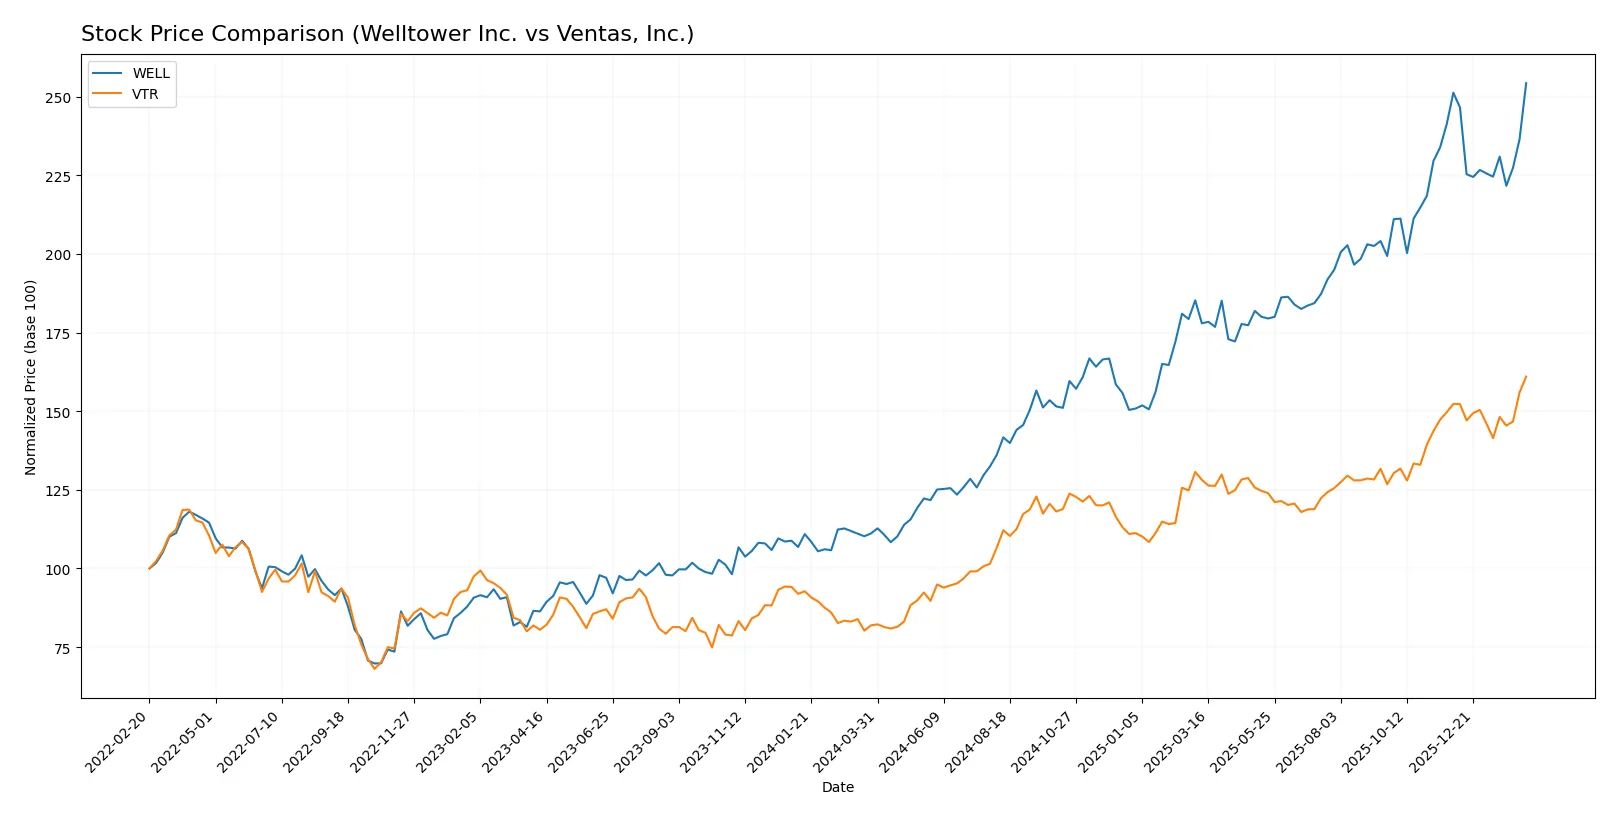
Welltower Inc. shows a bullish trend with a 128.84% price increase over 12 months, though momentum decelerates. The price ranged between 89.79 and 210.72, with high volatility (std dev 30.86).
Ventas, Inc. also posts a bullish trend with a 96.59% rise over the same period. Its acceleration slows, volatility is lower (std dev 9.69), and the price moved between 42.83 and 85.24.
Welltower outperforms Ventas in total return over 12 months, despite higher volatility and recent slight selling pressure compared to Ventas’ stable buyer dominance.
Target Prices
Analysts show a positive outlook with a clear consensus on target prices for Welltower Inc. and Ventas, Inc.
| Company | Target Low | Target High | Consensus |
|---|---|---|---|
| Welltower Inc. | 182 | 246 | 216.78 |
| Ventas, Inc. | 74 | 100 | 87.73 |
The consensus target for Welltower exceeds its current price of $210.72, signaling modest upside potential. Ventas’ target consensus of $87.73 also suggests slight appreciation from its current $85.24 market price.

Don’t Let Luck Decide Your Entry Point
Optimize your entry points with our advanced ProRealTime indicators. You’ll get efficient buy signals with precise price targets for maximum performance. Start outperforming now!
How do institutions grade them?
This section compares recent institutional grades for Welltower Inc. and Ventas, Inc.:
Welltower Inc. Grades
The following table summarizes Welltower Inc.’s recent institutional grades and actions:
| Grading Company | Action | New Grade | Date |
|---|---|---|---|
| Wells Fargo | Downgrade | Equal Weight | 2024-10-01 |
| Scotiabank | Maintain | Sector Outperform | 2024-09-23 |
| Evercore ISI Group | Maintain | In Line | 2024-09-16 |
| Evercore ISI Group | Maintain | In Line | 2024-08-28 |
| Deutsche Bank | Maintain | Buy | 2024-08-21 |
| RBC Capital | Maintain | Sector Perform | 2024-08-09 |
| Scotiabank | Maintain | Sector Outperform | 2024-08-07 |
| Wedbush | Maintain | Neutral | 2024-08-05 |
| Evercore ISI Group | Maintain | In Line | 2024-07-16 |
| Morgan Stanley | Maintain | Overweight | 2024-07-11 |
Ventas, Inc. Grades
Below is a summary of recent institutional grades for Ventas, Inc.:
| Grading Company | Action | New Grade | Date |
|---|---|---|---|
| Citigroup | Maintain | Buy | 2026-02-11 |
| RBC Capital | Maintain | Outperform | 2026-02-10 |
| Keybanc | Maintain | Overweight | 2026-02-10 |
| Cantor Fitzgerald | Maintain | Overweight | 2026-02-09 |
| Keybanc | Maintain | Overweight | 2025-12-04 |
| Wells Fargo | Maintain | Overweight | 2025-11-25 |
| Scotiabank | Maintain | Sector Perform | 2025-11-13 |
| Citigroup | Maintain | Buy | 2025-11-11 |
| Cantor Fitzgerald | Maintain | Overweight | 2025-10-31 |
| Wells Fargo | Maintain | Overweight | 2025-10-21 |
Which company has the best grades?
Ventas, Inc. consistently holds higher grades, mostly “Overweight,” “Buy,” and “Outperform.” Welltower Inc. shows mixed grades with some downgrades and more neutral stances. This suggests Ventas currently enjoys stronger institutional confidence, potentially influencing investor sentiment.
Risks specific to each company
The following categories identify the critical pressure points and systemic threats facing both firms in the 2026 market environment:
1. Market & Competition
Welltower Inc.
- Operates in high-growth markets with innovative care models but faces sector saturation risks.
Ventas, Inc.
- Maintains a diversified portfolio but competes intensely amid demographic shifts and evolving healthcare demands.
2. Capital Structure & Debt
Welltower Inc.
- Low debt-to-equity (0.07) and debt-to-assets (4.18%) indicate strong balance sheet and financial prudence.
Ventas, Inc.
- Higher leverage with debt-to-equity of 1.08 and debt-to-assets at 49.06%, raising financial risk concerns.
3. Stock Volatility
Welltower Inc.
- Beta of 0.832 suggests moderate volatility, less sensitive to market swings than peers.
Ventas, Inc.
- Slightly lower beta at 0.772 implies marginally more stable stock price movements in volatile markets.
4. Regulatory & Legal
Welltower Inc.
- Exposure to healthcare infrastructure regulations in US, Canada, UK with potential policy changes risk.
Ventas, Inc.
- Faces complex regulatory environment due to large portfolio and joint ventures, increasing compliance costs.
5. Supply Chain & Operations
Welltower Inc.
- Relies on partnerships with senior housing and post-acute providers; operational disruptions could impact returns.
Ventas, Inc.
- Large asset base and collaborations with healthcare providers expose it to operational inefficiencies and supply risks.
6. ESG & Climate Transition
Welltower Inc.
- Actively invests in wellness and sustainable infrastructure, aligning operations with climate goals.
Ventas, Inc.
- Efforts on ESG initiatives exist but scale and impact lag behind sector leaders, posing reputational risks.
7. Geopolitical Exposure
Welltower Inc.
- Geographic focus includes US, Canada, and UK; moderate exposure to geopolitical uncertainties in these regions.
Ventas, Inc.
- Concentrated in US market with some global partnerships, vulnerable to US policy shifts and international trade tensions.
Which company shows a better risk-adjusted profile?
Welltower’s strongest advantage lies in its conservative capital structure and higher Altman Z-score (3.67), signaling financial stability. Ventas bears significant leverage risk, reflected in its distress-zone Altman Z-score (1.48). Welltower’s moderate beta and favorable debt ratios give it a superior risk-adjusted profile amid 2026’s uncertain environment. The critical risk for Welltower is operational dependency on partner models, while Ventas faces pronounced financial strain from heavy debt. Recent balance sheet data confirms Ventas’ leverage as the prime concern limiting its resilience.
Final Verdict: Which stock to choose?
Welltower Inc. (WELL) excels as a resilient cash generator with a steadily improving profitability trend despite currently shedding value. Its low leverage and strong asset turnover distinguish it, but fragile liquidity remains a point of vigilance. WELL suits investors seeking aggressive growth with some tolerance for operational risks.
Ventas, Inc. (VTR) boasts a robust strategic moat, reflected in a high ROIC well above its cost of capital, signaling sustainable value creation. Its fixed asset efficiency and rising profitability provide a safety cushion versus WELL, though heavier debt levels add caution. VTR fits portfolios aiming for growth at a reasonable price with moderate risk appetite.
If you prioritize aggressive expansion and can accept short-term liquidity concerns, Welltower presents a compelling scenario due to its improving margins and operational efficiency. However, if you seek a more stable, value-creating investment with a durable competitive advantage, Ventas outshines by delivering consistent returns on invested capital despite higher leverage. Both demand careful risk management aligned with investor goals.
Disclaimer: Investment carries a risk of loss of initial capital. The past performance is not a reliable indicator of future results. Be sure to understand risks before making an investment decision.
Go Further
I encourage you to read the complete analyses of Welltower Inc. and Ventas, Inc. to enhance your investment decisions: