In the evolving uranium sector, NexGen Energy Ltd. (NXE) and Uranium Royalty Corp. (UROY) stand out with distinct yet overlapping approaches. NexGen focuses on exploration and development of uranium properties, while Uranium Royalty specializes in acquiring and managing uranium royalties across multiple projects. This comparison highlights their industry strategies and market positions. Join me as we analyze which company offers the most compelling investment opportunity in 2026.
Table of contents
Companies Overview
I will begin the comparison between NexGen Energy Ltd. and Uranium Royalty Corp. by providing an overview of these two companies and their main differences.
NexGen Energy Ltd. Overview
NexGen Energy Ltd. is an exploration and development stage company focused on uranium properties in Canada. Its principal asset is the Rook I project, a large mineral claim area in Saskatchewan’s Athabasca Basin. The company aims to advance its uranium resources through acquisition, exploration, evaluation, and development, positioning itself in the energy sector with a market cap of approximately 7B USD.
Uranium Royalty Corp. Overview
Uranium Royalty Corp. operates as a pure-play uranium royalty company, managing a geographically diversified portfolio of uranium interests. It holds royalty stakes in multiple projects across Canada, the U.S., and Namibia. Founded in 2017, the company focuses on acquiring and accumulating royalties rather than direct exploration, with a market cap near 535M USD, also headquartered in Vancouver.
Key similarities and differences
Both companies operate within the uranium industry and are headquartered in Vancouver, Canada, but they differ significantly in business models. NexGen Energy is engaged in direct exploration and development of uranium properties, while Uranium Royalty Corp. focuses on acquiring and managing royalty interests. NexGen has a larger workforce and market capitalization, reflecting its operational focus compared to Uranium Royalty’s asset management approach.
Income Statement Comparison
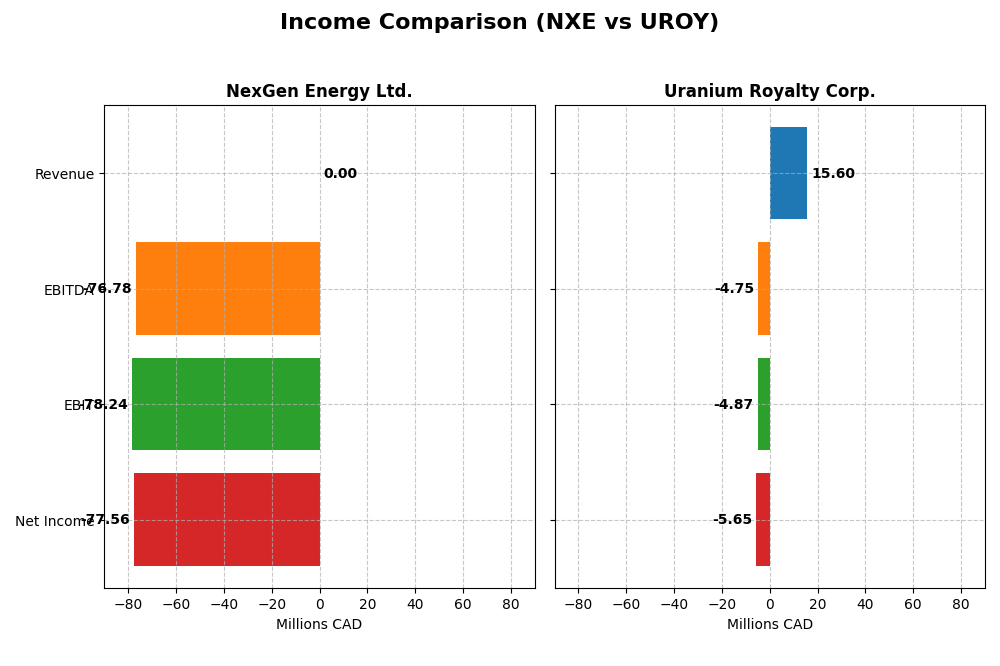
The table below presents a side-by-side comparison of key income statement metrics for NexGen Energy Ltd. and Uranium Royalty Corp. for their most recent fiscal years.
| Metric | NexGen Energy Ltd. | Uranium Royalty Corp. |
|---|---|---|
| Market Cap | 7.03B USD | 535M USD |
| Revenue | 0 CAD | 15.6M CAD |
| EBITDA | -76.8M CAD | -4.8M CAD |
| EBIT | -78.2M CAD | -4.9M CAD |
| Net Income | -77.6M CAD | -5.7M CAD |
| EPS | -0.14 CAD | -0.045 CAD |
| Fiscal Year | 2024 | 2025 |
Income Statement Interpretations
NexGen Energy Ltd.
NexGen Energy Ltd. showed no revenue from 2020 to 2024, with net income fluctuating from a -119M CAD loss in 2021 to an 81M CAD profit in 2023 before falling back to -78M CAD in 2024. Margins remained unfavorable, with zero gross and EBIT margins. The 2024 year exhibited a sharp EBIT decline and negative EPS, reflecting operational challenges despite stable interest expense.
Uranium Royalty Corp.
Uranium Royalty Corp. reported fluctuating revenues, peaking at 42.7M CAD in 2024 but dropping to 15.6M CAD in 2025, with net income moving from a 9.8M CAD profit in 2024 to a -5.7M CAD loss in 2025. Gross margins were neutral in 2025, but EBIT and net margins deteriorated. The company faced significant declines in profitability and EPS in the most recent year, indicating pressure on operational efficiency.
Which one has the stronger fundamentals?
Both companies present unfavorable global income statement evaluations with significant margin and profitability challenges. NexGen shows some net income growth over the period but no revenue. Uranium Royalty experiences declining revenue and net income with persistent losses. Neither company demonstrates consistently strong fundamentals, reflecting risk factors in their current financial profiles.
Financial Ratios Comparison
The table below presents a selection of key financial ratios for NexGen Energy Ltd. (NXE) and Uranium Royalty Corp. (UROY) based on their most recent fiscal year-end data, aiding in straightforward comparison.
| Ratios | NexGen Energy Ltd. (NXE) 2024 | Uranium Royalty Corp. (UROY) 2025 |
|---|---|---|
| ROE | -6.58% | -1.92% |
| ROIC | -4.39% | -1.63% |
| P/E | -67.80 | -56.00 |
| P/B | 4.46 | 1.07 |
| Current Ratio | 1.03 | 233.49 |
| Quick Ratio | 1.03 | 233.49 |
| D/E (Debt-to-Equity) | 0.39 | 0.00 |
| Debt-to-Assets | 27.56% | 0.07% |
| Interest Coverage | -2.33 | -11.02 |
| Asset Turnover | 0.00 | 0.05 |
| Fixed Asset Turnover | 0.00 | 82.51 |
| Payout Ratio | 0 | 0 |
| Dividend Yield | 0 | 0 |
Interpretation of the Ratios
NexGen Energy Ltd.
NexGen Energy shows predominantly unfavorable financial ratios, including negative returns on equity (-6.58%) and invested capital (-4.39%), and a weak interest coverage ratio (-2.4). The company’s leverage and liquidity ratios are generally favorable or neutral, with a debt-to-equity of 0.39 and current ratio at 1.03. NexGen does not pay dividends, reflecting its exploration and development stage focus and reinvestment strategy.
Uranium Royalty Corp.
Uranium Royalty exhibits mixed ratio performance with unfavorable net margin (-36.26%) and weak profitability metrics but some favorable leverage and valuation ratios, such as a low debt-to-assets ratio (0.07) and price-to-book of 1.07. Its quick ratio is very high at 233.49, indicating strong liquidity but possibly inefficient asset use. The company also does not pay dividends, consistent with a growth and investment priority profile.
Which one has the best ratios?
Both companies demonstrate unfavorable global ratio evaluations, but Uranium Royalty has a higher proportion of favorable ratios (42.86% vs. NexGen’s 28.57%). NexGen’s liquidity and leverage metrics are solid but offset by poor profitability and coverage ratios. Uranium Royalty’s strong asset turnover and conservative debt levels contrast with its negative profitability, making the ratio comparison nuanced.
Strategic Positioning
This section compares the strategic positioning of NexGen Energy Ltd. and Uranium Royalty Corp., focusing on Market position, Key segments, and exposure to disruption:
NexGen Energy Ltd.
- Exploration and development stage company in uranium with a principal asset in Canada; faces industry competition.
- Focused on uranium property acquisition and development in the Athabasca Basin, Saskatchewan.
- No explicit information on technological disruption exposure provided.
Uranium Royalty Corp.
- Pure-play uranium royalty company with geographically diversified interests across North America and Namibia.
- Manages a portfolio of royalty interests in multiple uranium projects across various regions.
- No explicit information on technological disruption exposure provided.
NexGen Energy Ltd. vs Uranium Royalty Corp. Positioning
NexGen has a concentrated strategy centered on one major uranium development project, offering focused exposure but higher project risk. Uranium Royalty Corp. follows a diversified royalty model across multiple geographies, potentially mitigating operational risks but with less direct control over assets.
Which has the best competitive advantage?
Both companies are currently shedding value with ROIC below WACC. NexGen shows a growing ROIC trend, indicating improving profitability, while Uranium Royalty Corp. experiences declining ROIC, suggesting deteriorating profitability and a weaker competitive position.
Stock Comparison
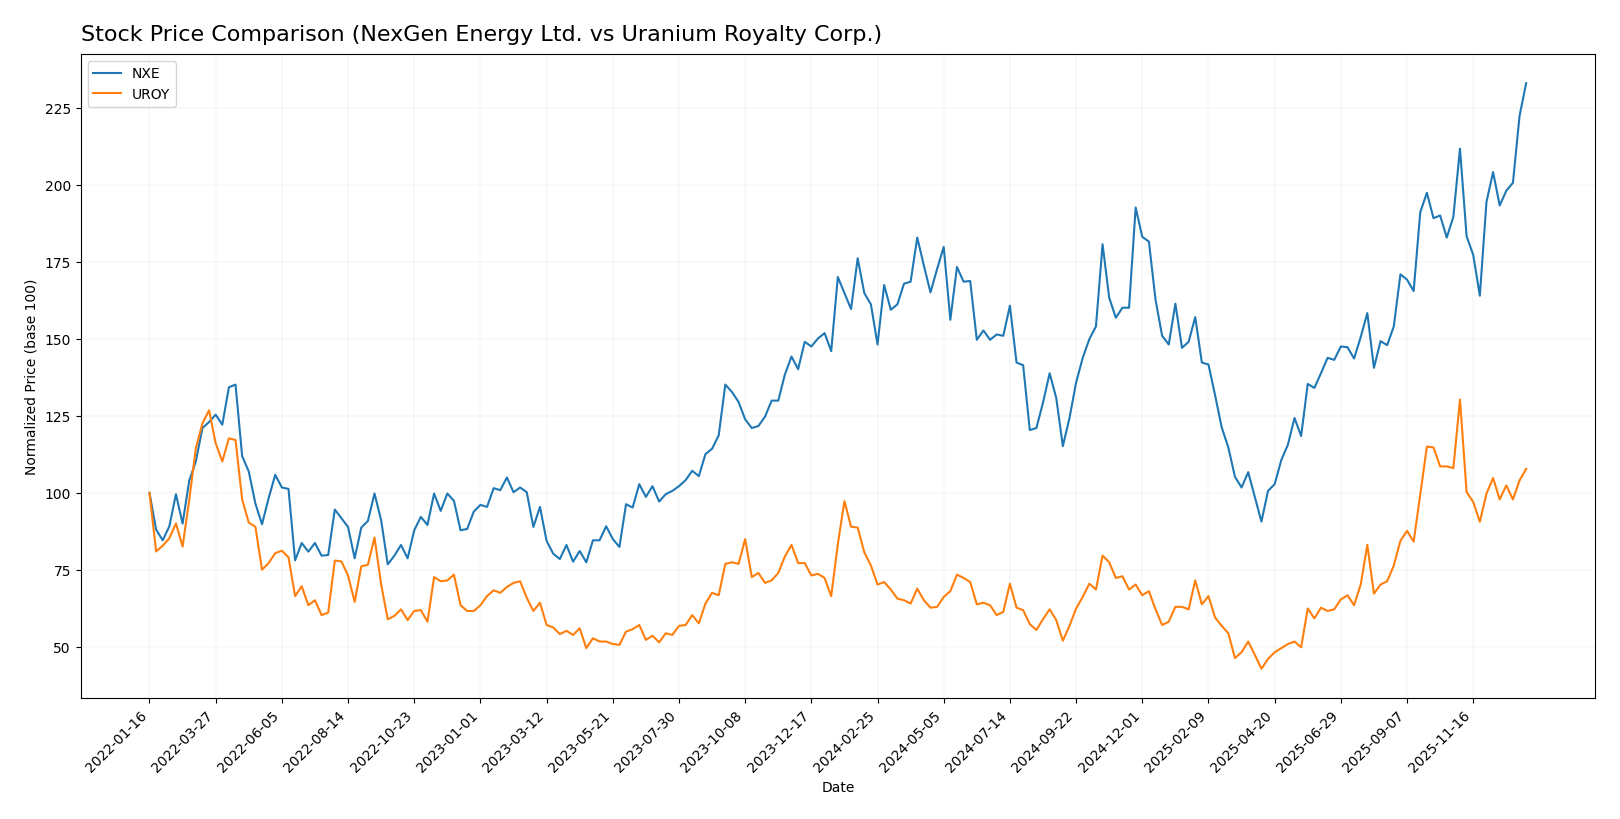
The stock prices of NexGen Energy Ltd. (NXE) and Uranium Royalty Corp. (UROY) have demonstrated significant bullish momentum over the past year, with notable divergences in recent quarterly performance and trading dynamics.
Trend Analysis
NexGen Energy Ltd. (NXE) recorded a strong bullish trend with a 44.55% price increase over the past 12 months, exhibiting acceleration and a price range from 4.18 to 10.74. Recent months show continued positive momentum with a 22.88% gain.
Uranium Royalty Corp. (UROY) also experienced a bullish trend over the year, up 41.05%, though showing deceleration. Price fluctuated between 1.6 and 4.86. Recently, the stock turned neutral, declining slightly by 0.25%.
Comparing both, NXE outperformed UROY overall with stronger gains and accelerating momentum, while UROY’s recent neutral trend indicates a pause in upward movement.
Target Prices
No verified target price data is available from recognized analysts for NexGen Energy Ltd. and Uranium Royalty Corp. Market sentiment remains mixed due to uranium sector volatility.
Analyst Opinions Comparison
This section compares analysts’ ratings and financial scores for NexGen Energy Ltd. and Uranium Royalty Corp.:
Rating Comparison
NexGen Energy Ltd. Rating
- Rating: D+ indicating a very favorable overall rating.
- Discounted Cash Flow Score: 2, moderate valuation based on future cash flows.
- ROE Score: 1, very unfavorable efficiency in generating profit from equity.
- ROA Score: 1, very unfavorable asset utilization.
- Debt To Equity Score: 1, very unfavorable financial risk due to high debt.
Uranium Royalty Corp. Rating
- Rating: C- indicating a very favorable overall rating.
- Discounted Cash Flow Score: 1, very unfavorable valuation perspective.
- ROE Score: 1, very unfavorable efficiency in generating profit from equity.
- ROA Score: 1, very unfavorable asset utilization.
- Debt To Equity Score: 4, favorable financial risk with low debt reliance.
Which one is the best rated?
Uranium Royalty Corp. has a better rating (C-) than NexGen Energy Ltd. (D+), mainly due to its favorable debt-to-equity score, while other scores are similarly very unfavorable for both companies.
Scores Comparison
Here is a comparison of the Altman Z-Score and Piotroski Score for NexGen Energy Ltd. and Uranium Royalty Corp.:
NXE Scores
- Altman Z-Score: 6.89, indicating a safe zone with low bankruptcy risk.
- Piotroski Score: 1, categorized as very weak financial strength.
UROY Scores
- Altman Z-Score: 388.37, indicating a safe zone with very low bankruptcy risk.
- Piotroski Score: 3, categorized as very weak financial strength.
Which company has the best scores?
Both NXE and UROY are in the safe zone for bankruptcy risk according to Altman Z-Scores, with UROY’s score significantly higher. However, both companies have very weak Piotroski Scores, with UROY slightly better at 3 compared to NXE’s 1.
Grades Comparison
Here is a comparison of available grades for NexGen Energy Ltd. and Uranium Royalty Corp.:
NexGen Energy Ltd. Grades
The following table summarizes the consensus grades for NexGen Energy Ltd.:
| Grading Company | Action | New Grade | Date |
|---|---|---|---|
| Consensus | Buy | Buy | N/A |
The consensus ratings for NexGen Energy Ltd. indicate a unanimous Buy recommendation from four analysts.
Uranium Royalty Corp. Grades
Below is a detailed summary of grades provided by HC Wainwright & Co. for Uranium Royalty Corp.:
| Grading Company | Action | New Grade | Date |
|---|---|---|---|
| HC Wainwright & Co. | Maintain | Buy | 2025-04-22 |
| HC Wainwright & Co. | Maintain | Buy | 2024-12-19 |
| HC Wainwright & Co. | Maintain | Buy | 2024-09-17 |
| HC Wainwright & Co. | Maintain | Buy | 2024-06-17 |
| HC Wainwright & Co. | Maintain | Buy | 2024-03-11 |
| HC Wainwright & Co. | Maintain | Buy | 2022-01-03 |
| HC Wainwright & Co. | Maintain | Buy | 2021-09-29 |
| HC Wainwright & Co. | Maintain | Buy | 2021-09-28 |
| HC Wainwright & Co. | Maintain | Buy | 2021-07-02 |
| HC Wainwright & Co. | Maintain | Buy | 2021-07-01 |
Uranium Royalty Corp. has consistently received a Buy rating from HC Wainwright & Co. across multiple dates, showing stable analyst confidence.
Which company has the best grades?
Both NexGen Energy Ltd. and Uranium Royalty Corp. have received Buy consensus ratings, but Uranium Royalty Corp. benefits from multiple repeated Buy ratings by a verified grading company, indicating strong and stable analyst support. This consistency might influence investor confidence differently compared to the fewer but unanimous Buy recommendations for NexGen.
Strengths and Weaknesses
Below is a comparison of NexGen Energy Ltd. (NXE) and Uranium Royalty Corp. (UROY) based on key financial and strategic criteria as of 2026.
| Criterion | NexGen Energy Ltd. (NXE) | Uranium Royalty Corp. (UROY) |
|---|---|---|
| Diversification | Limited product diversification; focused on uranium | Focused business model with uranium royalties, limited diversification |
| Profitability | Negative ROIC (-4.39%), shedding value but ROIC is improving | Negative ROIC (-1.63%), shedding value with declining profitability |
| Innovation | Moderate innovation in uranium extraction technology | Limited innovation, more focused on royalty business model |
| Global presence | Operates in key uranium mining regions, moderate global footprint | Primarily North America focused, limited global presence |
| Market Share | Niche player with potential growth in uranium market | Smaller market share, reliant on royalty income streams |
Key takeaways: Both companies are currently unprofitable and shedding value, with NXE showing signs of improving profitability and UROY experiencing declining profitability. NXE has a moderate global presence and innovation focus, while UROY relies on a royalty model with limited diversification and global reach. Investors should weigh the risk of current losses against potential growth in the uranium sector.
Risk Analysis
The table below compares key risk factors for NexGen Energy Ltd. (NXE) and Uranium Royalty Corp. (UROY) based on the most recent data from 2025-2026.
| Metric | NexGen Energy Ltd. (NXE) | Uranium Royalty Corp. (UROY) |
|---|---|---|
| Market Risk | High (Beta 1.856) | Very High (Beta 2.034) |
| Debt Level | Moderate (Debt/Equity 0.39) | Very Low (Debt/Equity 0.0) |
| Regulatory Risk | Moderate (Uranium sector regulation in Canada) | Moderate (Diverse global assets, including Namibia and US) |
| Operational Risk | High (Exploration and development stage) | Moderate (Royalty model reduces operational risk) |
| Environmental Risk | Moderate (Mining impact concerns) | Moderate (Exposure to multiple jurisdictions) |
| Geopolitical Risk | Moderate (Canada-focused assets) | High (Exposures in US, Namibia, and Canada) |
NexGen faces significant operational risk due to its exploration stage and high market volatility, with moderate debt adding financial pressure. Uranium Royalty Corp. benefits from very low debt and a diversified royalty portfolio, reducing operational risk but increasing geopolitical risk due to its global asset base. Market volatility and regulatory changes remain the most impactful risks for both.
Which Stock to Choose?
NexGen Energy Ltd. (NXE) shows stagnant income growth with largely unfavorable financial ratios, including negative returns on equity and invested capital, though it maintains a moderate debt level and a slightly unfavorable MOAT due to value destruction but improving profitability. Its overall rating is very favorable despite weak profitability metrics.
Uranium Royalty Corp. (UROY) exhibits declining income and profitability with mixed financial ratios—some favorable like low debt and fixed asset turnover, but overall unfavorable due to negative margins and declining ROIC. Its MOAT is very unfavorable with decreasing profitability, and it holds a very favorable rating amid financial challenges.
Investors focused on growth might see NXE’s improving profitability despite value destruction as a potential, while those prioritizing companies with lower debt and asset efficiency might consider UROY, though both face significant financial headwinds and unfavorable income trends.
Disclaimer: Investment carries a risk of loss of initial capital. The past performance is not a reliable indicator of future results. Be sure to understand risks before making an investment decision.
Go Further
I encourage you to read the complete analyses of NexGen Energy Ltd. and Uranium Royalty Corp. to enhance your investment decisions: