The uranium sector is garnering renewed investor interest as global energy demands shift toward cleaner alternatives. Uranium Energy Corp. (UEC) and Uranium Royalty Corp. (UROY) stand out as key players, each pursuing distinct strategies within this critical industry. While UEC focuses on uranium exploration and production, UROY specializes in royalty interests across diverse projects. This article will help you decide which company offers the most compelling investment opportunity in 2026.
Table of contents
Companies Overview
I will begin the comparison between Uranium Energy Corp. and Uranium Royalty Corp. by providing an overview of these two companies and their main differences.
Uranium Energy Corp. Overview
Uranium Energy Corp. focuses on exploration, pre-extraction, extraction, and processing of uranium and titanium concentrates primarily in the United States, Canada, and Paraguay. With operations spanning multiple mining projects including Palangana and Reno Creek, the company holds a significant position in the uranium industry. Based in Corpus Christi, Texas, it employs about 94 people and has a market capitalization of approximately 7.13B USD.
Uranium Royalty Corp. Overview
Uranium Royalty Corp. operates as a pure-play uranium royalty company, managing a portfolio of royalty interests in various uranium projects across Canada, the United States, and Namibia. The firm emphasizes acquiring and accumulating geographically diversified uranium interests rather than direct mining operations. Headquartered in Vancouver, Canada, it has 14 employees and a market cap near 535M USD.
Key similarities and differences
Both companies are active in the uranium industry and maintain diversified project portfolios in North America. However, Uranium Energy Corp. is engaged in the full uranium production cycle including mining and processing, while Uranium Royalty Corp. specializes solely in royalty ownership without direct extraction activities. Their operational scopes and employee counts also differ significantly, reflecting distinct business models within the energy sector.
Income Statement Comparison
The table below presents a side-by-side comparison of key income statement metrics for Uranium Energy Corp. and Uranium Royalty Corp. for their most recent fiscal year.
| Metric | Uranium Energy Corp. (UEC) | Uranium Royalty Corp. (UROY) |
|---|---|---|
| Market Cap | 7.13B USD | 535M CAD |
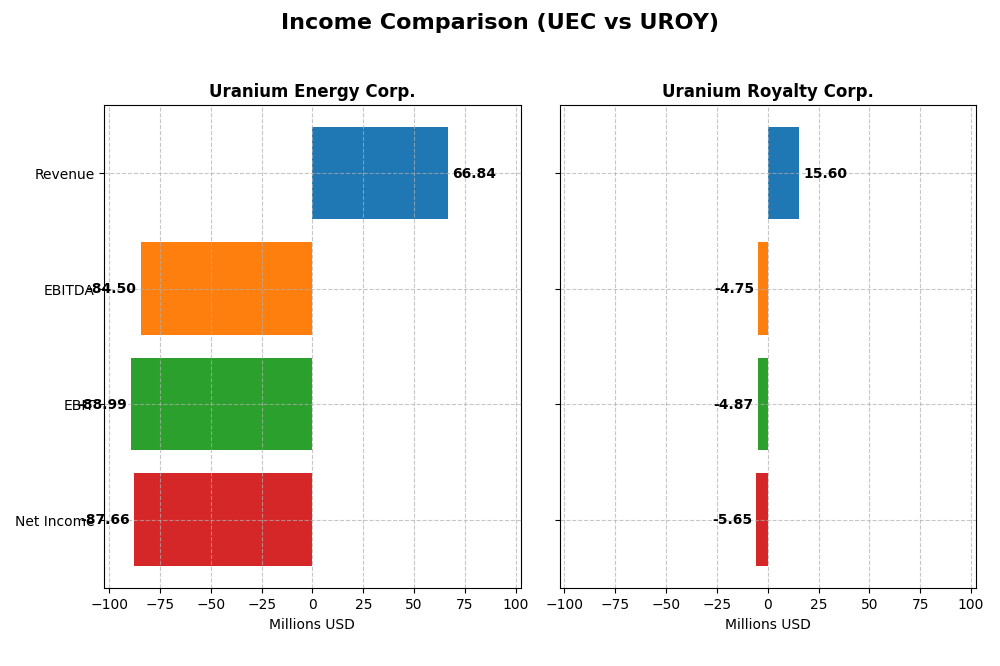
| Revenue | 66.8M USD | 15.6M CAD |
| EBITDA | -84.5M USD | -4.75M CAD |
| EBIT | -89.0M USD | -4.87M CAD |
| Net Income | -87.7M USD | -5.65M CAD |
| EPS | -0.20 USD | -0.0446 CAD |
| Fiscal Year | 2025 | 2025 |
Income Statement Interpretations
Uranium Energy Corp.
Uranium Energy Corp. experienced highly volatile revenue, peaking at $164M in 2023 before collapsing to $67M in 2025, with net income consistently negative, hitting -$88M in 2025. Gross margin remained favorable at 36.62%, but EBIT and net margins were deeply negative, reflecting operational challenges. The 2025 year showed massive revenue growth from 2024 but worsening EBIT loss and net margin.
Uranium Royalty Corp.
Uranium Royalty Corp. showed fluctuating revenue, with a peak of CAD 42.7M in 2024 but falling sharply to CAD 15.6M in 2025. Net income also swung from a positive CAD 9.8M in 2024 to a loss of CAD 5.7M in 2025. Margins were mostly unfavorable, with a low gross margin near 10% and negative EBIT and net margins. The latest year reflected revenue and margin declines impacting profitability.
Which one has the stronger fundamentals?
Both companies show unfavorable overall income statements with persistent losses and margin pressures. Uranium Energy Corp. has a stronger gross margin but suffers from wider EBIT and net losses, while Uranium Royalty Corp. posts lower margins and weaker revenue growth. Both present significant operational risks, with no clear fundamental advantage based on recent income trends.
Financial Ratios Comparison
The table below presents a side-by-side comparison of key financial ratios for Uranium Energy Corp. (UEC) and Uranium Royalty Corp. (UROY) based on their most recent fiscal year data.
| Ratios | Uranium Energy Corp. (UEC) FY 2025 | Uranium Royalty Corp. (UROY) FY 2025 |
|---|---|---|
| ROE | -8.91% | -1.92% |
| ROIC | -6.57% | -1.63% |
| P/E | -42.3 | -56.0 |
| P/B | 3.77 | 1.07 |
| Current Ratio | 8.85 | 233.49 |
| Quick Ratio | 5.85 | 233.49 |
| D/E (Debt-to-Equity) | 0.0023 | 0.0007 |
| Debt-to-Assets | 0.21% | 0.07% |
| Interest Coverage | -50.7 | -11.0 |
| Asset Turnover | 0.06 | 0.05 |
| Fixed Asset Turnover | 0.086 | 82.51 |
| Payout ratio | 0 | 0 |
| Dividend yield | 0% | 0% |
Interpretation of the Ratios
Uranium Energy Corp. (UEC)
UEC presents mostly unfavorable financial ratios, with a negative net margin of -131.15% and return on equity at -8.91%, signaling operational and profitability challenges. The company benefits from a favorable quick ratio and no debt, but high current ratio and low asset turnover raise efficiency concerns. UEC does not pay dividends, reflecting likely reinvestment in growth or operational constraints.
Uranium Royalty Corp. (UROY)
UROY shows a mixed ratio profile with a negative net margin of -36.26% and return on equity at -1.92%, indicating profitability issues but less severe than UEC. Favorable metrics include price-to-book ratio at 1.07 and strong fixed asset turnover of 82.51. Like UEC, UROY does not pay dividends, possibly prioritizing reinvestment or growth in its royalty-focused business model.
Which one has the best ratios?
Both companies have unfavorable overall ratio evaluations, but UROY holds a higher proportion of favorable ratios (42.86% vs. 28.57% for UEC), including better valuation and asset efficiency metrics. However, neither company shows strong profitability or dividend returns, reflecting ongoing operational and financial challenges in the uranium sector.
Strategic Positioning
This section compares the strategic positioning of Uranium Energy Corp. and Uranium Royalty Corp., focusing on market position, key segments, and exposure to technological disruption:
Uranium Energy Corp.
- Larger market cap of 7.13B with competitive pressure in uranium mining across US, Canada, Paraguay.
- Engages in exploration, extraction, and processing uranium and titanium concentrates in multiple countries.
- Traditional uranium mining and processing with no explicit mention of technological disruption exposure.
Uranium Royalty Corp.
- Smaller market cap of 535M, focused on uranium royalty interests globally.
- Pure-play uranium royalty company managing diversified royalty interests geographically.
- Royalties in multiple projects, likely less operational risk but no specific technological disruption noted.
Uranium Energy Corp. vs Uranium Royalty Corp. Positioning
Uranium Energy Corp. has a diversified operational approach with direct mining and processing activities, offering broader business drivers but higher operational complexity. Uranium Royalty Corp. focuses on royalty income, concentrating on portfolio management with lower direct operational involvement but possibly less growth drivers.
Which has the best competitive advantage?
Based on MOAT evaluation, both companies are shedding value. Uranium Energy Corp. shows slightly unfavorable positioning with improving profitability, while Uranium Royalty Corp. faces very unfavorable conditions with declining profitability, indicating a weaker competitive advantage.
Stock Comparison
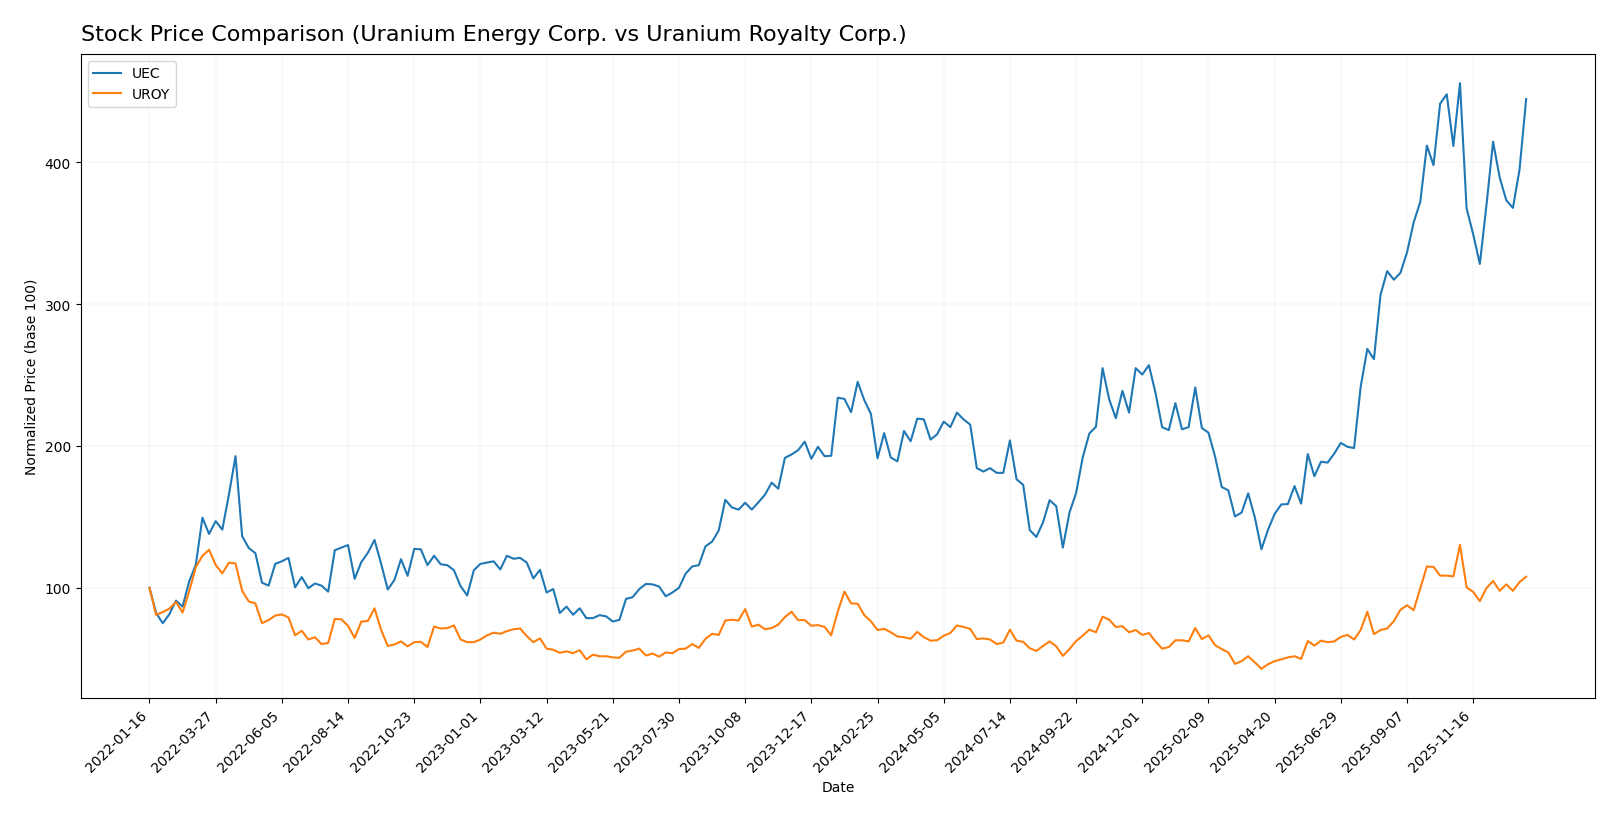
The past year shows significant bullish trends in Uranium Energy Corp. (UEC) and Uranium Royalty Corp. (UROY), with UEC nearly doubling and UROY gaining over 40%, both experiencing deceleration in momentum.
Trend Analysis
Uranium Energy Corp. (UEC) recorded a 99.73% price increase over the past 12 months, signaling a strong bullish trend with deceleration. The stock ranged from 4.22 to 15.13, showing moderate volatility (std deviation 2.82).
Uranium Royalty Corp. (UROY) showed a 41.05% price increase during the same period, also bullish with decelerating momentum. Its price fluctuated between 1.6 and 4.86, with lower volatility (std deviation 0.67).
Comparing the two, UEC outperformed UROY with a higher overall price gain, despite both stocks exhibiting decelerating bullish trends over the past year.
Target Prices
The consensus target prices for Uranium Energy Corp. indicate moderate upside potential relative to the current stock price.
| Company | Target High | Target Low | Consensus |
|---|---|---|---|
| Uranium Energy Corp. | 19.75 | 14.00 | 17.08 |
Analysts expect Uranium Energy Corp.’s shares to trade modestly higher, with a consensus target of 17.08 versus the current price of 14.76 USD. No verified target price data is available from recognized analysts for Uranium Royalty Corp.
Analyst Opinions Comparison
This section compares analysts’ ratings and grades for Uranium Energy Corp. and Uranium Royalty Corp.:
Rating Comparison
UEC Rating
- Rating: D+, classified as Very Favorable by analysts.
- Discounted Cash Flow Score: 1, indicating a Very Unfavorable valuation.
- ROE Score: 1, showing Very Unfavorable efficiency in generating profit.
- ROA Score: 1, reflecting Very Unfavorable asset utilization.
- Debt To Equity Score: 1, indicating Very Unfavorable financial risk.
- Overall Score: 1, considered Very Unfavorable overall financial standing.
UROY Rating
- Rating: C-, classified as Very Favorable by analysts.
- Discounted Cash Flow Score: 1, indicating a Very Unfavorable valuation.
- ROE Score: 1, showing Very Unfavorable efficiency in generating profit.
- ROA Score: 1, reflecting Very Unfavorable asset utilization.
- Debt To Equity Score: 4, indicating a Favorable financial risk profile.
- Overall Score: 1, considered Very Unfavorable overall financial standing.
Which one is the best rated?
UROY holds a better analyst rating at C- compared to UEC’s D+, although both have equally low overall, DCF, ROE, and ROA scores of 1. UROY’s stronger debt-to-equity score of 4 offers a relatively more favorable financial risk profile.
Scores Comparison
Here is a comparison of the Altman Z-Score and Piotroski Score for the two companies:
UEC Scores
- Altman Z-Score: 30.44, indicating a safe zone status.
- Piotroski Score: 2, considered very weak financial health.
UROY Scores
- Altman Z-Score: 388.37, indicating a safe zone status.
- Piotroski Score: 3, considered very weak financial health.
Which company has the best scores?
Both companies are in the safe zone according to their Altman Z-Scores, but UROY’s score is significantly higher. For the Piotroski Score, both have very weak ratings, with UROY slightly ahead at 3 versus UEC’s 2.
Grades Comparison
The grades comparison for Uranium Energy Corp. and Uranium Royalty Corp. is as follows:
Uranium Energy Corp. Grades
The table below shows recent grades from recognized financial institutions for Uranium Energy Corp.
| Grading Company | Action | New Grade | Date |
|---|---|---|---|
| Roth Capital | Maintain | Buy | 2025-12-11 |
| Goldman Sachs | Maintain | Buy | 2025-09-26 |
| Roth Capital | Maintain | Buy | 2025-09-25 |
| HC Wainwright & Co. | Maintain | Buy | 2025-09-25 |
| BMO Capital | Downgrade | Market Perform | 2025-09-25 |
| Roth Capital | Maintain | Buy | 2025-09-03 |
| HC Wainwright & Co. | Maintain | Buy | 2025-08-06 |
| HC Wainwright & Co. | Maintain | Buy | 2025-03-13 |
| HC Wainwright & Co. | Maintain | Buy | 2024-12-09 |
| Roth MKM | Maintain | Buy | 2024-10-23 |
Uranium Energy Corp. maintains a predominantly “Buy” consensus, with a single recent downgrade to “Market Perform” by BMO Capital.
Uranium Royalty Corp. Grades
The following table presents recent grades from a leading grading company for Uranium Royalty Corp.
| Grading Company | Action | New Grade | Date |
|---|---|---|---|
| HC Wainwright & Co. | Maintain | Buy | 2025-04-22 |
| HC Wainwright & Co. | Maintain | Buy | 2024-12-19 |
| HC Wainwright & Co. | Maintain | Buy | 2024-09-17 |
| HC Wainwright & Co. | Maintain | Buy | 2024-06-17 |
| HC Wainwright & Co. | Maintain | Buy | 2024-03-11 |
| HC Wainwright & Co. | Maintain | Buy | 2022-01-03 |
| HC Wainwright & Co. | Maintain | Buy | 2021-09-29 |
| HC Wainwright & Co. | Maintain | Buy | 2021-09-28 |
| HC Wainwright & Co. | Maintain | Buy | 2021-07-02 |
| HC Wainwright & Co. | Maintain | Buy | 2021-07-01 |
Uranium Royalty Corp. consistently holds a “Buy” rating from HC Wainwright & Co. over multiple years without any downgrades.
Which company has the best grades?
Both companies have a “Buy” consensus, but Uranium Energy Corp. has a broader range of grading sources and a recent slight downgrade, while Uranium Royalty Corp. shows a steady, uninterrupted “Buy” trend from one major grader. This may influence investors’ perception of stability and analyst confidence.
Strengths and Weaknesses
The table below summarizes the key strengths and weaknesses of Uranium Energy Corp. (UEC) and Uranium Royalty Corp. (UROY) based on recent financial and operational data.
| Criterion | Uranium Energy Corp. (UEC) | Uranium Royalty Corp. (UROY) |
|---|---|---|
| Diversification | Limited product range, mainly uranium inventory sales | Focused on royalties, less operational risk but limited diversification |
| Profitability | Negative net margin (-131.15%), ROIC -6.57%, shedding value but improving ROIC trend | Negative net margin (-36.26%), ROIC -1.63%, shedding value with declining ROIC |
| Innovation | Moderate, as reflected by fluctuating asset turnover (0.06) | Higher fixed asset turnover (82.51) indicating operational efficiency |
| Global presence | Moderate, with sales primarily in the US market | More diversified through global royalty streams but limited data on direct sales |
| Market Share | Relatively small, with inventory sales of $66.8M in 2025 | Royalty-based model limits direct market share but offers steady income potential |
Key takeaways: Both companies currently face profitability challenges and are shedding value. UEC shows signs of improving operational efficiency, while UROY benefits from a royalty model with better asset turnover but declining profitability. Investors should weigh growth potential against ongoing financial weaknesses.
Risk Analysis
Below is a comparative risk table for Uranium Energy Corp. (UEC) and Uranium Royalty Corp. (UROY) based on the most recent 2025 data:
| Metric | Uranium Energy Corp. (UEC) | Uranium Royalty Corp. (UROY) |
|---|---|---|
| Market Risk | Beta 1.24; moderate volatility | Beta 2.03; high volatility |
| Debt level | Very low debt (D/E = 0.0); favorable | Very low debt (D/E = 0.0); favorable |
| Regulatory Risk | US & Canada uranium mining regulations; moderate | Canadian & US regulations plus international royalties; moderate |
| Operational Risk | Owns multiple projects; higher operational complexity | Pure-play royalty model; lower operational risk |
| Environmental Risk | Uranium mining impact; ongoing compliance needed | Exposure to environmental risk via royalties; less direct impact |
| Geopolitical Risk | US, Canada, Paraguay operations; moderate | Diversified geography including Namibia; higher geopolitical exposure |
The most impactful risks are market volatility, especially for UROY with its higher beta, and operational risks for UEC due to its active mining projects. Both companies maintain very low debt levels, reducing financial risk. Regulatory and environmental compliance remain vital given uranium’s sensitive nature. Geopolitical risk is more pronounced for UROY due to its wider geographic exposure. Investors should weigh these factors carefully for risk management.
Which Stock to Choose?
Uranium Energy Corp. (UEC) shows a volatile income evolution with a recent strong revenue growth of 29,738%, but overall negative profitability indicators including a -131.15% net margin and unfavorable financial ratios. Its debt levels are low, and it holds a very favorable rating of D+ despite weak profitability and some favorable liquidity measures.
Uranium Royalty Corp. (UROY) experiences a declining income trend with a -63.48% revenue change and mostly unfavorable profitability ratios, including a -36.26% net margin. It carries minimal debt and a very favorable rating of C-, supported by some favorable financial ratios but challenged by a declining ROIC and weaker income growth.
Considering ratings and overall financial evaluations, UEC’s growing ROIC but value destruction contrasts with UROY’s more stable but declining profitability. Risk-tolerant investors focused on growth might find UEC’s improving income statement appealing, while more conservative profiles could see UROY’s steadier financial structure as preferable despite its challenges.
Disclaimer: Investment carries a risk of loss of initial capital. The past performance is not a reliable indicator of future results. Be sure to understand risks before making an investment decision.
Go Further
I encourage you to read the complete analyses of Uranium Energy Corp. and Uranium Royalty Corp. to enhance your investment decisions: