In the evolving uranium sector, Uranium Energy Corp. (UEC) and Ur-Energy Inc. (URG) stand out as key players with overlapping markets and innovative approaches to uranium exploration and production. Both companies operate primarily in the United States, focusing on expanding their resource bases and improving extraction technologies. This article will closely examine their strategies and fundamentals to help you decide which uranium stock deserves a place in your investment portfolio.
Table of contents
Companies Overview
I will begin the comparison between Uranium Energy Corp. and Ur-Energy Inc. by providing an overview of these two companies and their main differences.
Uranium Energy Corp. Overview
Uranium Energy Corp. operates in the uranium industry, focusing on exploration, pre-extraction, extraction, and processing of uranium and titanium concentrates across the US, Canada, and Paraguay. The company owns multiple projects in Texas, Arizona, Colorado, Wyoming, Canada, and Paraguay. Founded in 2003 and based in Corpus Christi, Texas, it positions itself as a diversified uranium producer with a market cap of approximately 7.13B USD.
Ur-Energy Inc. Overview
Ur-Energy Inc. is engaged in the acquisition, exploration, development, and operation of uranium mineral properties solely within the United States. Its flagship project, Lost Creek, is located in Wyoming and encompasses about 48,000 acres. Incorporated in 2004 and headquartered in Littleton, Colorado, Ur-Energy has a market capitalization near 598M USD and emphasizes focused uranium mining and development.
Key similarities and differences
Both companies operate in the uranium energy sector and are listed on the AMEX exchange, with comparable operational focuses on uranium mining and development. Uranium Energy Corp. has a broader geographic footprint, including international projects and titanium operations, contrasting with Ur-Energy’s exclusive focus on US uranium properties. Market capitalization and scale also differ significantly, with Uranium Energy Corp. being substantially larger.
Income Statement Comparison
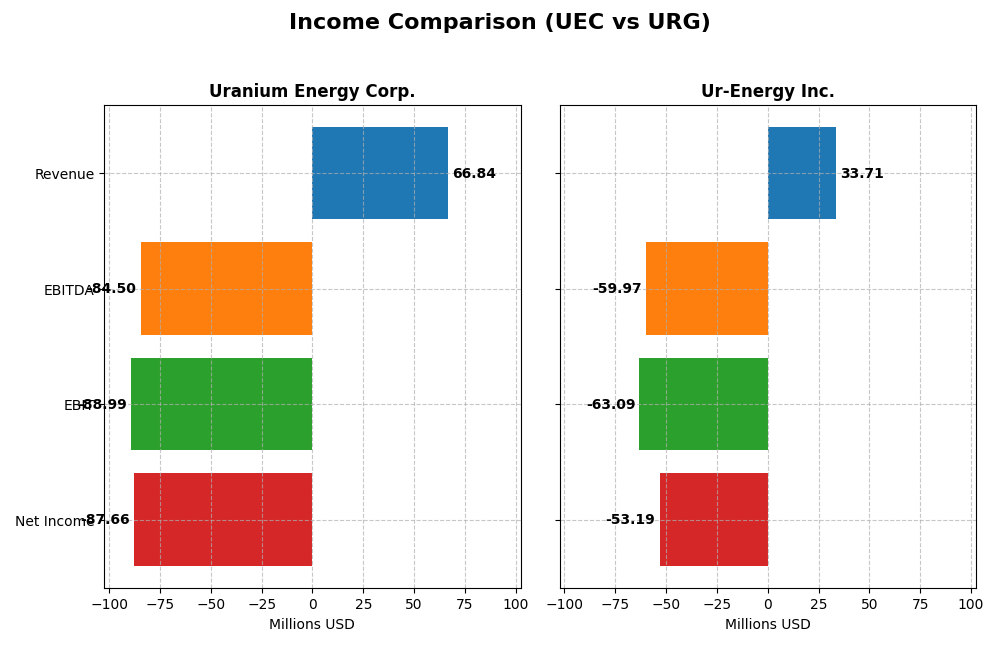
This table compares the key income statement metrics for Uranium Energy Corp. and Ur-Energy Inc. for their most recent fiscal years, highlighting their financial performance side by side.
| Metric | Uranium Energy Corp. (UEC) | Ur-Energy Inc. (URG) |
|---|---|---|
| Market Cap | 7.13B | 598M |
| Revenue | 66.8M | 33.7M |
| EBITDA | -84.5M | -60.0M |
| EBIT | -88.9M | -63.1M |
| Net Income | -87.7M | -53.2M |
| EPS | -0.20 | -0.17 |
| Fiscal Year | 2025 | 2024 |
Income Statement Interpretations
Uranium Energy Corp.
Uranium Energy Corp. displayed volatile revenue and net income from 2021 to 2025, with a sharp revenue jump in 2025 to $66.8M but a net loss of -$87.7M. Gross margin remained favorable at 36.62%, yet EBIT and net margins were deeply negative, indicating operational challenges. The recent year showed strong revenue growth but worsening EBIT and EPS, reflecting pressure on profitability.
Ur-Energy Inc.
Ur-Energy Inc. saw revenue rise steadily from $16K in 2020 to $33.7M in 2024, yet net income remained negative, totaling -$53.2M in 2024. Gross margins stayed unfavorable, reflecting high cost structure, while net margin was deeply negative at -157.8%. Despite revenue growth and slight net margin improvement recently, earnings and EBIT deteriorated, signaling persistent profitability issues.
Which one has the stronger fundamentals?
Both companies exhibit unfavorable overall income statement evaluations, with negative EBIT and net margins. Uranium Energy shows better gross margin and more pronounced revenue surge recently but deeper net losses and margin contraction. Ur-Energy has consistent revenue growth over time but suffers from persistent negative margins and losses. Fundamentally, both face profitability challenges without a clear advantage.
Financial Ratios Comparison
The table below presents a side-by-side comparison of key financial ratios for Uranium Energy Corp. (UEC) and Ur-Energy Inc. (URG) based on their most recent fiscal year data.
| Ratios | Uranium Energy Corp. (UEC) FY 2025 | Ur-Energy Inc. (URG) FY 2024 |
|---|---|---|
| ROE | -8.9% | -40.1% |
| ROIC | -6.6% | -36.0% |
| P/E | -42.3 | -6.9 |
| P/B | 3.77 | 2.75 |
| Current Ratio | 8.85 | 5.99 |
| Quick Ratio | 5.85 | 4.91 |
| D/E (Debt to Equity) | 0.0023 | 0.0093 |
| Debt-to-Assets | 0.21% | 0.64% |
| Interest Coverage | -50.7 | 0 |
| Asset Turnover | 0.060 | 0.174 |
| Fixed Asset Turnover | 0.086 | 0 |
| Payout Ratio | 0 | 0 |
| Dividend Yield | 0% | 0% |
Interpretation of the Ratios
Uranium Energy Corp.
Uranium Energy Corp. shows mostly unfavorable ratios, including a negative net margin of -131.15% and return on equity at -8.91%, signaling operational challenges and weak profitability. The company’s high current ratio of 8.85 is marked unfavorable, while the quick ratio of 5.85 is favorable, indicating liquidity management issues. It does not pay dividends, likely due to negative earnings and reinvestment focus.
Ur-Energy Inc.
Ur-Energy Inc. also presents predominantly unfavorable ratios, with a net margin of -157.8% and a heavily negative return on equity of -40.05%, reflecting poor profitability and returns. Despite a solid quick ratio of 4.91, its current ratio of 5.99 is unfavorable. The firm does not distribute dividends, probably prioritizing reinvestment and development given its unprofitable status.
Which one has the best ratios?
Both companies face significant profitability and efficiency challenges, reflected in negative margins and returns. While each has some favorable liquidity and leverage metrics, neither demonstrates strong overall financial health. Uranium Energy Corp. and Ur-Energy Inc. share an unfavorable global ratios opinion, with Ur-Energy slightly better on debt metrics but worse on profitability and asset turnover.
Strategic Positioning
This section compares the strategic positioning of Uranium Energy Corp. and Ur-Energy Inc. in terms of market position, key segments, and exposure to technological disruption:
Uranium Energy Corp.
- Larger market cap of 7.13B with diversified projects across US, Canada, Paraguay; moderate competitive pressure.
- Key segments include uranium and titanium exploration, extraction, processing with multiple mining properties across North America and Paraguay.
- No explicit data on technological disruption exposure; operations across multiple regions may imply varied technological adaptation needs.
Ur-Energy Inc.
- Smaller market cap of 598M focused on 12 US uranium projects, mainly Wyoming; faces competitive pressure in a niche market.
- Concentrated on uranium acquisition, exploration, development, and operation, with flagship Lost Creek project in Wyoming.
- No explicit data on technological disruption exposure; operations focused in US with potential reliance on existing mining technologies.
Uranium Energy Corp. vs Ur-Energy Inc. Positioning
Uranium Energy Corp. adopts a diversified geographic and product approach with uranium and titanium, providing multiple revenue streams. Ur-Energy Inc. maintains a more concentrated focus on uranium mining in the US, particularly Wyoming, which may limit diversification but concentrates operational expertise.
Which has the best competitive advantage?
Based on MOAT evaluations, both companies are currently shedding value. Uranium Energy Corp. shows a slightly unfavorable trend with growing ROIC, whereas Ur-Energy Inc. faces a very unfavorable trend with declining profitability, indicating Uranium Energy Corp. holds a relatively stronger competitive position.
Stock Comparison
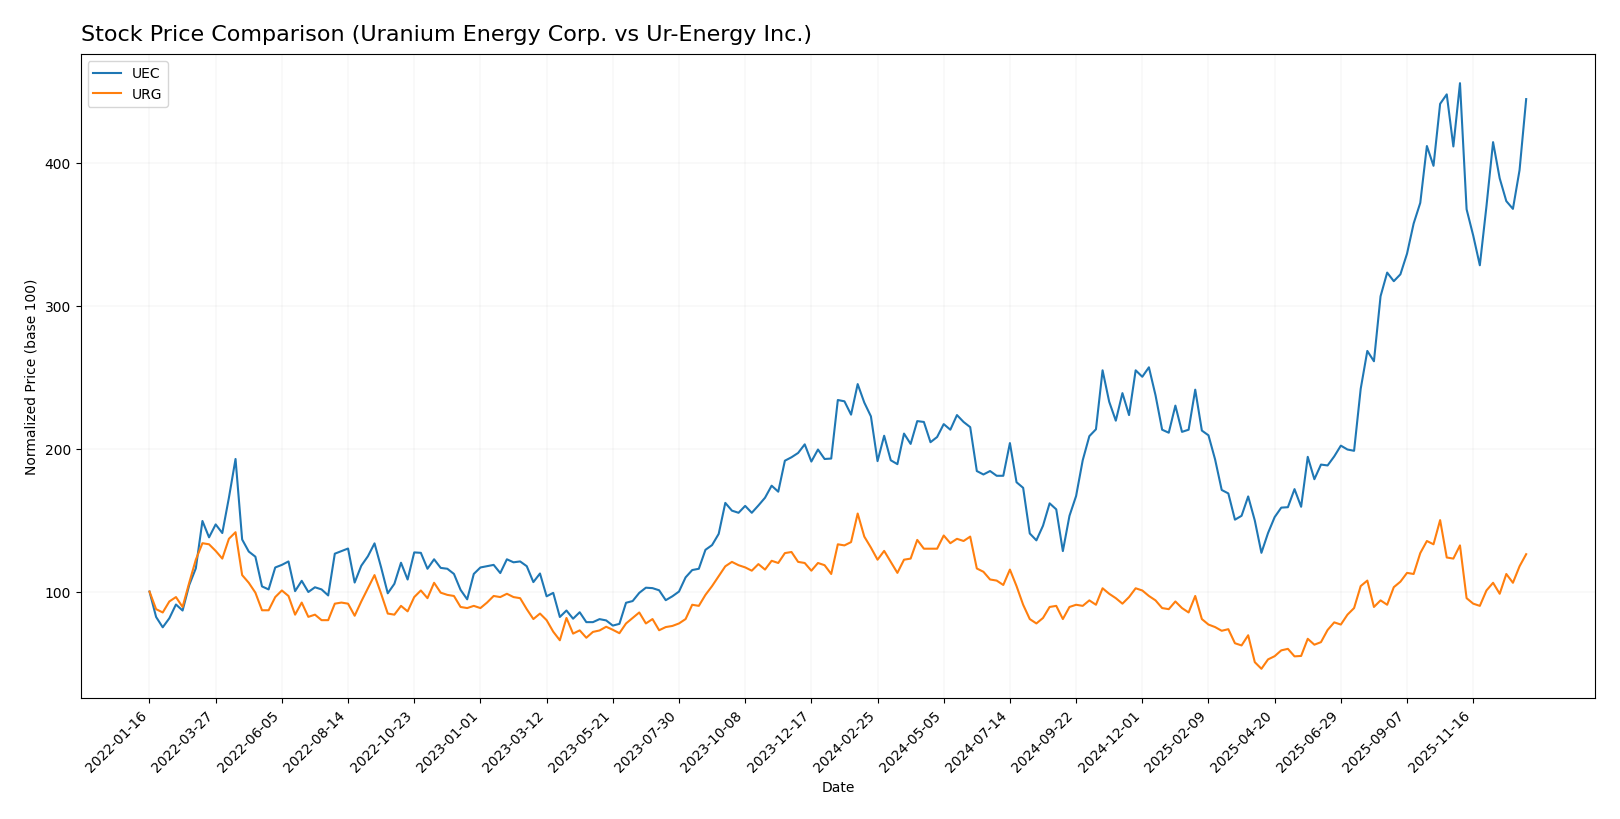
The stock price movements over the past year reveal contrasting dynamics between Uranium Energy Corp. and Ur-Energy Inc., highlighting a strong bullish trend for UEC and a bearish trend for URG amid evolving trading volumes and price shifts.
Trend Analysis
Uranium Energy Corp. (UEC) exhibited a pronounced bullish trend over the past 12 months with a 99.73% price increase, albeit with deceleration; its price ranged from a low of 4.22 to a high of 15.13 and showed moderate volatility (std dev 2.82).
Ur-Energy Inc. (URG) experienced a bearish trend with a 3.53% price decline over the same period, despite accelerating momentum; price fluctuated between 0.6 and 1.95, reflecting low volatility (std dev 0.31).
Comparatively, UEC delivered the highest market performance with a nearly 100% gain, significantly outperforming URG’s modest decline over the past year.
Target Prices
The current analyst consensus suggests moderate upside potential for these uranium companies.
| Company | Target High | Target Low | Consensus |
|---|---|---|---|
| Uranium Energy Corp. | 19.75 | 14.00 | 17.08 |
| Ur-Energy Inc. | 2.60 | 2.15 | 2.38 |
Analysts expect Uranium Energy Corp. to rise notably above its current price of 14.76 USD, while Ur-Energy Inc. shows similarly positive but more modest upside versus its 1.64 USD price.
Analyst Opinions Comparison
This section compares analysts’ ratings and grades for Uranium Energy Corp. (UEC) and Ur-Energy Inc. (URG):
Rating Comparison
UEC Rating
- Rating: D+ with a very favorable status overall.
- Discounted Cash Flow Score: 1, indicating very unfavorable valuation based on future cash flow.
- ROE Score: 1, showing very unfavorable efficiency in generating profit from shareholders’ equity.
- ROA Score: 1, reflecting very unfavorable asset utilization for earnings.
- Debt To Equity Score: 1, very unfavorable, indicating higher financial risk.
- Overall Score: 1, very unfavorable financial standing.
URG Rating
- Rating: D+ with a very favorable status overall.
- Discounted Cash Flow Score: 1, indicating very unfavorable valuation based on future cash flow.
- ROE Score: 1, showing very unfavorable efficiency in generating profit from shareholders’ equity.
- ROA Score: 1, reflecting very unfavorable asset utilization for earnings.
- Debt To Equity Score: 2, moderate score, indicating relatively stronger balance sheet stability.
- Overall Score: 1, very unfavorable financial standing.
Which one is the best rated?
Both UEC and URG share the same overall rating of D+ and very unfavorable scores in most categories. URG has a slightly better debt-to-equity score at 2, indicating a more moderate financial risk compared to UEC’s very unfavorable score of 1.
Scores Comparison
Here is a comparison of the Altman Z-Score and Piotroski Score for both companies:
UEC Scores
- Altman Z-Score: 30.44, indicating a safe zone for bankruptcy risk.
- Piotroski Score: 2, classified as very weak financial strength.
URG Scores
- Altman Z-Score: 0.60, placing the company in the distress zone.
- Piotroski Score: 2, also classified as very weak financial strength.
Which company has the best scores?
UEC has a substantially higher Altman Z-Score, indicating much lower bankruptcy risk compared to URG. Both companies share the same very weak Piotroski Score, suggesting similar financial strength levels.
Grades Comparison
The following is a comparison of recent reliable grades assigned to Uranium Energy Corp. and Ur-Energy Inc.:
Uranium Energy Corp. Grades
This table summarizes recent analyst grades and rating actions for Uranium Energy Corp.:
| Grading Company | Action | New Grade | Date |
|---|---|---|---|
| Roth Capital | Maintain | Buy | 2025-12-11 |
| Goldman Sachs | Maintain | Buy | 2025-09-26 |
| Roth Capital | Maintain | Buy | 2025-09-25 |
| HC Wainwright & Co. | Maintain | Buy | 2025-09-25 |
| BMO Capital | Downgrade | Market Perform | 2025-09-25 |
| Roth Capital | Maintain | Buy | 2025-09-03 |
| HC Wainwright & Co. | Maintain | Buy | 2025-08-06 |
| HC Wainwright & Co. | Maintain | Buy | 2025-03-13 |
| HC Wainwright & Co. | Maintain | Buy | 2024-12-09 |
| Roth MKM | Maintain | Buy | 2024-10-23 |
Overall, Uranium Energy Corp. has predominantly received “Buy” ratings, with one recent downgrade to “Market Perform,” indicating a generally positive but slightly cautious outlook.
Ur-Energy Inc. Grades
This table summarizes recent analyst grades and rating actions for Ur-Energy Inc.:
| Grading Company | Action | New Grade | Date |
|---|---|---|---|
| HC Wainwright & Co. | Maintain | Buy | 2025-11-04 |
| B. Riley Securities | Maintain | Buy | 2025-09-25 |
| Roth Capital | Maintain | Buy | 2025-09-23 |
| HC Wainwright & Co. | Maintain | Buy | 2025-04-15 |
| HC Wainwright & Co. | Maintain | Buy | 2025-02-11 |
| Roth MKM | Maintain | Buy | 2024-10-23 |
| B. Riley Securities | Maintain | Buy | 2024-08-20 |
| HC Wainwright & Co. | Maintain | Buy | 2024-08-14 |
| HC Wainwright & Co. | Maintain | Buy | 2024-07-17 |
| Roth MKM | Maintain | Buy | 2024-05-09 |
Ur-Energy Inc. consistently holds “Buy” ratings across multiple grading companies, reflecting a stable and affirmative consensus.
Which company has the best grades?
Both Uranium Energy Corp. and Ur-Energy Inc. share a consensus “Buy” rating from analysts, but Ur-Energy Inc. shows a more uniform “Buy” trend without downgrades, suggesting slightly stronger analyst confidence that may influence investor perception positively.
Strengths and Weaknesses
The table below summarizes the key strengths and weaknesses of Uranium Energy Corp. (UEC) and Ur-Energy Inc. (URG) based on their latest financial performance and market positioning.
| Criterion | Uranium Energy Corp. (UEC) | Ur-Energy Inc. (URG) |
|---|---|---|
| Diversification | Moderate, primarily uranium sales (66.8M USD in 2025) | Limited, no significant revenue diversification |
| Profitability | Negative net margin (-131.15%), but improving ROIC trend | Negative net margin (-157.8%), declining ROIC |
| Innovation | Slightly unfavorable economic moat, improving profitability | Very unfavorable economic moat, decreasing profitability |
| Global presence | Moderate, with stable but low asset turnover | Limited global footprint, low asset utilization |
| Market Share | Solid inventory sales growth, but value destruction ongoing | Weak market position with value destruction and declining profitability |
Key takeaways: UEC shows signs of improving profitability despite current value destruction, supported by growing ROIC and strong inventory sales. URG faces more serious challenges with declining profitability and no clear growth trend. Both companies carry investment risks but UEC appears better positioned for potential recovery.
Risk Analysis
Below is a table summarizing key risk metrics for Uranium Energy Corp. (UEC) and Ur-Energy Inc. (URG) based on the most recent financial data:
| Metric | Uranium Energy Corp. (UEC) | Ur-Energy Inc. (URG) |
|---|---|---|
| Market Risk | Beta 1.24, volatile range $3.85–17.80 | Beta 1.04, volatile range $0.55–2.35 |
| Debt level | Debt-to-Equity: 0.00 (favorable), Debt-to-Assets: 21% | Debt-to-Equity: 0.01 (favorable), Debt-to-Assets: 64% |
| Regulatory Risk | U.S., Canada, Paraguay mining jurisdictions; uranium sector highly regulated | U.S. focused, with 12 uranium projects in Wyoming; subject to strict mining and environmental regulations |
| Operational Risk | Low asset turnover, negative margins, weak profitability ratios | Low asset turnover, negative margins, weak profitability ratios |
| Environmental Risk | Mining operations can impact local ecosystems; uranium extraction requires strict environmental controls | Similar environmental exposure; uranium mining and processing entail regulatory scrutiny |
| Geopolitical Risk | Operations in stable jurisdictions but uranium market sensitive to geopolitical shifts | U.S. operations reduce geopolitical risk but uranium pricing affected globally |
In synthesis, both companies face significant operational and market risks due to their negative profitability and low asset efficiency. Ur-Energy shows higher leverage and is in financial distress per Altman Z-Score, increasing bankruptcy risk. Uranium Energy is financially safer but still exhibits weak profitability and unfavorable financial ratings. Regulatory and environmental compliance remains critical given the uranium industry’s sensitivity. Investors should weigh these risks carefully against potential uranium market upside.
Which Stock to Choose?
Uranium Energy Corp. (UEC) shows a strong revenue growth in 2025 but suffers from negative profitability and returns, with ROE at -8.91% and ROIC at -6.57%. Its debt levels are low and the overall financial ratios are mostly unfavorable, despite a very high current ratio. The company’s rating is very favorable, but its global financial and income evaluations remain unfavorable.
Ur-Energy Inc. (URG) experienced revenue growth over the last five years but faces deeper profitability challenges, with a net margin of -157.8% and ROE at -40.05%. Its debt metrics are moderate and financial ratios are slightly better but still unfavorable overall. The company’s rating is also very favorable, although its financial health is weaker, reflected by a very unfavorable Altman Z-Score and declining ROIC trend.
For investors, UEC’s improving profitability and growing ROIC might appeal to those seeking potential growth despite current losses, whereas URG’s deteriorating returns and distress zone score could suggest higher risk. Thus, risk-tolerant investors focused on turnaround potential may find UEC more appealing, while risk-averse investors might view both stocks cautiously given their unfavorable financial profiles.
Disclaimer: Investment carries a risk of loss of initial capital. The past performance is not a reliable indicator of future results. Be sure to understand risks before making an investment decision.
Go Further
I encourage you to read the complete analyses of Uranium Energy Corp. and Ur-Energy Inc. to enhance your investment decisions: