In the evolving uranium industry, NexGen Energy Ltd. (NXE) and Uranium Energy Corp. (UEC) stand out as key players shaping the future of nuclear fuel supply. Both companies focus on uranium exploration and development, but differ in geographic reach and project scale. This comparison explores their strategic positioning and innovation approaches, helping investors identify which company offers the most compelling opportunity in this critical energy sector. Let’s dive in to find the best fit for your portfolio.
Table of contents
Companies Overview
I will begin the comparison between NexGen Energy Ltd. and Uranium Energy Corp. by providing an overview of these two companies and their main differences.
NexGen Energy Ltd. Overview
NexGen Energy Ltd. is an exploration and development stage company focused on acquiring, exploring, and developing uranium properties in Canada. Its principal asset is the Rook I project, a large mineral claim area in the Athabasca Basin of Saskatchewan. The company is headquartered in Vancouver and operates within the energy sector, specifically targeting the uranium industry.
Uranium Energy Corp. Overview
Uranium Energy Corp. engages in exploration, pre-extraction, extraction, and processing of uranium and titanium concentrates across the United States, Canada, and Paraguay. It holds multiple projects in Texas, Arizona, Colorado, Wyoming, Canada, and Paraguay. Based in Corpus Christi, Texas, Uranium Energy Corp. operates in the energy sector with a diversified geographic footprint in uranium mining and processing.
Key similarities and differences
Both NexGen and Uranium Energy operate within the uranium industry, focusing on exploration and development of uranium resources. NexGen is primarily Canadian-focused with a major single asset, while Uranium Energy has a broader geographic spread across North and South America with a mix of uranium and titanium projects. NexGen is smaller in employee count but has a comparable market capitalization to Uranium Energy.
Income Statement Comparison
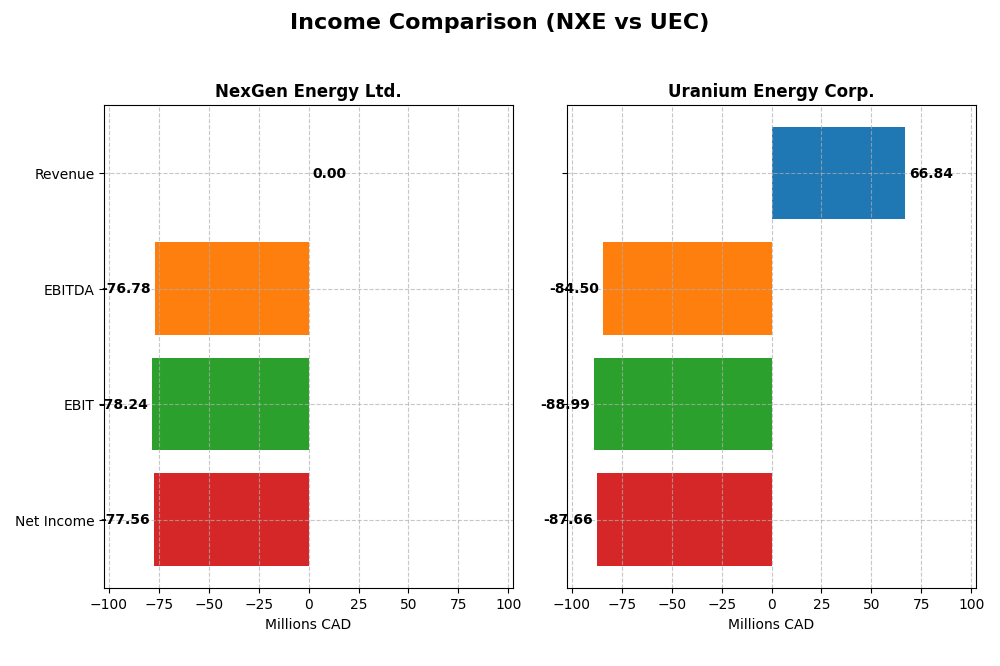
The table below compares the key income statement metrics for NexGen Energy Ltd. and Uranium Energy Corp. for their most recent fiscal years, highlighting differences in revenue, profitability, and earnings per share.
| Metric | NexGen Energy Ltd. (NXE) | Uranium Energy Corp. (UEC) |
|---|---|---|
| Market Cap | 7B CAD | 7.1B USD |
| Revenue | 0 CAD | 67M USD |
| EBITDA | -77M CAD | -85M USD |
| EBIT | -78M CAD | -89M USD |
| Net Income | -78M CAD | -88M USD |
| EPS | -0.14 CAD | -0.20 USD |
| Fiscal Year | 2024 | 2025 |
Income Statement Interpretations
NexGen Energy Ltd.
NexGen Energy Ltd. reported zero revenue from 2020 to 2024, with net income fluctuating significantly, including a net loss of -77.6M CAD in 2024 after a positive 80.8M CAD in 2023. Margins remained unfavorable due to persistent operating losses and zero gross profit. The 2024 fiscal year saw a sharp decline in EBIT and EPS, indicating deteriorated profitability and operational challenges.
Uranium Energy Corp.
Uranium Energy Corp. experienced volatile revenue, rising sharply to 164M USD in 2023 before dropping to 67M USD in 2025. Net income was negative for most years, including a -87.7M USD loss in 2025, despite a brief positive 5.3M USD in 2022. Gross margins were favorable at 36.6% in 2025, but EBIT and net margins remained unfavorable, reflecting high expenses and losses.
Which one has the stronger fundamentals?
Both companies show unfavorable overall income statement evaluations, but NexGen Energy has demonstrated some net income growth and EPS improvement over the long term despite zero revenue, while Uranium Energy shows stronger gross margins and revenue spikes but persistent net losses and declining net income growth. Each exhibits weaknesses in profitability and margin stability, underscoring risks in their current financial performance.
Financial Ratios Comparison
The table below compares key financial ratios for NexGen Energy Ltd. (NXE) and Uranium Energy Corp. (UEC) based on the most recent full fiscal year data available.
| Ratios | NexGen Energy Ltd. (2024 FY) | Uranium Energy Corp. (2025 FY) |
|---|---|---|
| ROE | -6.58% | -8.91% |
| ROIC | -4.39% | -6.57% |
| P/E | -67.80 | -42.30 |
| P/B | 4.46 | 3.77 |
| Current Ratio | 1.03 | 8.85 |
| Quick Ratio | 1.03 | 5.85 |
| D/E (Debt-to-Equity) | 0.39 | 0.0023 |
| Debt-to-Assets | 27.56% | 0.21% |
| Interest Coverage | -2.33 | -50.71 |
| Asset Turnover | 0 | 0.0603 |
| Fixed Asset Turnover | 0 | 0.0860 |
| Payout Ratio | 0 | 0 |
| Dividend Yield | 0% | 0% |
Interpretation of the Ratios
NexGen Energy Ltd.
NexGen Energy Ltd. shows mostly unfavorable ratios, with negative returns on equity (-6.58%) and invested capital (-4.39%), and a zero net margin. Its quick ratio (1.03) and debt-to-equity (0.39) are favorable, but interest coverage is negative (-2.4), indicating financial stress. The company does not pay dividends, reflecting its exploration stage and reinvestment strategy.
Uranium Energy Corp.
Uranium Energy Corp. also presents unfavorable profitability metrics, with a net margin of -131.15% and return on equity at -8.91%. Its quick ratio (5.85) and zero debt-to-equity stand out as favorable, but interest coverage is significantly negative (-61.54). Like NexGen, UEC does not pay dividends, likely due to ongoing investments and developmental focus.
Which one has the best ratios?
Both companies suffer from unfavorable profitability and coverage ratios, with similar proportions of favorable and unfavorable metrics. NexGen’s slightly better interest coverage and working capital contrast with Uranium Energy’s higher liquidity ratios. Overall, neither company demonstrates a clearly superior ratio profile based on the latest fiscal data.
Strategic Positioning
This section compares the strategic positioning of NexGen Energy Ltd. and Uranium Energy Corp. across market position, key segments, and exposure to technological disruption:
NexGen Energy Ltd.
- Focused on uranium exploration and development in Canada with a principal asset in Saskatchewan.
- Primarily driven by exploration and development of a large contiguous uranium project in the Athabasca Basin.
- Limited explicit exposure to technological disruption given exploration stage focus.
Uranium Energy Corp.
- Engaged in uranium and titanium exploration, extraction, and processing across US, Canada, and Paraguay.
- Revenue mainly from sale of uranium inventory and toll processing services across multiple projects.
- Exposure to technological change linked to diverse operations in uranium and titanium mining and processing.
NexGen Energy Ltd. vs Uranium Energy Corp. Positioning
NexGen has a concentrated approach centered on a single major uranium project, while Uranium Energy operates a diversified portfolio across uranium and titanium sectors and geographies. NexGen’s focus may limit operational complexity but increase project-specific risk. Uranium Energy’s broader base offers multiple revenue streams but may face higher management demands.
Which has the best competitive advantage?
Both companies show slightly unfavorable MOAT status, shedding value despite growing profitability. Neither currently demonstrates a strong economic moat, but Uranium Energy’s diversified operations might offer more resilience in invested capital efficiency trends.
Stock Comparison
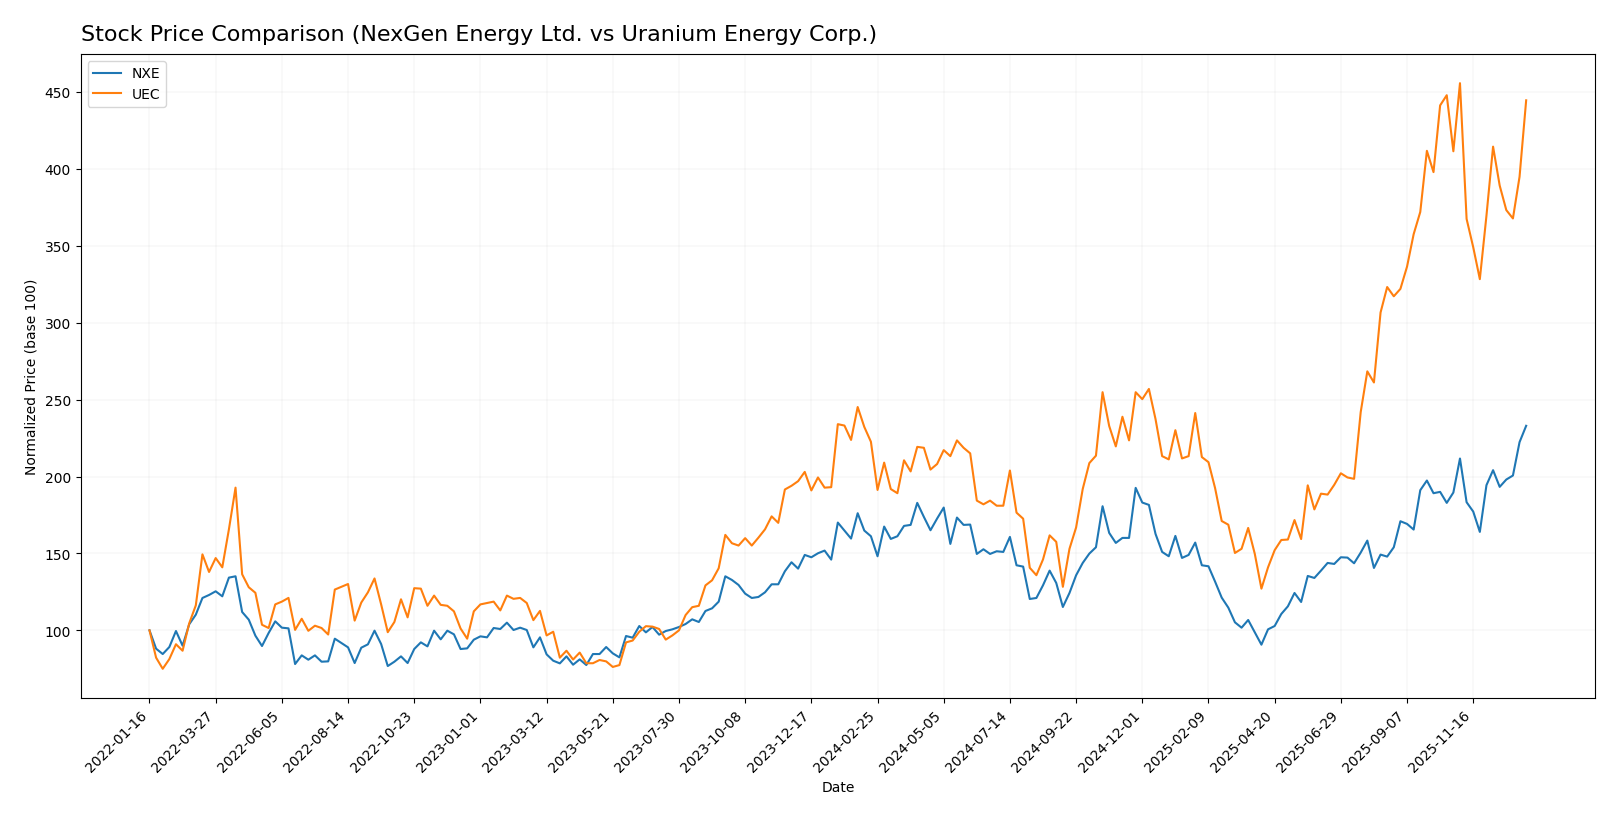
The stock price movements over the past year reveal strong bullish momentum for both NexGen Energy Ltd. and Uranium Energy Corp., with marked differences in acceleration and recent trading dynamics.
Trend Analysis
NexGen Energy Ltd. (NXE) exhibited a 44.55% price increase over the past 12 months, reflecting a bullish trend with accelerating momentum and relatively low volatility (1.3 std deviation). The stock ranged between 4.18 and 10.74 during this period.
Uranium Energy Corp. (UEC) showed a 99.73% gain over the same timeframe, also bullish but with decelerating momentum and higher volatility (2.82 std deviation). Its price fluctuated between 4.22 and 15.13.
Comparing both, UEC delivered the highest market performance with nearly double the percentage gain of NXE, despite slower recent momentum and higher price volatility.
Target Prices
The consensus target prices for Uranium Energy Corp. indicate moderate upside potential.
| Company | Target High | Target Low | Consensus |
|---|---|---|---|
| Uranium Energy Corp. | 19.75 | 14 | 17.08 |
Analysts expect Uranium Energy Corp. to trade above its current price of 14.76 USD, suggesting reasonable growth prospects. No verified target price data is available for NexGen Energy Ltd.
Analyst Opinions Comparison
This section compares analysts’ ratings and grades for NexGen Energy Ltd. and Uranium Energy Corp.:
Rating Comparison
NexGen Energy Ltd. Rating
- Rating: D+, assessed as Very Favorable overall rating
- Discounted Cash Flow Score: 2, indicating a Moderate status
- ROE Score: 1, considered Very Unfavorable
- ROA Score: 1, considered Very Unfavorable
- Debt To Equity Score: 1, rated Very Unfavorable
- Overall Score: 1, rated Very Unfavorable
Uranium Energy Corp. Rating
- Rating: D+, assessed as Very Favorable overall rating
- Discounted Cash Flow Score: 1, indicating a Very Unfavorable status
- ROE Score: 1, considered Very Unfavorable
- ROA Score: 1, considered Very Unfavorable
- Debt To Equity Score: 1, rated Very Unfavorable
- Overall Score: 1, rated Very Unfavorable
Which one is the best rated?
Both NexGen Energy Ltd. and Uranium Energy Corp. share the same overall rating of D+ and identical scores in ROE, ROA, Debt to Equity, and overall assessments. NexGen has a slightly better Discounted Cash Flow score, making its valuation outlook moderately more favorable.
Scores Comparison
The comparison of NexGen Energy Ltd. and Uranium Energy Corp. scores is as follows:
NexGen Energy Ltd. Scores
- Altman Z-Score: 6.89, indicating a safe zone with low bankruptcy risk.
- Piotroski Score: 1, classified as very weak financial strength.
Uranium Energy Corp. Scores
- Altman Z-Score: 30.44, indicating a safe zone with very low bankruptcy risk.
- Piotroski Score: 2, classified as very weak financial strength.
Which company has the best scores?
Uranium Energy Corp. has a significantly higher Altman Z-Score than NexGen Energy Ltd., both in the safe zone, implying stronger financial stability. Both companies share very weak Piotroski Scores, with Uranium Energy Corp. slightly higher but still weak.
Grades Comparison
The following presents a comparison of the recent grades assigned to NexGen Energy Ltd. and Uranium Energy Corp.:
NexGen Energy Ltd. Grades
This table summarizes the consensus grades for NexGen Energy Ltd. from verified grading companies.
| Grading Company | Action | New Grade | Date |
|---|---|---|---|
| Consensus | Buy | Buy | 2026 |
NexGen Energy Ltd. has a consistent consensus rating of “Buy” with no recorded variations or downgrades.
Uranium Energy Corp. Grades
Below is a summary of recent grades issued by recognized grading companies for Uranium Energy Corp.
| Grading Company | Action | New Grade | Date |
|---|---|---|---|
| Roth Capital | Maintain | Buy | 2025-12-11 |
| Goldman Sachs | Maintain | Buy | 2025-09-26 |
| Roth Capital | Maintain | Buy | 2025-09-25 |
| HC Wainwright & Co. | Maintain | Buy | 2025-09-25 |
| BMO Capital | Downgrade | Market Perform | 2025-09-25 |
| Roth Capital | Maintain | Buy | 2025-09-03 |
| HC Wainwright & Co. | Maintain | Buy | 2025-08-06 |
| HC Wainwright & Co. | Maintain | Buy | 2025-03-13 |
| HC Wainwright & Co. | Maintain | Buy | 2024-12-09 |
| Roth MKM | Maintain | Buy | 2024-10-23 |
Uranium Energy Corp. maintains a predominantly stable “Buy” rating across multiple grading firms, with a single downgrade to “Market Perform” noted in September 2025.
Which company has the best grades?
Uranium Energy Corp. shows a wider set of verified grades with mostly maintained “Buy” ratings, aside from one downgrade, while NexGen Energy Ltd. has a simpler consensus “Buy” rating. Investors might interpret the broader analyst coverage for Uranium Energy as a sign of higher market attention, potentially affecting liquidity and perception of risk.
Strengths and Weaknesses
Below is a comparative overview of key strengths and weaknesses for NexGen Energy Ltd. (NXE) and Uranium Energy Corp. (UEC) based on the latest financial and operational data.
| Criterion | NexGen Energy Ltd. (NXE) | Uranium Energy Corp. (UEC) |
|---|---|---|
| Diversification | Limited product diversification; primarily focused on uranium mining | Moderate revenue from inventory sales and toll processing services, indicating some operational diversity |
| Profitability | Negative ROIC (-4.39%), ROE (-6.58%), net margin 0%; shedding value but improving profitability | Negative ROIC (-6.57%), ROE (-8.91%), net margin -131.15%; also shedding value with improving ROIC trend |
| Innovation | No significant data on innovation; moderate asset turnover suggests low operational efficiency | Similar low asset turnover; no clear innovation edge reported |
| Global presence | Moderate global presence typical for mining; no specific data on international footprint | Similar global exposure; no major differentiation noted |
| Market Share | Not dominant, facing strong competition with unfavorable financial ratios | Also not dominant; financial struggles indicate limited market power |
Key takeaways: Both NXE and UEC are currently value destroyers with negative profitability metrics, although both show improving ROIC trends which may signal potential recovery. Neither company demonstrates strong diversification or operational efficiency, suggesting cautious investment with a focus on risk management.
Risk Analysis
Below is a comparison of key risks for NexGen Energy Ltd. (NXE) and Uranium Energy Corp. (UEC) based on the most recent data from 2025-2026.
| Metric | NexGen Energy Ltd. (NXE) | Uranium Energy Corp. (UEC) |
|---|---|---|
| Market Risk | High beta (1.856) indicates elevated price volatility. | Moderate beta (1.236), somewhat less volatile. |
| Debt level | Moderate debt-to-equity ratio (0.39), favorable leverage. | Near zero debt, very low financial risk from debt. |
| Regulatory Risk | Operating in Canada’s uranium sector with strict regulations. | Active in US and Paraguay uranium projects, exposed to multiple jurisdictions. |
| Operational Risk | Exploration and development stage; no current production or revenues. | Multiple projects at various stages, some pre-extraction, some operational. |
| Environmental Risk | Uranium mining’s inherent environmental concerns, especially in sensitive areas like Athabasca Basin. | Similar environmental exposure, with operations in diverse ecosystems across North America and Paraguay. |
| Geopolitical Risk | Primarily Canadian jurisdiction, stable political environment. | Exposure to US and Paraguay political climates, potential for higher geopolitical risk. |
The most likely and impactful risks lie in the companies’ operational stages and market volatility. NXE’s exploration phase and high beta imply significant price swings and execution risk, while UEC’s broader geographic footprint adds regulatory and geopolitical complexity. Both show very weak profitability metrics and unfavorable financial ratios, underscoring operational and market risks that investors should carefully weigh.
Which Stock to Choose?
NexGen Energy Ltd. (NXE) shows an unfavorable income evolution with no revenue growth in 2024 and a net margin at zero. Its financial ratios largely trend negative, including a negative ROE of -6.58% and ROIC of -4.39%, though some debt metrics appear favorable. The company is shedding value despite a slightly growing ROIC trend, with an overall unfavorable rating.
Uranium Energy Corp. (UEC) experiences mixed income results, including strong one-year revenue growth but unfavorable net margin and EPS declines. Its financial ratios reveal weaknesses such as a negative net margin of -131% and ROE of -8.91%, balanced by favorable debt ratios. UEC is also shedding value but shows a growing ROIC trend, with an overall unfavorable rating.
Investors seeking growth might find UEC’s recent revenue surge and ROIC improvement appealing despite profitability challenges, while those prioritizing financial stability could view NXE’s more moderate debt levels and improving profitability trend as relevant. Both companies exhibit risks and unfavorable comprehensive ratios, suggesting cautious interpretation.
Disclaimer: Investment carries a risk of loss of initial capital. The past performance is not a reliable indicator of future results. Be sure to understand risks before making an investment decision.
Go Further
I encourage you to read the complete analyses of NexGen Energy Ltd. and Uranium Energy Corp. to enhance your investment decisions: