In the dynamic uranium sector, Uranium Energy Corp. (UEC) and Energy Fuels Inc. (UUUU) stand out as key players with overlapping markets and distinct innovation strategies. Both companies engage in uranium extraction and exploration across the United States, making them direct competitors in a critical energy niche. This analysis will help you, the investor, identify which company offers the most compelling opportunity in today’s evolving energy landscape.
Table of contents
Companies Overview
I will begin the comparison between Uranium Energy Corp. and Energy Fuels Inc. by providing an overview of these two companies and their main differences.
Uranium Energy Corp. Overview
Uranium Energy Corp. operates in the uranium industry, focusing on exploration, pre-extraction, extraction, and processing of uranium and titanium concentrates across the US, Canada, and Paraguay. It holds interests in multiple mining projects predominantly in Texas, Arizona, Colorado, Wyoming, Canada, and Paraguay. Founded in 2003 and headquartered in Corpus Christi, Texas, the company aims to develop uranium resources efficiently in North America.
Energy Fuels Inc. Overview
Energy Fuels Inc. is engaged in uranium extraction, recovery, exploration, and sales within the US, operating major projects in Wyoming, Texas, and Utah. The company manages conventional and in situ uranium recovery as well as uranium/vanadium properties in various stages of development across several states. Incorporated in 1987 and based in Lakewood, Colorado, Energy Fuels emphasizes comprehensive uranium production and processing capabilities.
Key similarities and differences
Both companies operate in the uranium sector and focus on exploration and extraction activities in the United States, with projects in multiple states including Texas and Wyoming. Uranium Energy Corp. also processes titanium concentrates and has a smaller workforce of 94 compared to Energy Fuels’ 1260 employees. Energy Fuels operates a uranium mill and has a longer corporate history, established in 1987 versus Uranium Energy’s 2003 incorporation.
Income Statement Comparison
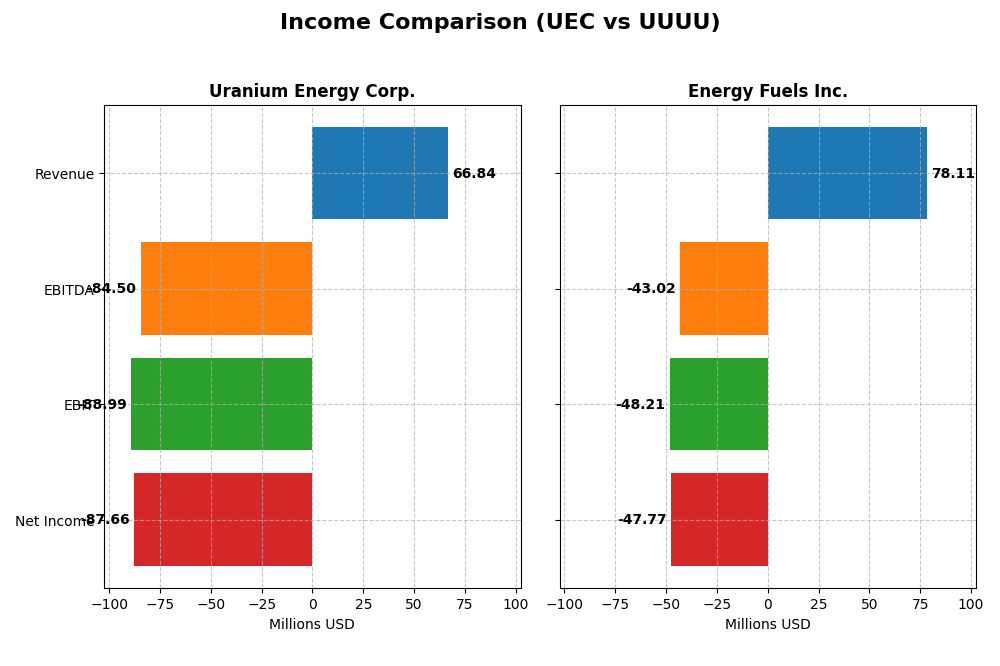
This table compares the latest fiscal year income statement metrics for Uranium Energy Corp. and Energy Fuels Inc., providing a snapshot of their financial performance.
| Metric | Uranium Energy Corp. | Energy Fuels Inc. |
|---|---|---|
| Market Cap | 7.1B | 4.3B |
| Revenue | 66.8M | 78.1M |
| EBITDA | -84.5M | -43.0M |
| EBIT | -88.9M | -48.2M |
| Net Income | -87.7M | -47.8M |
| EPS | -0.20 | -0.28 |
| Fiscal Year | 2025 | 2024 |
Income Statement Interpretations
Uranium Energy Corp.
Uranium Energy Corp. experienced volatile revenue and net income from 2021 to 2025, with revenue peaking at $164M in 2023 before dropping sharply to $67M in 2025. Despite a favorable gross margin of 36.62%, the company posted significant net losses, with a negative net margin of -131.15%. The most recent year showed strong revenue growth but worsening EBIT and EPS, indicating operational challenges.
Energy Fuels Inc.
Energy Fuels Inc. showed steady revenue growth, rising from $1.7M in 2020 to $78M in 2024. Gross profit remained positive, though gross margin was lower at 21.76%. The firm reported negative EBIT and net margins around -61% in 2024, reflecting high operating expenses. Recent performance indicates revenue doubling but deteriorating profitability and EPS, highlighting margin pressures.
Which one has the stronger fundamentals?
Between the two, Energy Fuels Inc. maintains a more consistent revenue growth trend with a neutral overall income statement opinion, supported by favorable gross margin and interest expense metrics. Uranium Energy Corp., despite favorable gross margin and revenue growth in the latest year, suffers from deeper and more persistent net losses, leading to an unfavorable global income statement evaluation.
Financial Ratios Comparison
The table below compares the most recent fiscal year-end financial ratios for Uranium Energy Corp. (UEC) and Energy Fuels Inc. (UUUU), providing insight into their profitability, liquidity, leverage, efficiency, and shareholder returns.
| Ratios | Uranium Energy Corp. (UEC) 2025 | Energy Fuels Inc. (UUUU) 2024 |
|---|---|---|
| ROE | -8.91% | -9.05% |
| ROIC | -6.57% | -6.67% |
| P/E | -42.3 | -18.47 |
| P/B | 3.77 | 1.67 |
| Current Ratio | 8.85 | 3.88 |
| Quick Ratio | 5.85 | 2.76 |
| D/E | 0.0023 | 0.0041 |
| Debt-to-Assets | 0.21% | 0.36% |
| Interest Coverage | -50.7 | 0 (no coverage) |
| Asset Turnover | 0.06 | 0.13 |
| Fixed Asset Turnover | 0.086 | 1.42 |
| Payout ratio | 0 | 0 |
| Dividend yield | 0 | 0 |
Interpretation of the Ratios
Uranium Energy Corp.
Uranium Energy Corp. displays mostly unfavorable financial ratios, including a negative net margin of -131.15% and return on equity of -8.91%. The company’s high current ratio of 8.85 is marked unfavorable, indicating potential inefficiencies in asset use. It pays no dividends, likely due to negative profitability and a focus on reinvestment or growth.
Energy Fuels Inc.
Energy Fuels Inc. also shows unfavorable ratios, with a net margin of -61.15% and return on equity of -9.05%. Its weighted average cost of capital at 12.47% is unfavorable, suggesting higher capital costs. Despite a moderate current ratio of 3.88, liquidity remains a concern. The company does not pay dividends, possibly prioritizing operational expansion and R&D.
Which one has the best ratios?
Both companies present predominantly unfavorable ratios, reflecting challenges in profitability and operational efficiency. Uranium Energy Corp. has a higher current ratio but weaker profitability metrics. Energy Fuels Inc. benefits from a lower price-to-book ratio and marginally better asset turnover. Overall, neither company demonstrates clearly superior financial ratios.
Strategic Positioning
This section compares the strategic positioning of Uranium Energy Corp. and Energy Fuels Inc., including market position, key segments, and exposure to technological disruption:
Uranium Energy Corp.
- Mid-sized uranium producer with competitive pressure in US and Canadian markets.
- Focused on uranium and titanium exploration, extraction, and processing across multiple US and international sites.
- Limited explicit exposure to technological disruption noted in operations or market approach.
Energy Fuels Inc.
- Smaller market cap with higher volatility and competition in US uranium industry.
- Concentrates on uranium extraction and recovery, including conventional and in situ methods, plus uranium/vanadium properties.
- No specific technological disruption exposure identified in available data.
Uranium Energy Corp. vs Energy Fuels Inc. Positioning
Uranium Energy Corp. pursues a diversified portfolio across multiple regions and minerals, potentially spreading risk but requiring broad management. Energy Fuels Inc. has a more concentrated focus on uranium and associated metals, which may increase operational specialization but limit diversification benefits.
Which has the best competitive advantage?
Both companies show slightly unfavorable MOAT status, shedding value but with improving profitability trends. Neither currently demonstrates a clear competitive advantage based on ROIC versus WACC evaluation.
Stock Comparison
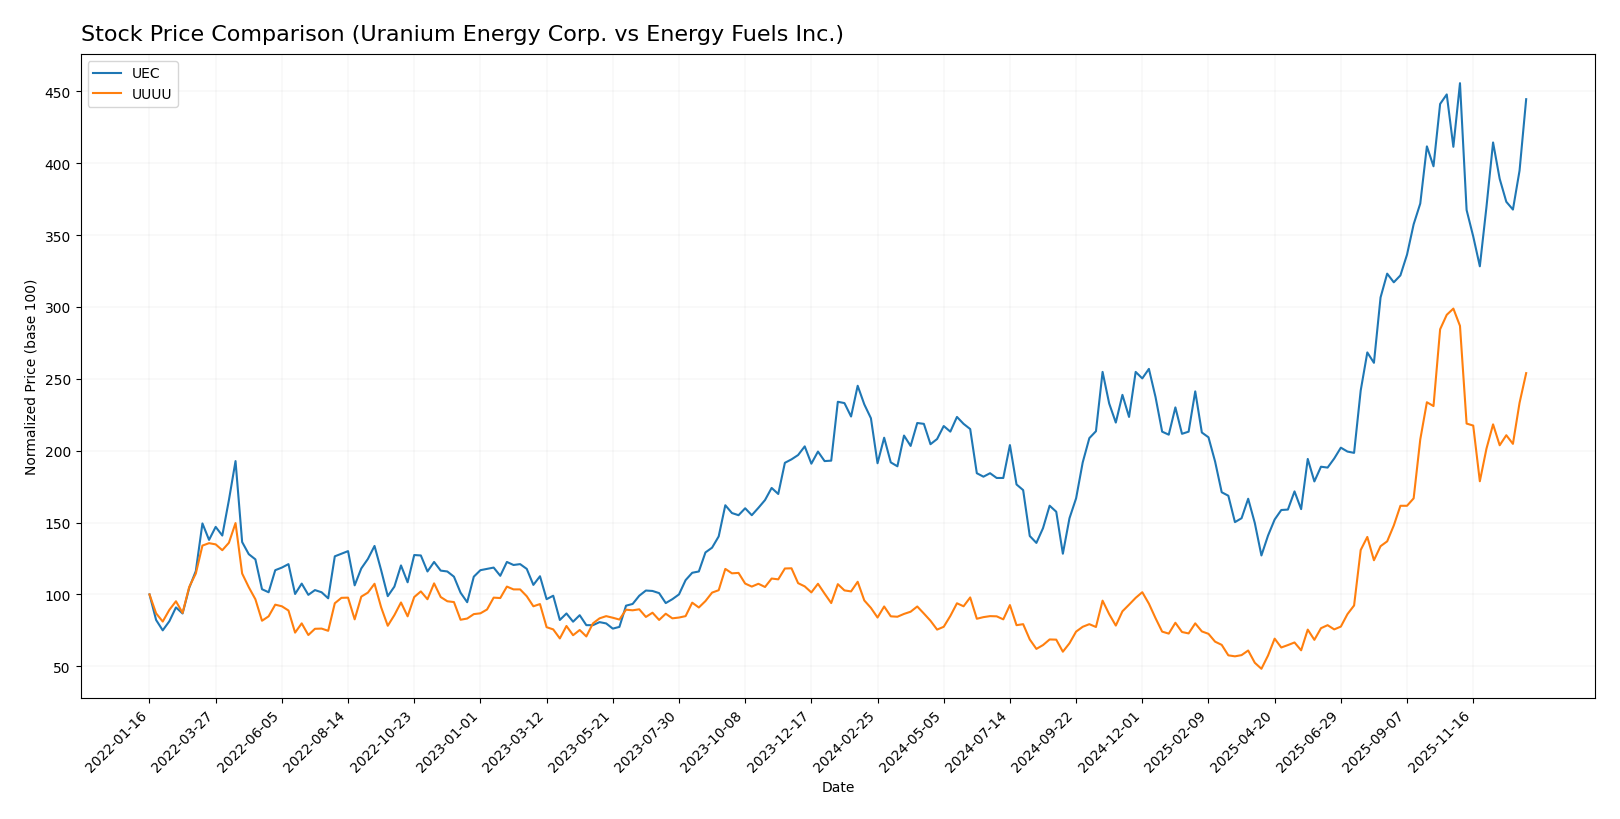
The past year saw significant bullish momentum for both Uranium Energy Corp. and Energy Fuels Inc., with notable price appreciation followed by a recent period of mixed trading dynamics and deceleration in trend growth.
Trend Analysis
Uranium Energy Corp. exhibited a strong bullish trend over the past 12 months with a 99.73% price increase, showing deceleration and a highest price of 15.13. Volatility measured by std deviation was moderate at 2.82.
Energy Fuels Inc. posted an even more pronounced bullish trend, gaining 180.25% over the same period, but also experienced deceleration. It showed higher volatility with a std deviation of 4.44 and a peak price of 21.37.
Comparing both, Energy Fuels Inc. delivered the highest market performance with a greater overall price increase despite a recent bearish correction, while Uranium Energy Corp. maintained steady gains.
Target Prices
The consensus among analysts reflects a positive outlook for both Uranium Energy Corp. and Energy Fuels Inc.
| Company | Target High | Target Low | Consensus |
|---|---|---|---|
| Uranium Energy Corp. | 19.75 | 14.00 | 17.08 |
| Energy Fuels Inc. | 26.75 | 11.50 | 19.13 |
Analysts expect Uranium Energy Corp.’s stock to rise moderately above its current price of $14.76, while Energy Fuels Inc. shows potential for a stronger upside from $18.16. Overall, the target prices suggest bullish sentiment.
Analyst Opinions Comparison
This section compares analysts’ ratings and grades for Uranium Energy Corp. (UEC) and Energy Fuels Inc. (UUUU):
Rating Comparison
UEC Rating
- Rating: Both companies hold a D+ rating, indicating a very favorable overall status.
- Discounted Cash Flow Score: Both have a score of 1, rated very unfavorable for cash flow valuation.
- ROE Score: Each company scores 1, reflecting very unfavorable efficiency in generating shareholder returns.
- ROA Score: Both firms have a score of 1, showing very unfavorable asset utilization.
- Debt To Equity Score: Both report a score of 1, indicating very unfavorable financial risk.
- Overall Score: A score of 1 for both, marking a very unfavorable overall financial standing.
UUUU Rating
- Rating: Both companies hold a D+ rating, indicating a very favorable overall status.
- Discounted Cash Flow Score: Both have a score of 1, rated very unfavorable for cash flow valuation.
- ROE Score: Each company scores 1, reflecting very unfavorable efficiency in generating shareholder returns.
- ROA Score: Both firms have a score of 1, showing very unfavorable asset utilization.
- Debt To Equity Score: Both report a score of 1, indicating very unfavorable financial risk.
- Overall Score: A score of 1 for both, marking a very unfavorable overall financial standing.
Which one is the best rated?
Based strictly on the provided data, UEC and UUUU share identical ratings and scores across all key metrics, resulting in neither company being better rated than the other.
Scores Comparison
Here is a comparison of the Altman Z-Score and Piotroski Score for Uranium Energy Corp. and Energy Fuels Inc.:
UEC Scores
- Altman Z-Score: 30.44, indicating a safe zone status
- Piotroski Score: 2, classified as very weak
UUUU Scores
- Altman Z-Score: 40.34, indicating a safe zone status
- Piotroski Score: 1, classified as very weak
Which company has the best scores?
Both UEC and UUUU display Altman Z-Scores in the safe zone, with UUUU having a higher score. Both have very weak Piotroski Scores, with UEC slightly outperforming UUUU in this regard.
Grades Comparison
The following presents a detailed comparison of the recent grades assigned to Uranium Energy Corp. and Energy Fuels Inc.:
Uranium Energy Corp. Grades
This table summarizes recent grades from recognized grading companies for Uranium Energy Corp.
| Grading Company | Action | New Grade | Date |
|---|---|---|---|
| Roth Capital | Maintain | Buy | 2025-12-11 |
| Goldman Sachs | Maintain | Buy | 2025-09-26 |
| Roth Capital | Maintain | Buy | 2025-09-25 |
| HC Wainwright & Co. | Maintain | Buy | 2025-09-25 |
| BMO Capital | Downgrade | Market Perform | 2025-09-25 |
| Roth Capital | Maintain | Buy | 2025-09-03 |
| HC Wainwright & Co. | Maintain | Buy | 2025-08-06 |
| HC Wainwright & Co. | Maintain | Buy | 2025-03-13 |
| HC Wainwright & Co. | Maintain | Buy | 2024-12-09 |
| Roth MKM | Maintain | Buy | 2024-10-23 |
Uranium Energy Corp. shows a strong predominance of “Buy” ratings, with a single downgrade to “Market Perform” indicating a generally positive but cautious outlook.
Energy Fuels Inc. Grades
This table outlines recent grades awarded to Energy Fuels Inc. by reputable grading firms.
| Grading Company | Action | New Grade | Date |
|---|---|---|---|
| HC Wainwright & Co. | Maintain | Buy | 2026-01-09 |
| Roth Capital | Downgrade | Sell | 2025-11-05 |
| HC Wainwright & Co. | Maintain | Buy | 2025-11-04 |
| HC Wainwright & Co. | Maintain | Buy | 2025-10-21 |
| B. Riley Securities | Maintain | Buy | 2025-10-08 |
| HC Wainwright & Co. | Maintain | Buy | 2025-09-17 |
| HC Wainwright & Co. | Maintain | Buy | 2025-08-08 |
| Canaccord Genuity | Maintain | Buy | 2025-07-02 |
| HC Wainwright & Co. | Maintain | Buy | 2025-05-09 |
| HC Wainwright & Co. | Maintain | Buy | 2025-02-28 |
Energy Fuels Inc. mostly received “Buy” ratings, but includes a notable downgrade to “Sell” by Roth Capital, reflecting some mixed sentiment among analysts.
Which company has the best grades?
Both companies have a majority of “Buy” ratings; however, Uranium Energy Corp. has fewer downgrades and no “Sell” ratings, suggesting slightly stronger analyst confidence. Investors might interpret this as a more stable endorsement for Uranium Energy Corp., while Energy Fuels Inc.’s mixed signals could imply higher risk or uncertainty.
Strengths and Weaknesses
Below is a comparison of key strengths and weaknesses for Uranium Energy Corp. (UEC) and Energy Fuels Inc. (UUUU) based on their recent financial and operational data.
| Criterion | Uranium Energy Corp. (UEC) | Energy Fuels Inc. (UUUU) |
|---|---|---|
| Diversification | Limited product range focused on uranium sales; modest service revenue (Toll Processing Services ~224K USD in 2024) | Primarily uranium-focused with no reported product segmentation diversification |
| Profitability | Negative net margin (-131.15%), ROIC -6.57%, shedding value but with growing ROIC trend | Negative net margin (-61.15%), ROIC -6.67%, also shedding value with improving ROIC |
| Innovation | No explicit data on innovation; moderate asset turnover (0.06) indicates low operational efficiency | Moderate asset turnover (0.13) and fixed asset turnover (1.42 neutral) suggest better operational utilization |
| Global presence | No explicit global footprint data; relatively small scale with inventory sales of 66.8M USD in 2025 | No explicit global presence data available |
| Market Share | Limited market share in uranium sector, reflected by low profitability and efficiency ratios | Similar limited market position with unfavorable profitability metrics |
Key takeaways: Both companies currently struggle with profitability and value creation, though each shows signs of improving returns on invested capital. UEC has slightly better liquidity ratios, while UUUU demonstrates somewhat better operational turnover. Investors should approach with caution given ongoing value destruction but monitor their ROIC trends for potential turnaround.
Risk Analysis
Below is a comparison of key risks for Uranium Energy Corp. (UEC) and Energy Fuels Inc. (UUUU) based on the most recent data available:
| Metric | Uranium Energy Corp. (UEC) | Energy Fuels Inc. (UUUU) |
|---|---|---|
| Market Risk | Beta 1.24; moderate volatility | Beta 1.85; higher volatility |
| Debt Level | Low debt-to-equity, 0.0; favorable | Low debt-to-equity, 0.0; favorable |
| Regulatory Risk | High, uranium mining is tightly regulated in the US and Canada | High, operating multiple uranium sites with complex permits |
| Operational Risk | Small workforce (94); multiple projects increase complexity | Larger workforce (1260); diverse assets could mean operational complexity |
| Environmental Risk | Significant, uranium and titanium mining impact | Significant, uranium and vanadium mining impact |
| Geopolitical Risk | Moderate, projects in US, Canada, Paraguay | Moderate, mainly US operations but exposure in multiple states |
Both companies face substantial regulatory and environmental risks due to the nature of uranium mining and processing. Energy Fuels exhibits higher market volatility and operational complexity due to its larger scale. Uranium Energy’s very low debt is a positive, but both firms show unfavorable profitability metrics, indicating financial risks. The regulatory environment remains the most impactful risk factor for investors to monitor closely.
Which Stock to Choose?
Uranium Energy Corp. (UEC) shows a highly favorable revenue growth of 29,738% in one year but maintains an overall unfavorable income statement with a negative net margin of -131.15%. Financial ratios remain mostly unfavorable, with a strong current ratio of 8.85 but weak profitability and asset turnover, and a very favorable rating of D+ despite poor underlying scores. Its ROIC is below WACC, signaling value destruction, though ROIC is trending upward.
Energy Fuels Inc. (UUUU) presents a neutral overall income statement evaluation with moderate revenue growth of 106% last year and a net margin of -61.15%. Financial ratios are mixed, with 28.57% favorable and 57.14% unfavorable metrics, including a solid quick ratio and low debt, paired with a very favorable D+ rating but weak profitability scores. Similar to UEC, its ROIC is below WACC with improving trends, indicating slight value erosion.
Investors focusing on growth might see potential in UEC’s strong revenue acceleration and improving profitability trends, while those prioritizing a more balanced financial profile could find UUUU’s neutral income statement and moderate ratio performance more aligned with their preferences. Both companies currently indicate value destruction but show signs of improving returns on invested capital.
Disclaimer: Investment carries a risk of loss of initial capital. The past performance is not a reliable indicator of future results. Be sure to understand risks before making an investment decision.
Go Further
I encourage you to read the complete analyses of Uranium Energy Corp. and Energy Fuels Inc. to enhance your investment decisions: