In the evolving uranium industry, Uranium Energy Corp. (UEC) and enCore Energy Corp. (EU) stand out as key players with significant U.S.-based operations. Both companies focus on uranium exploration and development, targeting critical energy resources with distinct project portfolios and innovation approaches. This article will analyze their strengths and risks to help you decide which uranium stock deserves a place in your investment portfolio.
Table of contents
Companies Overview
I will begin the comparison between Uranium Energy Corp. and enCore Energy Corp. by providing an overview of these two companies and their main differences.
Uranium Energy Corp. Overview
Uranium Energy Corp. focuses on the exploration, pre-extraction, extraction, and processing of uranium and titanium concentrates across the US, Canada, and Paraguay. The company manages multiple mining projects in Texas, Arizona, Colorado, Wyoming, Canada, and Paraguay. Incorporated in 2003 and headquartered in Corpus Christi, Texas, UEC is a significant player in the uranium industry with a market cap of approximately 7.1B USD.
enCore Energy Corp. Overview
enCore Energy Corp. specializes in the acquisition, exploration, and development of uranium resource properties exclusively in the United States. It holds interests in several uranium projects primarily in New Mexico, South Dakota, Wyoming, and Utah. Founded in 2011 and also based in Corpus Christi, Texas, enCore has a market cap near 519M USD, reflecting a more focused geographic approach compared to UEC.
Key similarities and differences
Both UEC and enCore operate within the uranium industry and are headquartered in Corpus Christi, Texas. Each company is involved in uranium exploration and development; however, UEC has a broader geographic footprint including Canada and Paraguay, while enCore concentrates solely on US projects. UEC is considerably larger in market capitalization, suggesting a more extensive asset base and scale of operations compared to enCore.
Income Statement Comparison
This table compares key income statement metrics for Uranium Energy Corp. and enCore Energy Corp. based on their most recent fiscal year data.
| Metric | Uranium Energy Corp. (UEC) | enCore Energy Corp. (EU) |
|---|---|---|
| Market Cap | 7.13B | 519M |
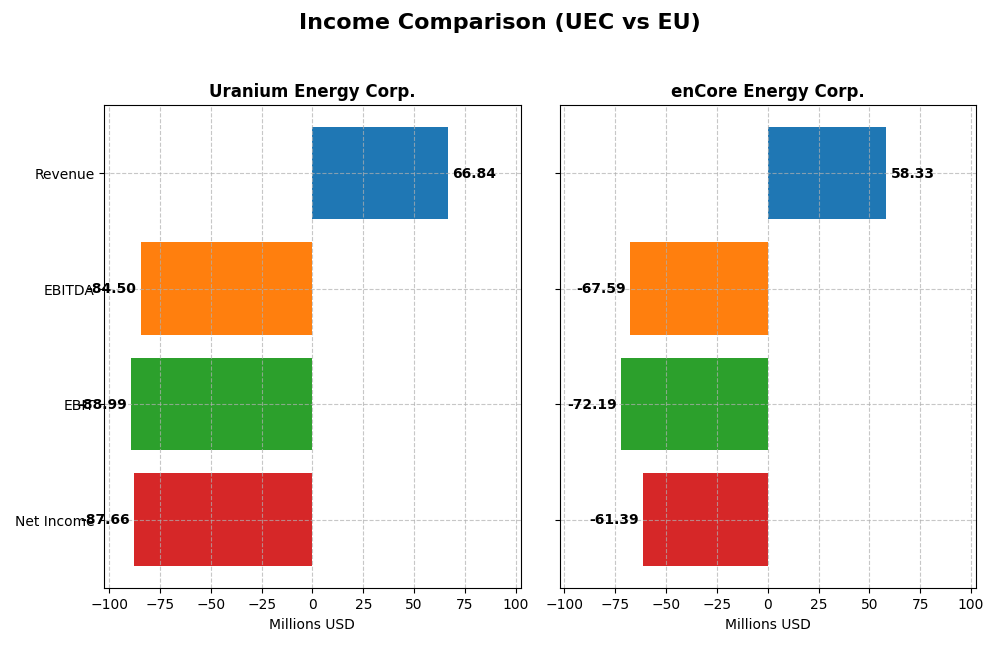
| Revenue | 67M | 58.3M |
| EBITDA | -84.5M | -67.6M |
| EBIT | -89.0M | -72.2M |
| Net Income | -87.7M | -61.4M |
| EPS | -0.20 | -0.34 |
| Fiscal Year | 2025 | 2024 |
Income Statement Interpretations
Uranium Energy Corp.
Uranium Energy Corp. experienced fluctuating revenue and net income from 2021 to 2025, with a notable surge in revenue in 2025 to $66.8M from $224K in 2024. Despite this growth, net income remained negative at -$87.7M in 2025. Gross margin was favorable at 36.62%, but EBIT and net margins were significantly negative, reflecting ongoing operational challenges and high expenses.
enCore Energy Corp.
enCore Energy Corp. showed increasing revenue from 2020 to 2024, reaching $58.3M in 2024, though it reported a negative gross margin of -12.35%. Net income was consistently negative, hitting -$61.4M in 2024. While revenue growth was favorable at 163.38% in the last year, margins remained under pressure, with EBIT and net margins deeply negative, indicating persistent profitability issues.
Which one has the stronger fundamentals?
Both companies face unfavorable overall income statement conditions, with Uranium Energy Corp. showing better gross margin and interest expense control but deeper net losses in 2025. enCore Energy Corp. exhibits weaker gross margins and higher operating losses despite revenue growth. Neither company demonstrates strong profitability, with both struggling to convert revenue growth into net income improvements.
Financial Ratios Comparison
The table below compares key financial ratios for Uranium Energy Corp. and enCore Energy Corp. based on their most recent full fiscal year data.
| Ratios | Uranium Energy Corp. (2025) | enCore Energy Corp. (2024) |
|---|---|---|
| ROE | -8.91% | -21.49% |
| ROIC | -6.57% | -17.34% |
| P/E | -42.30 | -10.11 |
| P/B | 3.77 | 2.17 |
| Current Ratio | 8.85 | 2.91 |
| Quick Ratio | 5.85 | 2.21 |
| D/E (Debt-to-Equity) | 0.0023 | 0.0715 |
| Debt-to-Assets | 0.21% | 5.20% |
| Interest Coverage | -50.71 | -41.60 |
| Asset Turnover | 0.06 | 0.15 |
| Fixed Asset Turnover | 0.09 | 0.20 |
| Payout ratio | 0 | 0 |
| Dividend yield | 0% | 0% |
Interpretation of the Ratios
Uranium Energy Corp.
Uranium Energy Corp. displays mostly unfavorable financial ratios, including negative net margin (-131.15%) and return on equity (-8.91%), alongside weak asset turnover (0.06). Its high current ratio (8.85) is flagged unfavorable, possibly indicating inefficient use of assets. The company does not pay dividends, reflecting its reinvestment strategy and challenging profitability.
enCore Energy Corp.
enCore Energy Corp. also presents unfavorable ratios such as negative net margin (-105.24%) and poor return on invested capital (-17.34%). However, it shows some strengths with favorable current (2.91) and quick ratios (2.21), indicating liquidity. Like Uranium Energy, enCore Energy does not distribute dividends, consistent with its growth and development focus.
Which one has the best ratios?
Both companies have predominantly unfavorable financial ratios, with Uranium Energy Corp. showing a slightly higher proportion of unfavorable metrics (64.29%) compared to enCore Energy Corp. (57.14%). enCore Energy demonstrates better liquidity ratios and a lower debt-to-assets ratio, but neither company currently pays dividends or achieves profitability, resulting in a cautious overall view.
Strategic Positioning
This section compares the strategic positioning of Uranium Energy Corp. and enCore Energy Corp., focusing on market position, key segments, and exposure to technological disruption:
Uranium Energy Corp.
- Large market cap of 7.1B USD with diverse projects across US, Canada, and Paraguay.
- Engages in exploration, extraction, and processing of uranium and titanium concentrates.
- Operates in established uranium mining techniques; no explicit exposure to technological disruption mentioned.
enCore Energy Corp.
- Smaller market cap of 519M USD focused on uranium projects mainly in New Mexico and Wyoming.
- Primarily focused on uranium acquisition, exploration, and development in US uranium belts.
- No explicit mention of technological disruption exposure; focuses on traditional uranium mining areas.
Uranium Energy Corp. vs enCore Energy Corp. Positioning
Uranium Energy Corp. adopts a diversified geographic and product approach including uranium and titanium, benefiting from scale but facing complexity. enCore Energy remains concentrated in uranium within US regions, potentially simplifying operations but limiting diversification.
Which has the best competitive advantage?
Based on MOAT evaluation, Uranium Energy Corp. shows a slightly unfavorable position with growing profitability, while enCore Energy has a very unfavorable position with declining profitability, indicating Uranium Energy likely has a comparatively stronger competitive advantage.
Stock Comparison
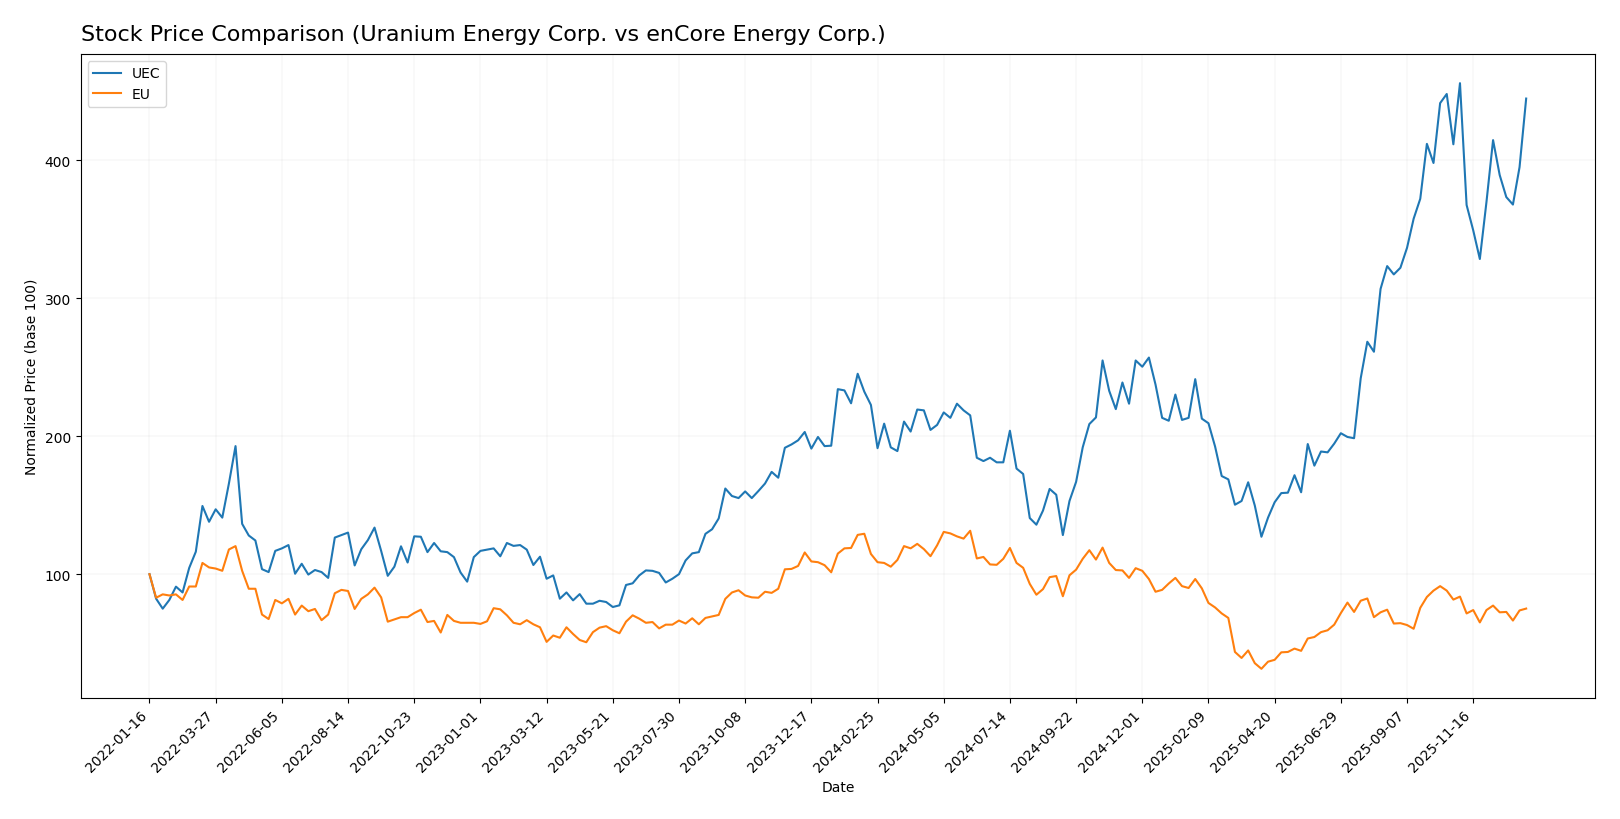
The past year has seen Uranium Energy Corp. (UEC) exhibit a strong bullish trend with significant price appreciation, while enCore Energy Corp. (EU) experienced a notable bearish trajectory marked by consistent declines.
Trend Analysis
Uranium Energy Corp. (UEC) displayed a bullish trend over the past 12 months with a 99.73% price increase, showing deceleration in growth and a price range from 4.22 to 15.13. Recent months show a mild 8.05% gain with lower volatility.
enCore Energy Corp. (EU) faced a bearish trend over the same period with a 34.52% price decline, also decelerating, with prices ranging between 1.16 and 4.85. The recent trend continued downward by 7.97%, reflecting reduced volatility.
Comparing both stocks, UEC delivered significantly higher market performance with near 100% gains, while EU’s value decreased substantially, highlighting contrasting investor sentiment.
Target Prices
The latest analyst consensus presents clear target price ranges for Uranium Energy Corp. and enCore Energy Corp.
| Company | Target High | Target Low | Consensus |
|---|---|---|---|
| Uranium Energy Corp. | 19.75 | 14.00 | 17.08 |
| enCore Energy Corp. | 3.50 | 3.50 | 3.50 |
Analysts expect Uranium Energy Corp.’s price to appreciate above its current 14.76 USD, while enCore Energy Corp.’s consensus target at 3.50 USD is notably higher than its current 2.77 USD, indicating potential upside for both stocks.
Analyst Opinions Comparison
This section compares analysts’ ratings and grades for Uranium Energy Corp. and enCore Energy Corp.:
Rating Comparison
UEC Rating
- Rating: D+, considered very favorable by analysts.
- Discounted Cash Flow Score: 1, very unfavorable valuation.
- ROE Score: 1, indicates very unfavorable profitability.
- ROA Score: 1, shows very unfavorable asset efficiency.
- Debt To Equity Score: 1, very unfavorable leverage.
- Overall Score: 1, very unfavorable overall financial health.
EU Rating
- Rating: C-, also viewed as very favorable by analysts.
- Discounted Cash Flow Score: 1, very unfavorable valuation.
- ROE Score: 1, indicates very unfavorable profitability.
- ROA Score: 1, shows very unfavorable asset efficiency.
- Debt To Equity Score: 2, moderate financial risk.
- Overall Score: 1, very unfavorable overall financial health.
Which one is the best rated?
Based on the provided data, both Uranium Energy Corp. and enCore Energy Corp. share the same very unfavorable overall scores and financial performance metrics, except for enCore’s moderately better debt-to-equity score and price-to-book score. Overall ratings favor enCore Energy Corp. slightly.
Scores Comparison
Here is a comparison of the Altman Z-Score and Piotroski Score for Uranium Energy Corp. and enCore Energy Corp.:
UEC Scores
- Altman Z-Score: 30.44, indicating a safe zone with very low bankruptcy risk.
- Piotroski Score: 2, categorized as very weak financial strength.
EU Scores
- Altman Z-Score: 1.17, indicating distress zone with high bankruptcy risk.
- Piotroski Score: 4, categorized as average financial strength.
Which company has the best scores?
Based strictly on these scores, UEC shows a much stronger Altman Z-Score indicating financial safety, while EU has a better Piotroski Score reflecting stronger financial health. The companies display contrasting strengths in these metrics.
Grades Comparison
Here is a comparison of recent grades assigned to Uranium Energy Corp. and enCore Energy Corp.:
Uranium Energy Corp. Grades
The following table summarizes recent grades from verified grading companies for Uranium Energy Corp.:
| Grading Company | Action | New Grade | Date |
|---|---|---|---|
| Roth Capital | Maintain | Buy | 2025-12-11 |
| Goldman Sachs | Maintain | Buy | 2025-09-26 |
| Roth Capital | Maintain | Buy | 2025-09-25 |
| HC Wainwright & Co. | Maintain | Buy | 2025-09-25 |
| BMO Capital | Downgrade | Market Perform | 2025-09-25 |
| Roth Capital | Maintain | Buy | 2025-09-03 |
| HC Wainwright & Co. | Maintain | Buy | 2025-08-06 |
| HC Wainwright & Co. | Maintain | Buy | 2025-03-13 |
| HC Wainwright & Co. | Maintain | Buy | 2024-12-09 |
| Roth MKM | Maintain | Buy | 2024-10-23 |
The overall trend for Uranium Energy Corp. shows predominantly stable buy ratings, with one recent downgrade to market perform, indicating mostly positive analyst sentiment.
enCore Energy Corp. Grades
The following table summarizes recent grades from verified grading companies for enCore Energy Corp.:
| Grading Company | Action | New Grade | Date |
|---|---|---|---|
| HC Wainwright & Co. | Maintain | Buy | 2025-08-12 |
| HC Wainwright & Co. | Maintain | Buy | 2025-05-13 |
| HC Wainwright & Co. | Maintain | Buy | 2025-03-18 |
| HC Wainwright & Co. | Maintain | Buy | 2024-11-19 |
| HC Wainwright & Co. | Maintain | Buy | 2024-10-07 |
| HC Wainwright & Co. | Maintain | Buy | 2024-08-15 |
| HC Wainwright & Co. | Maintain | Buy | 2024-06-14 |
| B. Riley Securities | Maintain | Buy | 2024-05-15 |
enCore Energy Corp. maintains a consistent buy rating from multiple verified grading sources, reflecting steady positive analyst consensus.
Which company has the best grades?
Both Uranium Energy Corp. and enCore Energy Corp. have predominantly buy ratings from reputable analysts. Uranium Energy Corp. shows a slightly broader analyst coverage with one recent downgrade, while enCore Energy Corp.’s ratings remain uniformly positive. This suggests investors might view Uranium Energy Corp. with cautious optimism, whereas enCore Energy Corp. appears to have more consistent analyst support.
Strengths and Weaknesses
Below is a comparison table highlighting key strengths and weaknesses of Uranium Energy Corp. (UEC) and enCore Energy Corp. (EU) based on their recent financial and operational data.
| Criterion | Uranium Energy Corp. (UEC) | enCore Energy Corp. (EU) |
|---|---|---|
| Diversification | Moderate; revenue mainly from Sale of Inventory | Limited; no reported revenue segments |
| Profitability | Negative net margin (-131.15%), ROIC -6.57%, but improving ROIC trend | Negative net margin (-105.24%), ROIC -17.34%, declining ROIC trend |
| Innovation | Moderate; some toll processing services | Low; limited operational data |
| Global presence | Moderate; US-based with focus on uranium market | Limited; primarily domestic focus |
| Market Share | Modest; growing sales with $66.8M inventory sales in 2025 | Small; no sales reported recently |
Key takeaways: Both UEC and EU face significant profitability challenges with negative returns and unfavorable financial ratios. UEC shows a slightly more positive trend in ROIC and revenue generation, suggesting a potential for recovery, whereas EU’s declining profitability and lack of revenue indicate higher risk. Investors should weigh these factors carefully with attention to risk management.
Risk Analysis
Below is a comparative table of key risks for Uranium Energy Corp. (UEC) and enCore Energy Corp. (EU) based on the most recent data available for 2025 and 2024 respectively:
| Metric | Uranium Energy Corp. (UEC) | enCore Energy Corp. (EU) |
|---|---|---|
| Market Risk | Moderate (Beta 1.236) | Higher (Beta 1.438) |
| Debt Level | Very Low (D/E 0.0, Debt to Assets 0.21%) | Low (D/E 0.07, Debt to Assets 5.2%) |
| Regulatory Risk | Moderate (U.S. uranium mining regulations) | Moderate (U.S. uranium mining regulations) |
| Operational Risk | High (Negative margins, weak asset turnover) | High (Negative margins, weak asset turnover) |
| Environmental Risk | Medium (Mining impacts in multiple US states, Canada, Paraguay) | Medium (Mining impacts concentrated in US Southwest) |
| Geopolitical Risk | Low to Medium (Operations primarily in politically stable areas) | Low to Medium (Operations in stable US jurisdictions) |
Synthesis: Both companies face significant operational risks due to negative profitability and inefficient asset utilization. enCore’s higher beta indicates greater market volatility risk. Uranium Energy Corp. has negligible debt, reducing financial risk, whereas enCore carries slightly more leverage. Regulatory and environmental risks are inherent in uranium mining but manageable given US-centric operations. Uranium Energy’s strong Altman Z-Score suggests lower bankruptcy risk compared to enCore, which is in financial distress territory. Investors should weigh these risks carefully, prioritizing strong financial health and operational efficiency.
Which Stock to Choose?
Uranium Energy Corp. (UEC) shows a strong revenue growth of 29738% in 2025 but struggles with negative net margin (-131%) and ROE (-8.91%). Its debt levels are favorable with a low debt-to-assets ratio (0.21%), yet the overall financial ratios and income statement remain unfavorable. The company’s rating is very favorable despite weak profitability and a slightly unfavorable moat, indicating value destruction but improving ROIC.
enCore Energy Corp. (EU) experienced a 163% revenue increase in 2024 but faces persistent negative profitability metrics, including net margin (-105%) and ROE (-21.49%). Debt metrics are better than UEC’s, with moderate debt-to-equity scores and a low debt-to-assets ratio (5.2%). Its global financial ratios and income statement are unfavorable, and it holds a very unfavorable moat with declining ROIC. The rating is very favorable but reflects underlying financial weaknesses.
Considering the ratings and overall financial evaluations, UEC might appear more attractive to growth-oriented investors due to its strong recent revenue surge and improving profitability trend, despite unfavorable ratios. Conversely, EU could be more aligned with investors accepting higher risk and seeking potential value from a company with moderate leverage but deteriorating profitability. The choice largely depends on the investor’s risk tolerance and strategic focus.
Disclaimer: Investment carries a risk of loss of initial capital. The past performance is not a reliable indicator of future results. Be sure to understand risks before making an investment decision.
Go Further
I encourage you to read the complete analyses of Uranium Energy Corp. and enCore Energy Corp. to enhance your investment decisions: