In the evolving uranium sector, Ur-Energy Inc. (URG) and Uranium Royalty Corp. (UROY) stand out as compelling investment contenders. Both companies operate within the uranium industry but pursue distinct strategies: Ur-Energy focuses on direct mining operations in the U.S., while Uranium Royalty specializes in managing diverse uranium royalties across multiple regions. This article will analyze their market positions and innovation approaches to identify which offers the most promising opportunity for your portfolio.
Table of contents
Companies Overview
I will begin the comparison between Ur-Energy Inc. and Uranium Royalty Corp. by providing an overview of these two companies and their main differences.
Ur-Energy Inc. Overview
Ur-Energy Inc. focuses on the acquisition, exploration, development, and operation of uranium mineral properties primarily in the United States. Its flagship property, Lost Creek, comprises about 1,800 unpatented mining claims and three Wyoming mineral leases covering approximately 48,000 acres. Incorporated in 2004 and headquartered in Littleton, Colorado, Ur-Energy operates with around 101 full-time employees and is listed on the AMEX exchange.
Uranium Royalty Corp. Overview
Uranium Royalty Corp. operates as a pure-play uranium royalty company, managing a portfolio of geographically diversified uranium interests across North America and Namibia. Incorporated in 2017 and headquartered in Vancouver, Canada, it holds royalty interests in multiple uranium projects, including McArthur River and Cigar Lake in Canada and Lance in Wyoming. The company has 14 employees and trades on the NASDAQ Capital Market.
Key similarities and differences
Both companies operate within the uranium industry and are engaged in uranium-related assets, but their business models differ significantly. Ur-Energy is involved directly in uranium mining and operations, focusing on property development in the U.S., while Uranium Royalty Corp. focuses on acquiring and managing royalty interests across a broader geographic area. Additionally, Ur-Energy has a larger workforce and a longer operating history compared to the younger, smaller Uranium Royalty Corp.
Income Statement Comparison
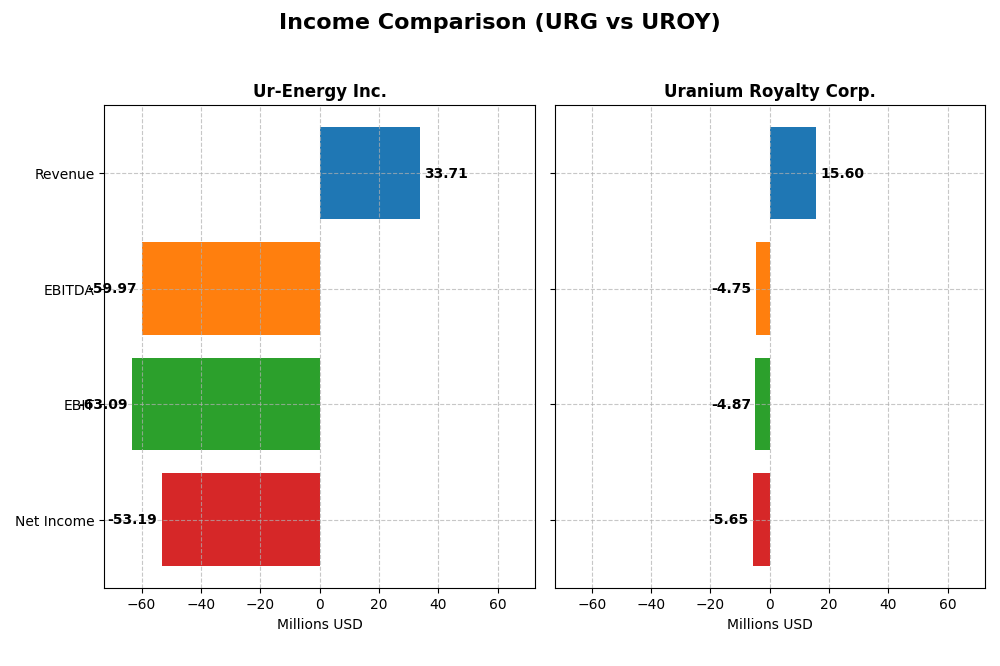
Below is a comparative summary of the 2024 fiscal year income statements for Ur-Energy Inc. and Uranium Royalty Corp., highlighting key financial metrics.
| Metric | Ur-Energy Inc. (URG) | Uranium Royalty Corp. (UROY) |
|---|---|---|
| Market Cap | 598M USD | 535M CAD |
| Revenue | 33.7M USD | 42.7M CAD |
| EBITDA | -60.0M USD | 7.79M CAD |
| EBIT | -63.1M USD | 7.77M CAD |
| Net Income | -53.2M USD | 9.78M CAD |
| EPS | -0.17 USD | 0.09 CAD |
| Fiscal Year | 2024 | 2024 |
Income Statement Interpretations
Ur-Energy Inc.
Ur-Energy Inc. showed strong revenue growth of 305.32% over 2020-2024 but reported consistent net losses with a declining net income trend of -259.75%. Margins remained unfavorable, with a gross margin of -26.62% and EBIT margin dropping to -187.17%. In 2024, revenue surged 90.66%, yet net income losses deepened, reflecting margin pressures despite improved net margin growth by 9%.
Uranium Royalty Corp.
Uranium Royalty Corp. experienced flat revenue growth over 2021-2025 but showed a declining net income trend of -310.75%. Its gross margin was neutral at 9.98%, though EBIT and net margins remained negative at -31.24% and -36.26%, respectively. In 2025, revenue fell sharply by 63.48%, accompanied by worsening profitability and margins, signaling operational challenges.
Which one has the stronger fundamentals?
Both companies face unfavorable overall income statement evaluations with net losses and weak margins. Ur-Energy Inc. benefits from notable revenue growth and some margin improvements recently, while Uranium Royalty Corp. struggles with declining revenue and deteriorating profitability. Neither has a clear fundamental advantage; both exhibit significant financial challenges.
Financial Ratios Comparison
Below is a comparison of key financial ratios for Ur-Energy Inc. (URG) and Uranium Royalty Corp. (UROY) based on the most recent fiscal year data available.
| Ratios | Ur-Energy Inc. (URG) 2024 | Uranium Royalty Corp. (UROY) 2025 |
|---|---|---|
| ROE | -40.1% | -1.92% |
| ROIC | -36.0% | -1.63% |
| P/E | -6.87 | -56.0 |
| P/B | 2.75 | 1.07 |
| Current Ratio | 5.99 | 233.5 |
| Quick Ratio | 4.91 | 233.5 |
| D/E (Debt-to-Equity) | 0.0093 | 0.00071 |
| Debt-to-Assets | 0.0064 | 0.00071 |
| Interest Coverage | 0 | -11.0 |
| Asset Turnover | 0.17 | 0.053 |
| Fixed Asset Turnover | 0 | 82.5 |
| Payout Ratio | 0 | 0 |
| Dividend Yield | 0 | 0 |
Interpretation of the Ratios
Ur-Energy Inc.
Ur-Energy’s financial ratios reveal significant weaknesses, including negative returns on equity (-40.05%) and invested capital (-36.01%), alongside an unfavorable net margin of -157.8%. Liquidity metrics show a high current ratio (5.99) that may indicate inefficient asset use. The company pays no dividends, likely reflecting ongoing losses and a focus on operational reinvestment.
Uranium Royalty Corp.
Uranium Royalty Corp. exhibits mixed ratio results with modestly negative returns on equity (-1.92%) and invested capital (-1.63%), and a high weighted average cost of capital (13.4%) signaling potential cost challenges. Its asset turnover is weak, but fixed asset turnover is strong (82.51). The company does not pay dividends, consistent with its reinvestment strategy and growth focus.
Which one has the best ratios?
Both companies show unfavorable overall ratios, each with 57.14% unfavorable metrics. Uranium Royalty Corp. holds a slight edge in favorable ratios (42.86% vs. 28.57% for Ur-Energy), notably in asset turnover and leverage measures. However, both suffer from poor profitability and no dividend yield, reflecting challenges in their financial performance.
Strategic Positioning
This section compares the strategic positioning of Ur-Energy Inc. and Uranium Royalty Corp., focusing on Market position, Key segments, and exposure to disruption:
Ur-Energy Inc.
- Operates 12 uranium projects in the US, facing industry competition.
- Focuses on uranium mineral acquisition, exploration, and development primarily in the US energy sector.
- No explicit data on technology disruption exposure provided, implying traditional uranium mining operations.
Uranium Royalty Corp.
- Holds geographically diverse uranium royalty interests in multiple projects across Canada, US, and Namibia.
- Pure-play uranium royalty company managing a broad portfolio of uranium interests worldwide.
- No explicit data on technology disruption exposure provided, focusing on royalty asset management.
Ur-Energy Inc. vs Uranium Royalty Corp. Positioning
Ur-Energy has a concentrated operational model with physical uranium projects mainly in the US, while Uranium Royalty Corp. follows a diversified royalty portfolio strategy across multiple regions. Ur-Energy’s approach may involve higher operational risks; Uranium Royalty Corp. benefits from geographic and asset diversity but with fewer employees.
Which has the best competitive advantage?
Both companies show very unfavorable economic moats with declining ROICs below WACC, indicating value destruction and weakening profitability, thus neither currently demonstrates a strong sustainable competitive advantage.
Stock Comparison
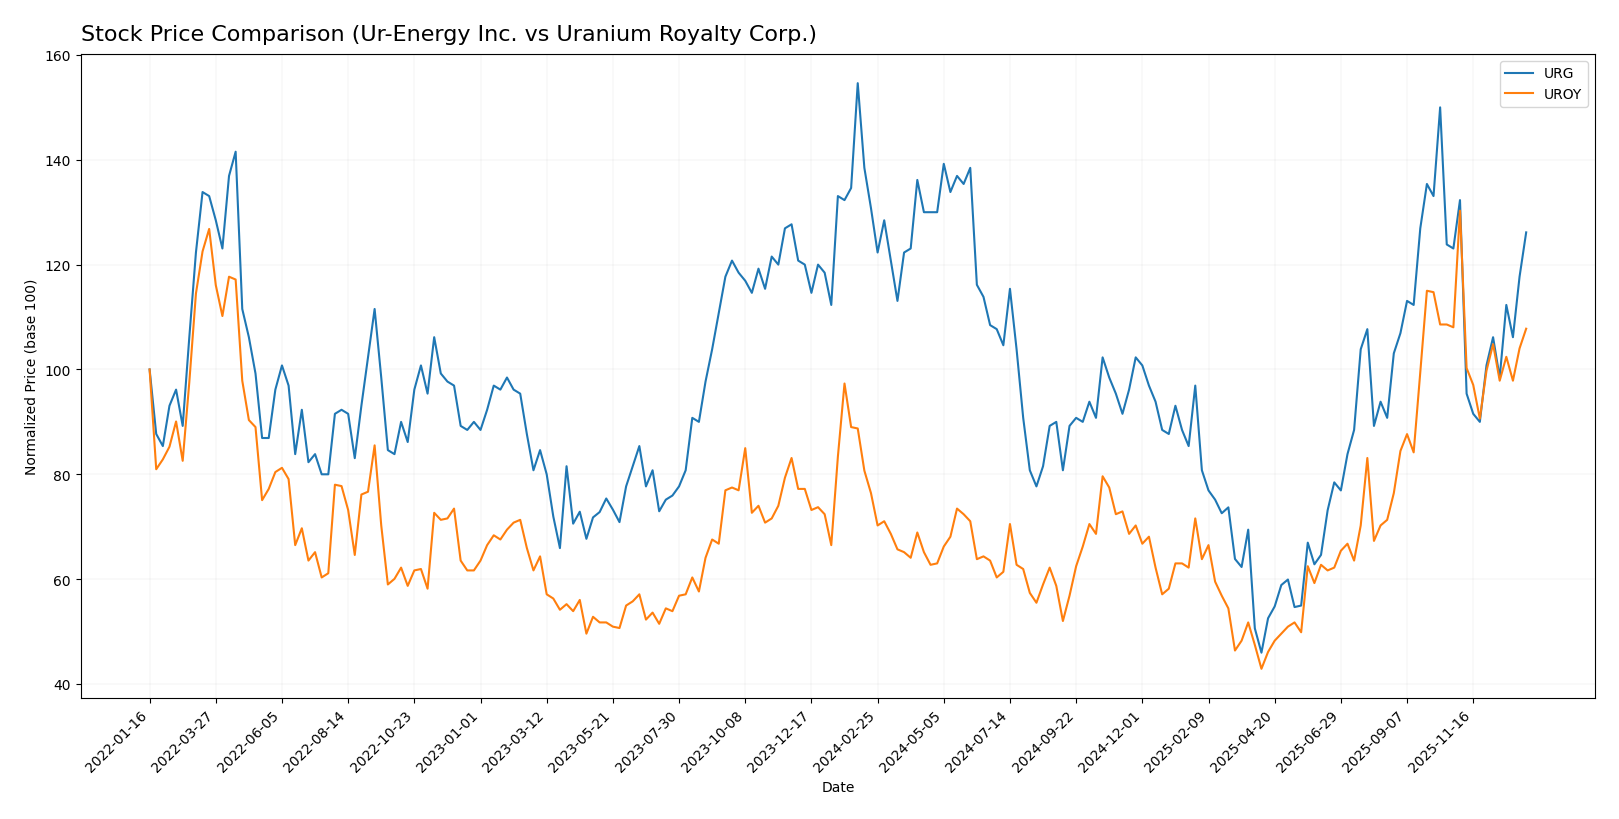
The stock price movements of Ur-Energy Inc. (URG) and Uranium Royalty Corp. (UROY) over the past 12 months reveal contrasting trends, with UROY showing significant gains while URG experiences a moderate decline, reflecting differing market dynamics and investor sentiment.
Trend Analysis
Ur-Energy Inc. (URG) displayed a bearish trend over the past year with a price decrease of 3.53%, accompanied by accelerating decline and moderate volatility (std deviation 0.31). The stock ranged between 0.6 and 1.95.
Uranium Royalty Corp. (UROY) showed a strong bullish trend with a 41.05% price increase over the same period, though the upward momentum decelerated. Volatility was higher (std deviation 0.67) with prices fluctuating between 1.6 and 4.86.
Comparing the two, UROY delivered the highest market performance with substantial gains, while URG faced a modest downturn despite recent minor recovery.
Target Prices
The target price consensus for Ur-Energy Inc. suggests moderate upside potential.
| Company | Target High | Target Low | Consensus |
|---|---|---|---|
| Ur-Energy Inc. | 2.60 | 2.15 | 2.38 |
Analysts expect Ur-Energy’s price to rise from the current 1.64 USD towards a consensus target of 2.38 USD, indicating potential appreciation. No verified target price data is available for Uranium Royalty Corp., limiting precise forecast insights.
Analyst Opinions Comparison
This section compares analysts’ ratings and grades for Ur-Energy Inc. and Uranium Royalty Corp.:
Rating Comparison
Ur-Energy Inc. Rating
- Rating: D+, categorized as Very Favorable
- Discounted Cash Flow Score: 1, rated Very Unfavorable
- ROE Score: 1, rated Very Unfavorable
- ROA Score: 1, rated Very Unfavorable
- Debt To Equity Score: 2, rated Moderate
- Overall Score: 1, rated Very Unfavorable
Uranium Royalty Corp. Rating
- Rating: C-, categorized as Very Favorable
- Discounted Cash Flow Score: 1, rated Very Unfavorable
- ROE Score: 1, rated Very Unfavorable
- ROA Score: 1, rated Very Unfavorable
- Debt To Equity Score: 4, rated Favorable
- Overall Score: 1, rated Very Unfavorable
Which one is the best rated?
Uranium Royalty Corp. holds a higher rating of C- compared to Ur-Energy’s D+, and it has a more favorable debt-to-equity score. Both have identical very unfavorable scores on other financial metrics.
Scores Comparison
The following table compares the Altman Z-Score and Piotroski Score of Ur-Energy Inc. and Uranium Royalty Corp.:
URG Scores
- Altman Z-Score: 0.60, indicating financial distress zone
- Piotroski Score: 2, categorized as very weak
UROY Scores
- Altman Z-Score: 388.37, indicating a safe financial zone
- Piotroski Score: 3, categorized as very weak
Which company has the best scores?
Based strictly on the provided data, UROY shows a significantly higher Altman Z-Score in the safe zone compared to URG’s distress zone. Both have very weak Piotroski Scores, with UROY slightly higher at 3 versus 2 for URG.
Grades Comparison
Here is the recent grades comparison for Ur-Energy Inc. and Uranium Royalty Corp.:
Ur-Energy Inc. Grades
This table summarizes the latest grades published by recognized grading companies for Ur-Energy Inc.
| Grading Company | Action | New Grade | Date |
|---|---|---|---|
| HC Wainwright & Co. | Maintain | Buy | 2025-11-04 |
| B. Riley Securities | Maintain | Buy | 2025-09-25 |
| Roth Capital | Maintain | Buy | 2025-09-23 |
| HC Wainwright & Co. | Maintain | Buy | 2025-04-15 |
| HC Wainwright & Co. | Maintain | Buy | 2025-02-11 |
| Roth MKM | Maintain | Buy | 2024-10-23 |
| B. Riley Securities | Maintain | Buy | 2024-08-20 |
| HC Wainwright & Co. | Maintain | Buy | 2024-08-14 |
| HC Wainwright & Co. | Maintain | Buy | 2024-07-17 |
| Roth MKM | Maintain | Buy | 2024-05-09 |
The overall grades for Ur-Energy Inc. remain consistently positive, with multiple repeated “Buy” ratings from respected firms over the last two years.
Uranium Royalty Corp. Grades
This table presents the recent grades from official grading companies for Uranium Royalty Corp.
| Grading Company | Action | New Grade | Date |
|---|---|---|---|
| HC Wainwright & Co. | Maintain | Buy | 2025-04-22 |
| HC Wainwright & Co. | Maintain | Buy | 2024-12-19 |
| HC Wainwright & Co. | Maintain | Buy | 2024-09-17 |
| HC Wainwright & Co. | Maintain | Buy | 2024-06-17 |
| HC Wainwright & Co. | Maintain | Buy | 2024-03-11 |
| HC Wainwright & Co. | Maintain | Buy | 2022-01-03 |
| HC Wainwright & Co. | Maintain | Buy | 2021-09-29 |
| HC Wainwright & Co. | Maintain | Buy | 2021-09-28 |
| HC Wainwright & Co. | Maintain | Buy | 2021-07-02 |
| HC Wainwright & Co. | Maintain | Buy | 2021-07-01 |
Grades for Uranium Royalty Corp. also remain stable and positive, with a consistent “Buy” rating maintained by HC Wainwright & Co. over several years.
Which company has the best grades?
Both Ur-Energy Inc. and Uranium Royalty Corp. have consistently received “Buy” ratings from recognized grading firms. Ur-Energy Inc. benefits from a broader range of grading companies, suggesting a wider analyst coverage, while Uranium Royalty Corp. has a long-standing positive rating from a single reputable source. This may influence investors in terms of perceived analyst consensus depth and reliability.
Strengths and Weaknesses
The table below summarizes the key strengths and weaknesses of Ur-Energy Inc. (URG) and Uranium Royalty Corp. (UROY) based on diversification, profitability, innovation, global presence, and market share as of 2026.
| Criterion | Ur-Energy Inc. (URG) | Uranium Royalty Corp. (UROY) |
|---|---|---|
| Diversification | Limited product and revenue diversification | Primarily focused on uranium royalties, limited diversification |
| Profitability | Negative profitability; declining ROIC and net margin | Negative profitability; slight improvement but still declining ROIC |
| Innovation | Limited innovation focus in recent years | Moderate innovation in royalty structures and financing |
| Global presence | Moderate, focused on North American markets | Stronger global reach due to royalty agreements worldwide |
| Market Share | Small producer with limited market share | Niche player with growing market presence in uranium royalties |
Key takeaways: Both companies face challenges with profitability and declining returns on invested capital, signaling value destruction. UROY benefits from a stronger global presence and innovative royalty model, while URG remains more traditional with limited diversification. Investors should approach cautiously, prioritizing risk management.
Risk Analysis
Below is a table summarizing key risks for Ur-Energy Inc. (URG) and Uranium Royalty Corp. (UROY) based on the most recent data from 2025-2026.
| Metric | Ur-Energy Inc. (URG) | Uranium Royalty Corp. (UROY) |
|---|---|---|
| Market Risk | Moderate (Beta 1.04, price range $0.55-$2.35) | High (Beta 2.03, price range $1.43-$5.37) |
| Debt level | Very low (Debt/Equity 0.01, Debt/Assets 0.64%) | Negligible (Debt/Equity 0.00, Debt/Assets 0.07%) |
| Regulatory Risk | High (US uranium mining regulations, environmental permits) | Moderate (Royalties linked to multiple jurisdictions with varying regulations) |
| Operational Risk | High (12 projects, with flagship Lost Creek in Wyoming, operational challenges) | Low (Royalty model reduces operational liabilities) |
| Environmental Risk | Moderate (Mining impact in sensitive US regions) | Low (No direct mining operations) |
| Geopolitical Risk | Moderate (US domestic focus, but uranium market sensitive to global policies) | High (Exposure to Canadian and Namibian projects, subject to geopolitical shifts) |
Synthesis: Ur-Energy faces substantial operational and regulatory risks due to its active mining operations and environmental impact, with moderate market volatility. Uranium Royalty Corp. benefits from a royalty business model reducing operational risks but is more exposed to geopolitical risk due to its global portfolio. Both companies show unfavorable profitability and financial health indicators, warranting cautious risk management.
Which Stock to Choose?
Ur-Energy Inc. (URG) shows a favorable revenue growth of 90.66% in the past year and 305.32% over five years but suffers from negative profitability with a net margin of -157.8% and declining returns on equity and invested capital. Its financial ratios reveal a mostly unfavorable profile, including low asset turnover and interest coverage, though its debt metrics are favorable. The company is rated D+ with a very unfavorable overall score, reflecting significant financial distress and value destruction.
Uranium Royalty Corp. (UROY) has experienced a revenue decline of 63.48% in the last year and no growth over the longer term, with negative profitability indicators including a net margin of -36.26% and slightly negative returns on equity and invested capital. Its financial ratios are mixed, with some favorable debt and turnover measures but overall unfavorable profitability and coverage, resulting in a C- rating and a financial profile also indicating value destruction despite a safe zone Altman Z-Score.
For investors seeking growth exposure, Ur-Energy’s strong recent revenue gains might appear attractive despite its financial weaknesses, while Uranium Royalty’s steadier but declining income and better solvency ratios could be more suitable for those prioritizing balance sheet strength. Both companies show unfavorable profitability and value metrics, implying that risk tolerance and investment strategy will heavily influence which stock might be deemed more favorable.
Disclaimer: Investment carries a risk of loss of initial capital. The past performance is not a reliable indicator of future results. Be sure to understand risks before making an investment decision.
Go Further
I encourage you to read the complete analyses of Ur-Energy Inc. and Uranium Royalty Corp. to enhance your investment decisions: