NexGen Energy Ltd. (NXE) and Ur-Energy Inc. (URG) are two prominent players in the uranium industry, each focusing on uranium exploration and development in North America. While NexGen operates primarily in Canada’s Athabasca Basin, Ur-Energy’s assets are concentrated in the United States’ Great Divide Basin. Their shared commitment to innovation and resource development makes them compelling candidates for comparison. In this article, I will analyze both companies to help you decide which uranium investment is most promising for your portfolio.
Table of contents
Companies Overview
I will begin the comparison between NexGen Energy Ltd. and Ur-Energy Inc. by providing an overview of these two companies and their main differences.
NexGen Energy Ltd. Overview
NexGen Energy Ltd. is an exploration and development stage company focused on uranium properties in Canada. Its main asset is the Rook I project, covering 35,065 hectares in the Athabasca Basin of Saskatchewan. With a market capitalization of approximately 7B USD and 133 employees, NexGen is positioned as a significant player in the uranium industry. The company is headquartered in Vancouver and listed on the NYSE.
Ur-Energy Inc. Overview
Ur-Energy Inc. operates in the acquisition, exploration, development, and operation of uranium mineral properties across 12 projects in the United States. Its flagship Lost Creek project spans about 48,000 acres in Wyoming’s Great Divide Basin. Ur-Energy, with a market cap near 600M USD and 101 employees, is listed on the AMEX and headquartered in Littleton, Colorado, focusing on steady uranium production.
Key similarities and differences
Both NexGen and Ur-Energy operate within the uranium industry and focus on exploration and development of mineral properties. NexGen is concentrated in Canada with a larger market cap and asset size, whereas Ur-Energy operates in the U.S. with a smaller scale but active production. NexGen emphasizes a single large project, while Ur-Energy manages multiple sites, reflecting differing business models within the same sector.
Income Statement Comparison
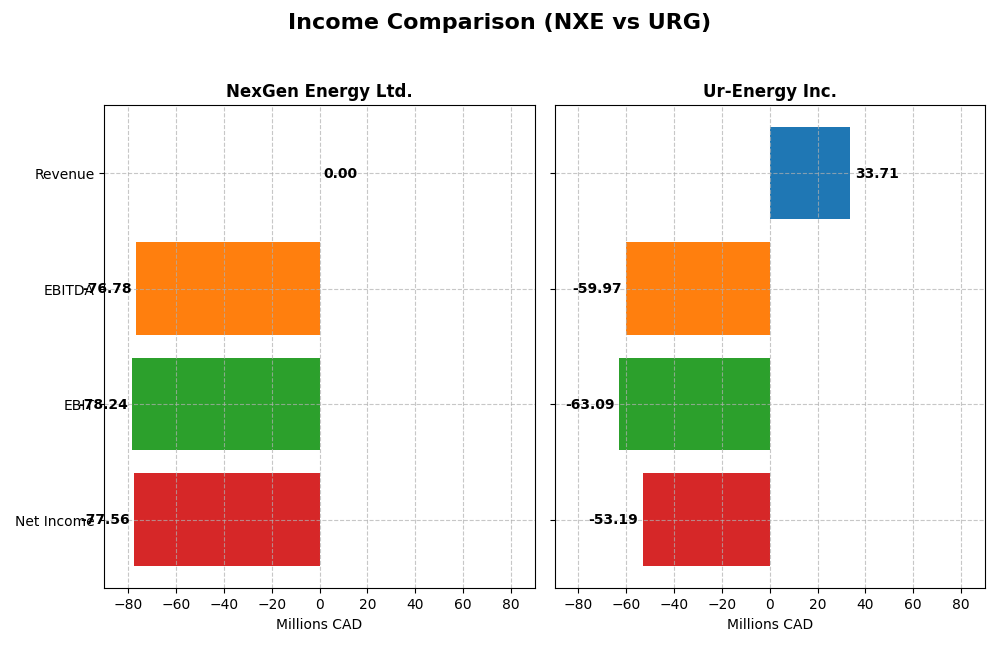
The table below presents a side-by-side comparison of the latest fiscal year income statement metrics for NexGen Energy Ltd. and Ur-Energy Inc., reflecting their financial performance in 2024.
| Metric | NexGen Energy Ltd. (NXE) | Ur-Energy Inc. (URG) |
|---|---|---|
| Market Cap | 7.0B CAD | 598M USD |
| Revenue | 0 CAD | 33.7M USD |
| EBITDA | -76.8M CAD | -60.0M USD |
| EBIT | -78.2M CAD | -63.1M USD |
| Net Income | -77.6M CAD | -53.2M USD |
| EPS | -0.14 CAD | -0.17 USD |
| Fiscal Year | 2024 | 2024 |
Income Statement Interpretations
NexGen Energy Ltd.
NexGen Energy Ltd. shows zero revenue across the recent years with net income fluctuating from a significant loss in 2021 (-119M CAD) to a profit in 2023 (81M CAD), then back to a loss in 2024 (-78M CAD). Margins remain unfavorable due to the absence of gross profit and recurring operating losses. The 2024 year saw a decline in EBIT and EPS, indicating worsening profitability.
Ur-Energy Inc.
Ur-Energy Inc. experienced revenue growth over the period, jumping from 8.3M USD in 2020 to 33.7M USD in 2024, yet it remained unprofitable with net losses worsening in absolute terms from -15M USD to -53M USD. Gross and EBIT margins stayed negative, although revenue growth and operating expense control improved in 2024. EPS declined, reflecting ongoing challenges in achieving profitability.
Which one has the stronger fundamentals?
Both companies demonstrate unfavorable income statements with persistent losses and negative margins. NexGen shows some net income recovery in 2023 but lacks revenue generation, while Ur-Energy delivers revenue growth but deepening net losses. NexGen’s higher market cap contrasts Ur-Energy’s scaling revenue, yet both face significant earnings volatility and profitability risk.
Financial Ratios Comparison
The table below compares key financial ratios for NexGen Energy Ltd. (NXE) and Ur-Energy Inc. (URG) based on their most recent fiscal year data from 2024.
| Ratios | NexGen Energy Ltd. (NXE) | Ur-Energy Inc. (URG) |
|---|---|---|
| ROE | -6.58% | -40.05% |
| ROIC | -4.39% | -36.01% |
| P/E | -67.80 | -6.87 |
| P/B | 4.46 | 2.75 |
| Current Ratio | 1.03 | 5.99 |
| Quick Ratio | 1.03 | 4.91 |
| D/E (Debt-to-Equity) | 0.39 | 0.01 |
| Debt-to-Assets | 27.56% | 0.64% |
| Interest Coverage | -2.33 | 0 |
| Asset Turnover | 0 | 0.17 |
| Fixed Asset Turnover | 0 | 0 |
| Payout Ratio | 0 | 0 |
| Dividend Yield | 0 | 0 |
Interpretation of the Ratios
NexGen Energy Ltd.
NexGen Energy Ltd. shows mostly unfavorable financial ratios in 2024, with negative returns on equity (-6.58%) and invested capital (-4.39%), and a poor net margin of 0%. While the debt-to-equity ratio (0.39) and quick ratio (1.03) are favorable, the company has weak asset turnover and interest coverage ratios. NexGen does not pay dividends, reflecting its exploration and development stage focus.
Ur-Energy Inc.
Ur-Energy Inc. also presents unfavorable profitability ratios in 2024, including a net margin of -157.8% and a return on equity of -40.05%. Despite this, it benefits from a very low debt-to-equity ratio (0.01) and a strong quick ratio (4.91). Its current ratio is high but considered unfavorable due to potential inefficiency. Like NexGen, Ur-Energy does not pay dividends, likely due to ongoing development and reinvestment priorities.
Which one has the best ratios?
Both companies have unfavorable global ratio evaluations for 2024, with NexGen showing slightly more concerns in profitability and interest coverage. Ur-Energy’s lower debt levels and stronger liquidity ratios contrast with its deeply negative returns. Neither company pays dividends, consistent with their development stages, making the choice dependent on investor tolerance for risk and growth focus.
Strategic Positioning
This section compares the strategic positioning of NexGen Energy Ltd. and Ur-Energy Inc., including market position, key segments, and exposure to technological disruption:
NexGen Energy Ltd.
- Larger market cap of 7B USD, faces competitive pressure in uranium exploration in Canada.
- Focused on exploration and development of a single large uranium project in Canada’s Athabasca Basin.
- No explicit data on technological disruption exposure provided.
Ur-Energy Inc.
- Smaller market cap of 600M USD, operates under competitive pressures in US uranium mining.
- Operates multiple uranium projects across the US, with flagship Lost Creek in Wyoming.
- No explicit data on technological disruption exposure provided.
NexGen Energy Ltd. vs Ur-Energy Inc. Positioning
NexGen’s strategy is concentrated on a single major uranium asset in Canada, providing scale but geographic concentration. Ur-Energy has a more diversified US project portfolio, potentially reducing single-asset risks but with smaller scale and market cap.
Which has the best competitive advantage?
Both companies are currently shedding value based on ROIC vs WACC metrics. NexGen shows improving profitability trends, while Ur-Energy faces declining profitability, indicating NexGen may have a slight edge in competitive advantage durability.
Stock Comparison
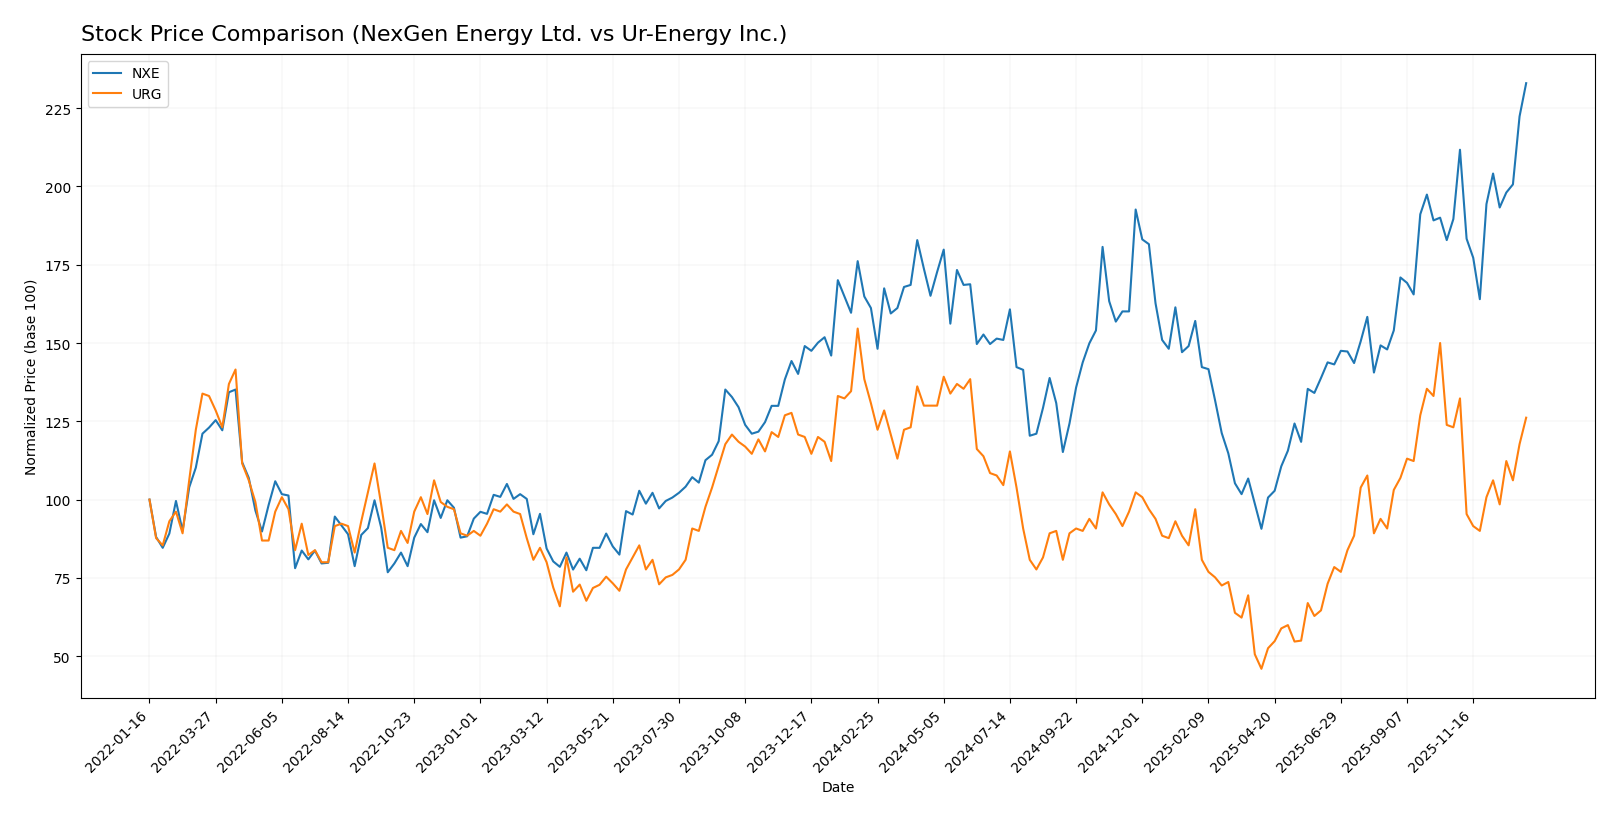
The stock prices of NexGen Energy Ltd. (NXE) and Ur-Energy Inc. (URG) exhibited contrasting dynamics over the past 12 months, with NXE showing strong upward momentum and URG facing downward pressure despite recent modest gains.
Trend Analysis
NexGen Energy Ltd. (NXE) demonstrated a bullish trend over the past year with a 44.55% price increase and accelerating momentum. The stock ranged between 4.18 and 10.74, with a moderate 1.3 std deviation indicating stable volatility.
Ur-Energy Inc. (URG) experienced a bearish trend over the same period, declining 3.53% with accelerating downward pressure. The price fluctuated from 0.6 to 1.95, showing lower volatility at 0.31 std deviation, and a slight recent recovery of 2.5%.
Comparing both stocks, NXE delivered the highest market performance with a significant 44.55% gain, outperforming URG’s overall loss despite its recent minor rebound.
Target Prices
Analysts provide a clear target price consensus for Ur-Energy Inc., while NexGen Energy Ltd. lacks verified data.
| Company | Target High | Target Low | Consensus |
|---|---|---|---|
| Ur-Energy Inc. | 2.60 | 2.15 | 2.38 |
For Ur-Energy Inc., the consensus target price of 2.38 USD suggests upside potential compared to the current price of 1.64 USD, indicating moderate analyst optimism. No verified target price data is available for NexGen Energy Ltd.
Analyst Opinions Comparison
This section compares analysts’ ratings and financial scores for NexGen Energy Ltd. and Ur-Energy Inc.:
Rating Comparison
NexGen Energy Ltd. Rating
- Rating: D+, classified as Very Favorable
- Discounted Cash Flow Score: 2, Moderate valuation outlook
- ROE Score: 1, Very Unfavorable return on equity
- ROA Score: 1, Very Unfavorable asset utilization
- Debt To Equity Score: 1, Very Unfavorable financial risk
- Overall Score: 1, Very Unfavorable financial standing
Ur-Energy Inc. Rating
- Rating: D+, classified as Very Favorable
- Discounted Cash Flow Score: 1, Very Unfavorable
- ROE Score: 1, Very Unfavorable return on equity
- ROA Score: 1, Very Unfavorable asset utilization
- Debt To Equity Score: 2, Moderate financial risk
- Overall Score: 1, Very Unfavorable financial standing
Which one is the best rated?
Both companies share the same overall rating of D+ with a very unfavorable overall score of 1. NexGen Energy has a better discounted cash flow score, while Ur-Energy scores better on debt-to-equity, indicating a moderate financial risk profile.
Scores Comparison
Here is a comparison of the Altman Z-Score and Piotroski Score for both companies:
NexGen Energy Ltd. Scores
- Altman Z-Score: 6.89, indicating a safe zone with low bankruptcy risk.
- Piotroski Score: 1, categorized as very weak financial strength.
Ur-Energy Inc. Scores
- Altman Z-Score: 0.60, indicating distress zone with high bankruptcy risk.
- Piotroski Score: 2, also categorized as very weak financial strength.
Which company has the best scores?
NexGen Energy shows a much stronger Altman Z-Score, signaling financial safety, while both have very weak Piotroski Scores. Overall, NexGen’s scores are better based on provided data.
Grades Comparison
The following presents the recent grades and ratings for NexGen Energy Ltd. and Ur-Energy Inc.:
NexGen Energy Ltd. Grades
The table below summarizes available grades from reliable grading companies for NexGen Energy Ltd.:
| Grading Company | Action | New Grade | Date |
|---|---|---|---|
| No reliable grades available | – | – | – |
No reliable individual grades are available for NexGen Energy Ltd., though consensus data indicates a “Buy” rating from 4 analysts.
Ur-Energy Inc. Grades
The following table shows recent grades from established grading companies for Ur-Energy Inc.:
| Grading Company | Action | New Grade | Date |
|---|---|---|---|
| HC Wainwright & Co. | Maintain | Buy | 2025-11-04 |
| B. Riley Securities | Maintain | Buy | 2025-09-25 |
| Roth Capital | Maintain | Buy | 2025-09-23 |
| HC Wainwright & Co. | Maintain | Buy | 2025-04-15 |
| HC Wainwright & Co. | Maintain | Buy | 2025-02-11 |
| Roth MKM | Maintain | Buy | 2024-10-23 |
| B. Riley Securities | Maintain | Buy | 2024-08-20 |
| HC Wainwright & Co. | Maintain | Buy | 2024-08-14 |
| HC Wainwright & Co. | Maintain | Buy | 2024-07-17 |
| Roth MKM | Maintain | Buy | 2024-05-09 |
All recent ratings for Ur-Energy Inc. consistently maintain a “Buy” grade, reflecting a stable positive outlook by multiple reliable firms.
Which company has the best grades?
Ur-Energy Inc. has received a larger volume of consistent “Buy” grades from reputable firms, whereas NexGen Energy Ltd. lacks individual firm grades but holds a consensus “Buy.” Investors may view Ur-Energy’s detailed and steady buy ratings as stronger validation of its market position.
Strengths and Weaknesses
Below is a comparison of key strengths and weaknesses for NexGen Energy Ltd. (NXE) and Ur-Energy Inc. (URG), based on their recent financial and operational data.
| Criterion | NexGen Energy Ltd. (NXE) | Ur-Energy Inc. (URG) |
|---|---|---|
| Diversification | Limited diversification, focused on uranium exploration | Limited diversification, focused on uranium mining |
| Profitability | Negative ROIC (-4.39%), net margin 0%, value destroying but improving profitability | Negative ROIC (-36%), net margin -157.8%, declining profitability, value destroying |
| Innovation | Moderate innovation with growing ROIC trend | Weak innovation, reflected in declining ROIC |
| Global presence | Moderate presence mainly in Canada | Limited global footprint, primarily US-based |
| Market Share | Small to mid-tier player in uranium sector | Small player with limited market share |
Key takeaways: Both companies are currently value destroyers, with NXE showing signs of improving profitability while URG faces worsening financial performance. Neither has broad diversification, and both operate in niche uranium markets, implying higher risk but potential for growth with improved management and market conditions.
Risk Analysis
The table below summarizes key risks for NexGen Energy Ltd. (NXE) and Ur-Energy Inc. (URG) based on their latest financial and operational profiles from 2024.
| Metric | NexGen Energy Ltd. (NXE) | Ur-Energy Inc. (URG) |
|---|---|---|
| Market Risk | High beta (1.856) indicates significant price volatility. | Moderate beta (1.039) suggests lower volatility. |
| Debt level | Moderate debt-to-equity ratio (0.39), favorable. | Very low debt-to-equity ratio (0.01), favorable. |
| Regulatory Risk | Exposure to Canadian uranium mining regulations. | Subject to U.S. mining regulations, including environmental laws. |
| Operational Risk | Exploration and development stage, no current production, negative margins. | Active production but negative margins and low asset turnover. |
| Environmental Risk | Uranium mining impacts in Athabasca Basin, Canada. | Environmental concerns in Wyoming’s Great Divide Basin. |
| Geopolitical Risk | Moderate, linked to Canadian resource policies and uranium demand. | Moderate, influenced by U.S. energy policies and international uranium markets. |
The most significant risks are operational and market-related. NXE faces high volatility and is still in development with unfavorable profitability metrics, posing a high operational risk. URG, while operational, suffers from severe negative margins and a distressed financial position, as indicated by its Altman Z-Score in the distress zone. Both companies show environmental and regulatory risks inherent to uranium mining, but financial instability and market fluctuations are the most impactful factors to monitor closely.
Which Stock to Choose?
NexGen Energy Ltd. (NXE) shows stable income with unfavorable margins and profitability ratios, yet its debt levels are manageable and some liquidity metrics are favorable. The company is rated very favorably overall despite a largely unfavorable ratio profile and shedding value, though its ROIC trend is improving.
Ur-Energy Inc. (URG) reports mixed income growth with unfavorable profitability and financial ratios, including high net debt to EBITDA and low interest coverage. Its rating is also very favorable, but the company is shedding value with a declining ROIC trend and displays financial distress signals.
Investors prioritizing improving profitability and a slightly favorable moat might view NXE as more appealing, while those accepting higher risk and focusing on recent revenue growth could find URG’s profile more fitting. Both stocks present significant challenges, suggesting cautious interpretation of their ratings and financial health.
Disclaimer: Investment carries a risk of loss of initial capital. The past performance is not a reliable indicator of future results. Be sure to understand risks before making an investment decision.
Go Further
I encourage you to read the complete analyses of NexGen Energy Ltd. and Ur-Energy Inc. to enhance your investment decisions: