In the evolving uranium sector, Denison Mines Corp. (DNN) and Ur-Energy Inc. (URG) stand out as key players advancing nuclear energy resources. Both companies focus on uranium acquisition and development, yet differ in geographic presence and project scale, reflecting distinct innovation strategies. This comparison explores their market positions and growth potential to help investors identify which stock might best complement their portfolios in 2026. Let’s dive into their core strengths and risks to find the most compelling investment opportunity.
Table of contents
Companies Overview
I will begin the comparison between Denison Mines Corp. and Ur-Energy Inc. by providing an overview of these two companies and their main differences.
Denison Mines Corp. Overview
Denison Mines Corp. focuses on the acquisition, exploration, development, extraction, processing, and selling of uranium properties primarily in Canada. Its flagship asset is the Wheeler River uranium project in the Athabasca Basin, where it holds a 95% interest. Founded in 1997 and headquartered in Toronto, Denison plays a significant role in the uranium sector with a market capitalization near 3B USD.
Ur-Energy Inc. Overview
Ur-Energy Inc. engages in acquisition, exploration, development, and operation of uranium mineral properties in the United States. It holds interests in 12 projects, with its main property being Lost Creek in Wyoming’s Great Divide Basin. Incorporated in 2004 and based in Littleton, Colorado, Ur-Energy has a market cap of about 600M USD, reflecting its focused presence in the US uranium market.
Key similarities and differences
Both Denison and Ur-Energy operate in the uranium industry within the energy sector, focusing on exploration and development of uranium assets. The key similarity lies in their core business of uranium mining and processing. However, Denison’s operations are concentrated in Canada with a larger market cap and fewer employees, while Ur-Energy’s projects spread across multiple US sites with a smaller market capitalization and a relatively larger workforce.
Income Statement Comparison
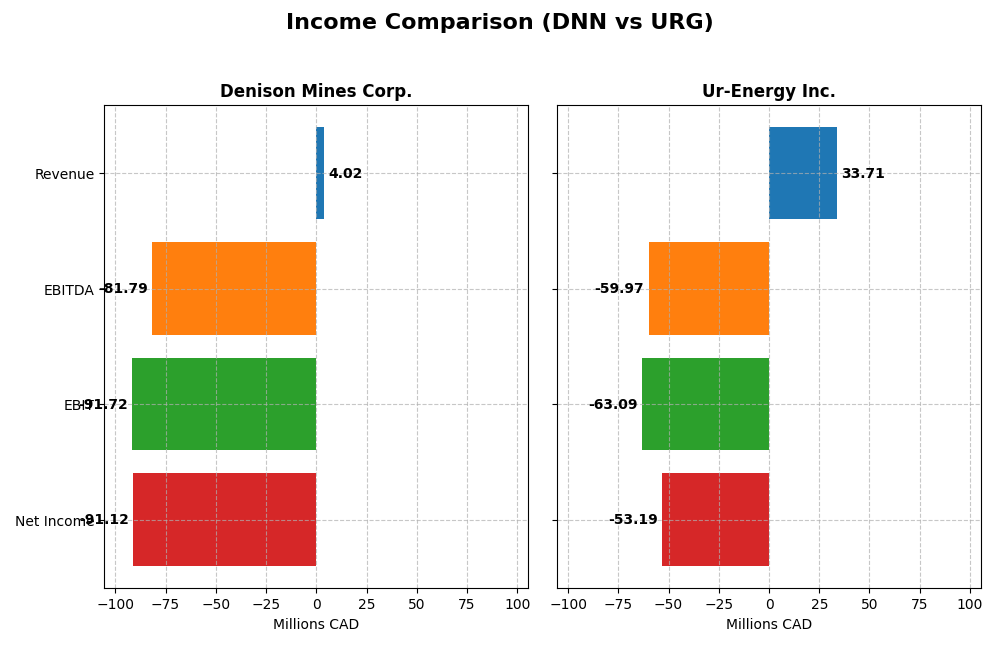
This table presents a side-by-side comparison of key income statement metrics for Denison Mines Corp. and Ur-Energy Inc. for the fiscal year 2024, highlighting their financial performance.
| Metric | Denison Mines Corp. (DNN) | Ur-Energy Inc. (URG) |
|---|---|---|
| Market Cap | 2.97B CAD | 598M USD |
| Revenue | 4.02M CAD | 33.7M USD |
| EBITDA | -81.8M CAD | -59.97M USD |
| EBIT | -91.7M CAD | -63.1M USD |
| Net Income | -91.1M CAD | -53.2M USD |
| EPS | -0.10 CAD | -0.17 USD |
| Fiscal Year | 2024 | 2024 |
Income Statement Interpretations
Denison Mines Corp.
Denison Mines showed a declining revenue trend from 2020 to 2024, with a sharp drop of 72.11% over the period, culminating in CAD 4.0M in 2024. Net income suffered a substantial deterioration, falling 459.6% overall to a loss of CAD 91.1M in 2024. Margins weakened significantly, with gross and net margins turning deeply negative. The latest year saw revenue growth of 116.87% but worsened net margin and EPS, signaling financial strain despite top-line improvement.
Ur-Energy Inc.
Ur-Energy’s revenue surged by 305.32% over five years, reaching USD 33.7M in 2024, with a 90.66% increase in the last year. However, the company posted a net loss of USD 53.2M in 2024, reflecting persistent unprofitability and negative margins. Gross margin remained unfavorable, and EBIT margin stayed deeply negative. Despite net margin growth improving by 9% last year, EPS declined, indicating profitability challenges amid revenue gains.
Which one has the stronger fundamentals?
Both companies face unfavorable overall income statement evaluations with negative margins and net losses. Denison Mines experienced sharper declines in net income and margins, despite recent revenue growth. Ur-Energy posted stronger revenue growth over the period and some positive margin trends but still delivered substantial losses. While neither shows robust profitability, Ur-Energy’s revenue expansion and margin improvement suggest relatively stronger fundamental momentum than Denison Mines.
Financial Ratios Comparison
The table below presents the most recent key financial ratios for Denison Mines Corp. and Ur-Energy Inc. as of fiscal year 2024, providing a snapshot of their profitability, liquidity, valuation, and leverage metrics.
| Ratios | Denison Mines Corp. (DNN) | Ur-Energy Inc. (URG) |
|---|---|---|
| ROE | -16.1% | -40.1% |
| ROIC | -10.0% | -36.0% |
| P/E | -25.3 | -6.87 |
| P/B | 4.09 | 2.75 |
| Current Ratio | 3.65 | 5.99 |
| Quick Ratio | 3.54 | 4.91 |
| D/E | 0 | 0.0093 |
| Debt-to-Assets | 0 | 0.0064 |
| Interest Coverage | -586.3 | 0 |
| Asset Turnover | 0.0061 | 0.174 |
| Fixed Asset Turnover | 0.0155 | 0 |
| Payout ratio | 0 | 0 |
| Dividend yield | 0 | 0 |
Interpretation of the Ratios
Denison Mines Corp.
Denison Mines shows mostly unfavorable financial ratios for 2024, including a deeply negative net margin (-2264.95%) and return on equity (-16.15%), reflecting weak profitability and efficiency. Its zero debt level and favorable quick ratio (3.54) are positives, but high price-to-book (4.09) and poor interest coverage (-849.24) raise concerns. The company pays no dividend, likely due to ongoing losses and reinvestment focus.
Ur-Energy Inc.
Ur-Energy’s 2024 ratios also skew unfavorable, with negative net margin (-157.8%) and return on equity (-40.05%), indicating significant operational challenges. The company maintains low debt and a strong quick ratio (4.91), though current ratio is marked unfavorable. Its price-to-book (2.75) is neutral. Ur-Energy does not pay dividends, suggesting a reinvestment strategy amid losses and growth prioritization.
Which one has the best ratios?
Both Denison Mines and Ur-Energy have predominantly unfavorable ratios, with similar proportions of positive metrics (28.57%) but Denison’s higher price-to-book and worse interest coverage may weigh more heavily. Ur-Energy’s neutral rating on price-to-book and lower debt-to-assets ratio are relative strengths. Overall, neither company presents a distinctly superior ratio profile in 2024.
Strategic Positioning
This section compares the strategic positioning of Denison Mines Corp. and Ur-Energy Inc., focusing on market position, key segments, and exposure to disruption:
Denison Mines Corp.
- Larger market cap at $2.97B, facing competitive uranium sector
- Focuses on uranium properties in Canada, flagship Wheeler River project
- No explicit indication of technological disruption exposure
Ur-Energy Inc.
- Smaller market cap at $598M, operating in a competitive niche
- Operates uranium projects in the US, key asset Lost Creek site
- No explicit indication of technological disruption exposure
Denison Mines Corp. vs Ur-Energy Inc. Positioning
Denison has a more concentrated focus on Canadian uranium assets, while Ur-Energy operates multiple US projects, reflecting a somewhat broader geographic exposure. Denison’s larger scale contrasts with Ur-Energy’s smaller market presence, both facing similar industry pressures.
Which has the best competitive advantage?
Both companies are shedding value with negative ROIC versus WACC, but Denison’s stable ROIC trend is less concerning than Ur-Energy’s steeply declining profitability, indicating a comparatively stronger but still unfavorable competitive moat for Denison.
Stock Comparison
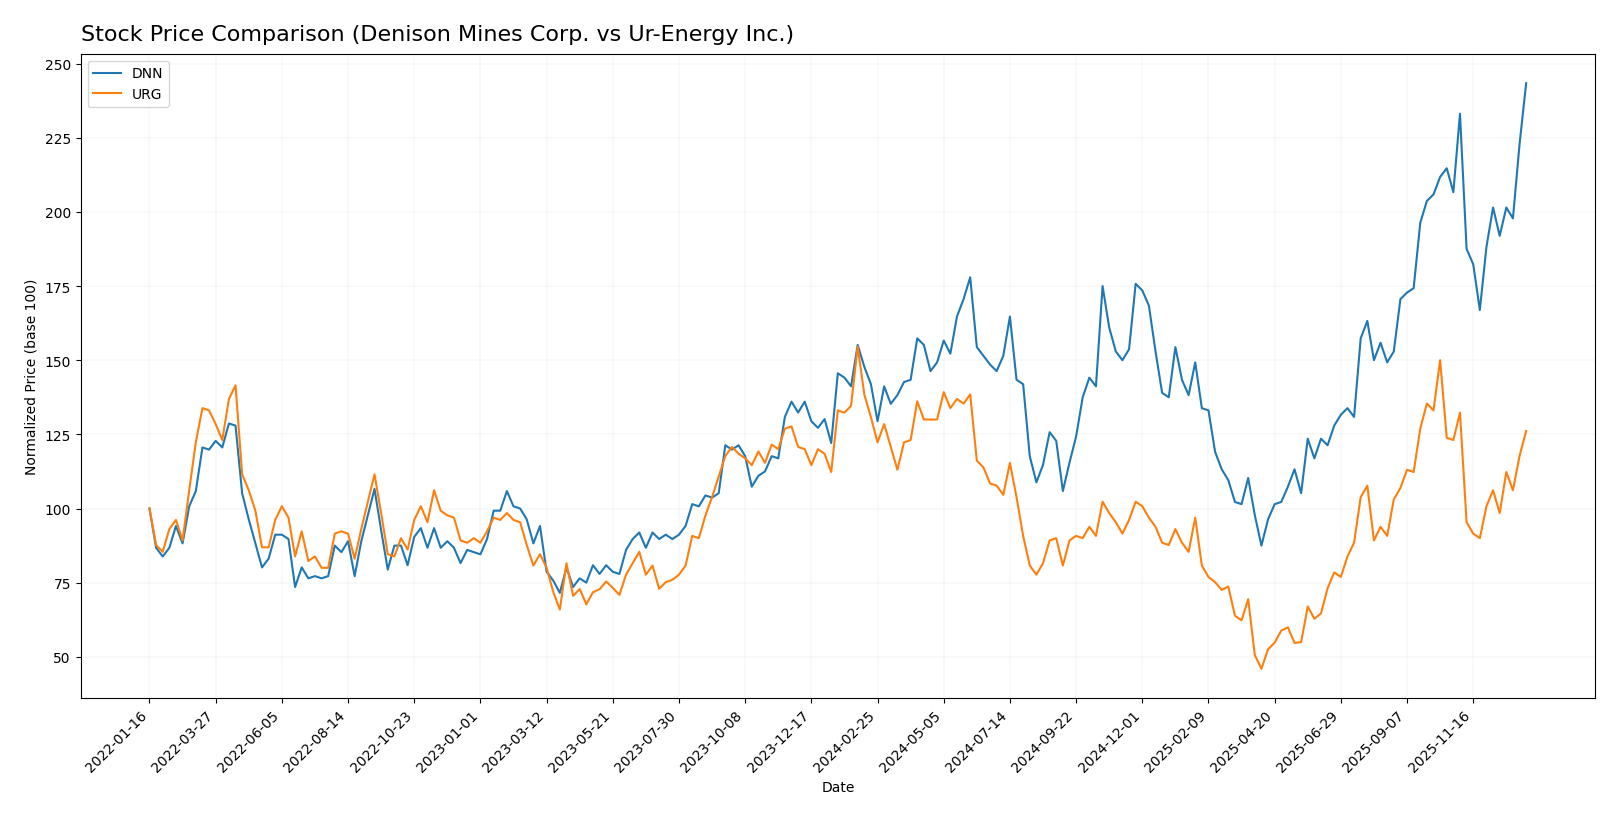
The past year saw Denison Mines Corp. (DNN) experience a strong upward trajectory with accelerating gains, while Ur-Energy Inc. (URG) faced a mild decline, both showing distinct trading volume patterns and recent trend shifts.
Trend Analysis
Denison Mines Corp. (DNN) exhibited a bullish trend over the past 12 months with a 71.5% price increase, accelerating momentum, and a significant range between 1.19 and 3.31. Recent months confirm continued positive growth.
Ur-Energy Inc. (URG) showed a bearish trend with a 3.53% price decline over the same period, despite accelerating movement. The stock’s price fluctuated between 0.6 and 1.95, with a slight recent uptick.
Comparing both, Denison Mines significantly outperformed Ur-Energy, delivering the highest market performance with strong gains versus a moderate loss for Ur-Energy over the past year.
Target Prices
The current analyst consensus for these uranium companies provides a clear view of expected price ranges.
| Company | Target High | Target Low | Consensus |
|---|---|---|---|
| Denison Mines Corp. | 2.6 | 2.6 | 2.6 |
| Ur-Energy Inc. | 2.6 | 2.15 | 2.38 |
Analysts expect Denison Mines to trade around $2.60, below its current price of $3.31, indicating some downside risk. Ur-Energy’s consensus target of $2.38 suggests upside potential from its current $1.64 price.
Analyst Opinions Comparison
This section compares analysts’ ratings and grades for Denison Mines Corp. and Ur-Energy Inc.:
Rating Comparison
Denison Mines Corp. Rating
- Rating: C- with a Very Favorable status
- Discounted Cash Flow Score: 3, Moderate
- ROE Score: 1, Very Unfavorable
- ROA Score: 1, Very Unfavorable
- Debt To Equity Score: 1, Very Unfavorable
- Overall Score: 1, Very Unfavorable
Ur-Energy Inc. Rating
- Rating: D+ with a Very Favorable status
- Discounted Cash Flow Score: 1, Very Unfavorable
- ROE Score: 1, Very Unfavorable
- ROA Score: 1, Very Unfavorable
- Debt To Equity Score: 2, Moderate
- Overall Score: 1, Very Unfavorable
Which one is the best rated?
Denison Mines holds a higher rating grade (C-) compared to Ur-Energy’s D+, with a stronger discounted cash flow score but weaker debt to equity standing. Both share identical low scores in ROE, ROA, and overall assessment.
Scores Comparison
The scores comparison between Denison Mines Corp. (DNN) and Ur-Energy Inc. (URG) is as follows:
DNN Scores
- Altman Z-Score: 0.73, in distress zone, high bankruptcy risk
- Piotroski Score: 4, average financial strength
URG Scores
- Altman Z-Score: 0.60, in distress zone, high bankruptcy risk
- Piotroski Score: 2, very weak financial strength
Which company has the best scores?
Based strictly on the provided data, DNN has higher scores in both Altman Z-Score and Piotroski Score compared to URG. DNN shows average financial strength, while URG’s scores indicate very weak financial health.
Grades Comparison
Here is a comparison of the recent reliable grades assigned to Denison Mines Corp. and Ur-Energy Inc.:
Denison Mines Corp. Grades
The following table summarizes recent grades from established grading companies for Denison Mines Corp.:
| Grading Company | Action | New Grade | Date |
|---|---|---|---|
| Roth MKM | Maintain | Buy | 2024-10-23 |
| TD Securities | Maintain | Speculative Buy | 2023-06-27 |
| Raymond James | Maintain | Outperform | 2023-06-27 |
| TD Securities | Maintain | Speculative Buy | 2023-06-26 |
| Raymond James | Maintain | Outperform | 2023-06-26 |
| Credit Suisse | Downgrade | Underperform | 2017-07-18 |
| Credit Suisse | Downgrade | Underperform | 2017-07-17 |
| Roth Capital | Maintain | Buy | 2016-02-10 |
| Credit Suisse | Upgrade | Neutral | 2014-04-01 |
| Credit Suisse | Upgrade | Neutral | 2014-03-31 |
Overall, Denison Mines has predominantly maintained buy to outperform ratings in recent years, with a few downgrades noted in 2017.
Ur-Energy Inc. Grades
The following table presents recent grades from credible grading firms for Ur-Energy Inc.:
| Grading Company | Action | New Grade | Date |
|---|---|---|---|
| HC Wainwright & Co. | Maintain | Buy | 2025-11-04 |
| B. Riley Securities | Maintain | Buy | 2025-09-25 |
| Roth Capital | Maintain | Buy | 2025-09-23 |
| HC Wainwright & Co. | Maintain | Buy | 2025-04-15 |
| HC Wainwright & Co. | Maintain | Buy | 2025-02-11 |
| Roth MKM | Maintain | Buy | 2024-10-23 |
| B. Riley Securities | Maintain | Buy | 2024-08-20 |
| HC Wainwright & Co. | Maintain | Buy | 2024-08-14 |
| HC Wainwright & Co. | Maintain | Buy | 2024-07-17 |
| Roth MKM | Maintain | Buy | 2024-05-09 |
Ur-Energy has consistently received buy ratings from multiple reputable firms over the past two years without any downgrades.
Which company has the best grades?
Both Denison Mines Corp. and Ur-Energy Inc. have a consensus “Buy” rating from analysts, but Ur-Energy shows a stronger and more consistent buy rating trend with no recent downgrades. This steadiness may influence investor confidence differently compared to Denison Mines’ occasional speculative or outperform ratings and past downgrades.
Strengths and Weaknesses
Below is a comparison of Denison Mines Corp. (DNN) and Ur-Energy Inc. (URG) based on their diversification, profitability, innovation, global presence, and market share using the most recent data.
| Criterion | Denison Mines Corp. (DNN) | Ur-Energy Inc. (URG) |
|---|---|---|
| Diversification | Limited product range, focused on uranium mining | Limited product range, focused on uranium mining |
| Profitability | Unfavorable: ROIC -10.03%, negative net margin and ROE, value destroying | Unfavorable: ROIC -36.01%, negative net margin and ROE, value destroying with declining profitability |
| Innovation | Neutral: No significant recent innovation reported | Neutral: No significant recent innovation reported |
| Global presence | Modest, mainly North America | Modest, mainly North America |
| Market Share | Small player in uranium sector | Small player in uranium sector |
Key takeaways: Both companies operate in a niche uranium market with limited diversification and modest global reach. Their profitability metrics are unfavorable, indicating value destruction. Investors should exercise caution due to persistent negative returns and lack of competitive advantages.
Risk Analysis
The following table summarizes key risk metrics for Denison Mines Corp. (DNN) and Ur-Energy Inc. (URG) based on the latest available data for 2024.
| Metric | Denison Mines Corp. (DNN) | Ur-Energy Inc. (URG) |
|---|---|---|
| Market Risk | High beta at 1.89, indicating significant price volatility | Moderate beta at 1.04, suggesting lower volatility |
| Debt level | Zero debt; very low financial leverage | Very low debt-to-equity ratio (~0.01), low leverage |
| Regulatory Risk | High due to uranium industry regulations in Canada | High due to uranium regulations and US mining laws |
| Operational Risk | Low number of employees (65), but complex mining operations | Moderate operational complexity with 101 employees |
| Environmental Risk | High, uranium mining impacts and strict environmental regulations | High, similar uranium mining environmental concerns |
| Geopolitical Risk | Moderate, Canada’s stable but uranium export policies are sensitive | Moderate to high, US policies on uranium and energy security |
Denison Mines faces elevated market and regulatory risks with high volatility and stringent Canadian uranium regulations. Ur-Energy shares similar regulatory and environmental risks but benefits from slightly lower market volatility and minimal debt. Both companies show financial distress signals and operational risks inherent in uranium mining, requiring cautious risk management.
Which Stock to Choose?
Denison Mines Corp. (DNN) shows a mixed income evolution with a 117% revenue growth in 2024 but unfavorable profitability and financial ratios overall. Its debt level is low, but returns on equity and assets are negative, indicating value destruction, despite a very favorable rating.
Ur-Energy Inc. (URG) presents a 91% revenue growth in 2024 with some favorable income statement metrics but overall negative profitability and financial ratios. It carries moderate debt and shows declining ROIC, with a very favorable rating yet financial distress signals.
For risk-averse investors prioritizing stability, neither stock currently exhibits strong profitability or value creation, but DNN’s stable profitability and higher rating might appear more favorable. Risk-tolerant investors focused on growth may find URG’s recent revenue gains and moderate debt profile potentially interesting despite its declining profitability.
Disclaimer: Investment carries a risk of loss of initial capital. The past performance is not a reliable indicator of future results. Be sure to understand risks before making an investment decision.
Go Further
I encourage you to read the complete analyses of Denison Mines Corp. and Ur-Energy Inc. to enhance your investment decisions: