In today’s fast-evolving tech landscape, Workday, Inc. and Unity Software Inc. stand out as pioneers in software applications, yet they cater to distinct but overlapping markets. Workday excels in enterprise cloud solutions for finance and human capital management, while Unity leads in real-time 3D content platforms for interactive media. This comparison will help investors understand which company offers the most compelling growth and innovation potential for their portfolios.
Table of contents
Companies Overview
I will begin the comparison between Workday, Inc. and Unity Software Inc. by providing an overview of these two companies and their main differences.
Workday, Inc. Overview
Workday, Inc. is a technology company specializing in enterprise cloud applications that assist businesses in planning, execution, and analysis of operations. It offers financial management, human capital management, and analytics solutions designed to improve efficiency and decision-making across various industries such as healthcare, education, and retail. Headquartered in Pleasanton, California, Workday employs over 20K people and has a market cap of approximately 49.9B USD.
Unity Software Inc. Overview
Unity Software Inc. operates a real-time 3D content platform that supports the creation, running, and monetization of interactive 2D and 3D content across multiple devices including mobile, PC, and AR/VR. Serving creators and developers globally, Unity is focused on software solutions for gaming and interactive media. The company is based in San Francisco, California, employs about 5K people, and holds a market cap near 17.5B USD.
Key similarities and differences
Both companies operate in the software application industry within the technology sector in the US, focusing on cloud-based solutions. Workday emphasizes enterprise resource planning and human capital management for diverse industries, while Unity targets interactive content creation and monetization primarily for gaming and multimedia. Workday’s workforce and market cap are significantly larger, reflecting its broader enterprise focus compared to Unity’s niche in real-time 3D content development.
Income Statement Comparison
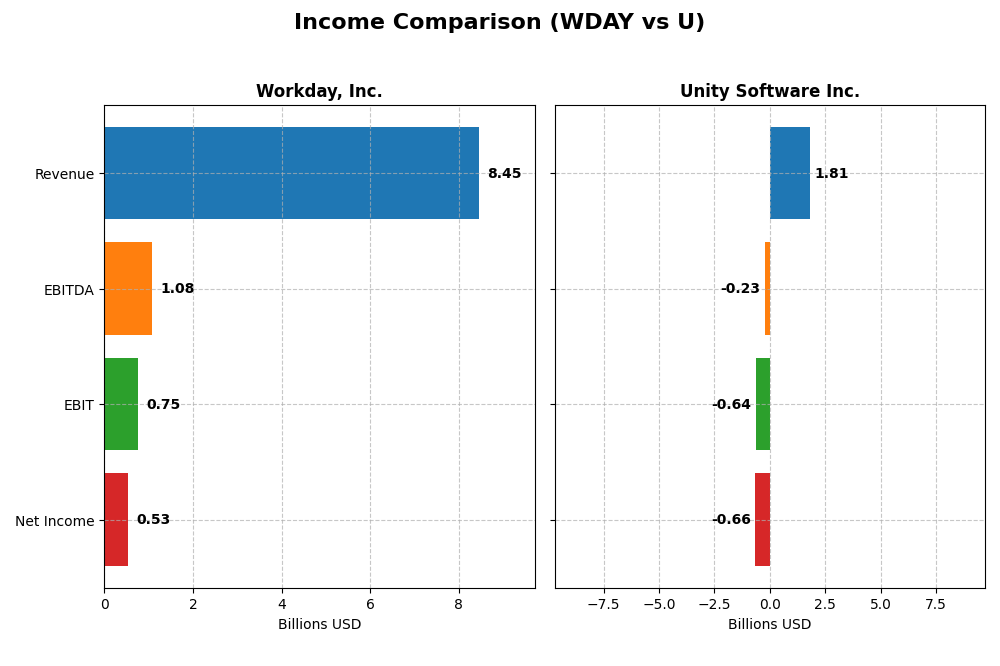
The table below compares key income statement metrics for Workday, Inc. and Unity Software Inc. for their most recent fiscal years, highlighting their financial performance.
| Metric | Workday, Inc. (WDAY) | Unity Software Inc. (U) |
|---|---|---|
| Market Cap | 49.9B | 17.5B |
| Revenue | 8.45B | 1.81B |
| EBITDA | 1.08B | -235M |
| EBIT | 752M | -644M |
| Net Income | 526M | -664M |
| EPS | 1.98 | -1.68 |
| Fiscal Year | 2025 | 2024 |
Income Statement Interpretations
Workday, Inc.
Workday’s revenue and net income increased strongly from 2021 to 2025, nearly doubling revenue and tripling net income over the period. Gross margin remained favorable at 75.5%, with a neutral EBIT margin of 8.9%. In 2025, revenue grew 16.35% year-on-year, EBIT surged 60%, but net margin and EPS declined, signaling mixed profitability dynamics despite solid top-line progress.
Unity Software Inc.
Unity experienced revenue growth overall but faced a 17.1% decline in 2024 after prior increases. Net income remained negative throughout 2020-2024, worsening over the period despite a 22.22% EPS improvement in the latest year. Gross margin was favorable at 73.48%, but EBIT and net margins stayed unfavorable, reflecting persistent challenges in achieving profitability.
Which one has the stronger fundamentals?
Workday demonstrates stronger fundamentals with sustained revenue and net income growth, favorable gross and net margins, and improving EBIT. Unity’s profile is weaker, marked by negative net income and margins despite some recent EPS gains. The balance of favorable versus unfavorable indicators clearly favors Workday’s financial health and operational efficiency over Unity’s.
Financial Ratios Comparison
The following table presents a side-by-side comparison of key financial ratios for Workday, Inc. and Unity Software Inc. based on their most recent fiscal year data.
| Ratios | Workday, Inc. (WDAY) FY 2025 | Unity Software Inc. (U) FY 2024 |
|---|---|---|
| ROE | 5.82% | -20.81% |
| ROIC | 2.73% | -12.78% |
| P/E | 132.15 | -13.40 |
| P/B | 7.69 | 2.79 |
| Current Ratio | 1.85 | 2.50 |
| Quick Ratio | 1.85 | 2.50 |
| D/E (Debt-to-Equity) | 0.37 | 0.74 |
| Debt-to-Assets | 18.70% | 34.94% |
| Interest Coverage | 3.64 | -32.08 |
| Asset Turnover | 0.47 | 0.27 |
| Fixed Asset Turnover | 5.36 | 18.35 |
| Payout Ratio | 0 | 0 |
| Dividend Yield | 0 | 0 |
Interpretation of the Ratios
Workday, Inc.
Workday’s ratios present a mixed picture with 42.86% favorable and 42.86% unfavorable ratings, resulting in a neutral global opinion. Strengths include a solid current ratio (1.85) and interest coverage (6.6), indicating good liquidity and debt management. However, returns on equity (5.82%) and invested capital (2.73%) are weak, with a high PE ratio of 132.15 raising valuation concerns. Workday does not pay dividends, reflecting a reinvestment strategy focused on growth and innovation.
Unity Software Inc.
Unity’s ratios lean slightly unfavorable, with 50% unfavorable and 28.57% favorable metrics. The company shows strong liquidity ratios (current and quick ratio at 2.5) and an impressive fixed asset turnover of 18.35, but suffers from negative returns (ROE -20.81%, ROIC -12.78%) and a negative interest coverage ratio (-27.34), highlighting operational and financial stress. Unity does not distribute dividends, consistent with its high-growth phase and prioritization of R&D and expansion over shareholder payouts.
Which one has the best ratios?
Workday exhibits a more balanced ratio profile with a neutral overall assessment, supported by solid liquidity and manageable debt levels. Unity, while showing some operational efficiency, faces deeper profitability and coverage challenges, leading to a slightly unfavorable rating. Based strictly on the ratio evaluations, Workday demonstrates relatively stronger financial stability and risk metrics in 2025 and 2024 respectively.
Strategic Positioning
This section compares the strategic positioning of Workday, Inc. and Unity Software Inc., including market position, key segments, and exposure to technological disruption:
Workday, Inc.
- Leading enterprise cloud applications provider with strong competition in software applications.
- Key segments include Subscription Services driving most revenue, and Professional Services as a smaller contributor.
- Focused on cloud applications with machine learning and augmented analytics; moderate disruption risk.
Unity Software Inc.
- Interactive real-time 3D content platform with high market volatility and competition.
- Revenue primarily from Operate Solutions and Create Solutions supporting real-time 2D/3D content creation.
- Innovates in real-time 3D and AR/VR content, exposed to rapid technological changes and platform evolution.
Workday, Inc. vs Unity Software Inc. Positioning
Workday pursues a diversified software portfolio centered on enterprise cloud and financial management, offering stability with subscription revenues. Unity concentrates on interactive 3D content platforms, exposing it to faster innovation cycles but potentially higher volatility.
Which has the best competitive advantage?
Both companies currently shed value with ROIC below WACC; however, Workday shows a growing ROIC trend indicating improving profitability, while Unity faces declining ROIC, suggesting weaker competitive advantage.
Stock Comparison
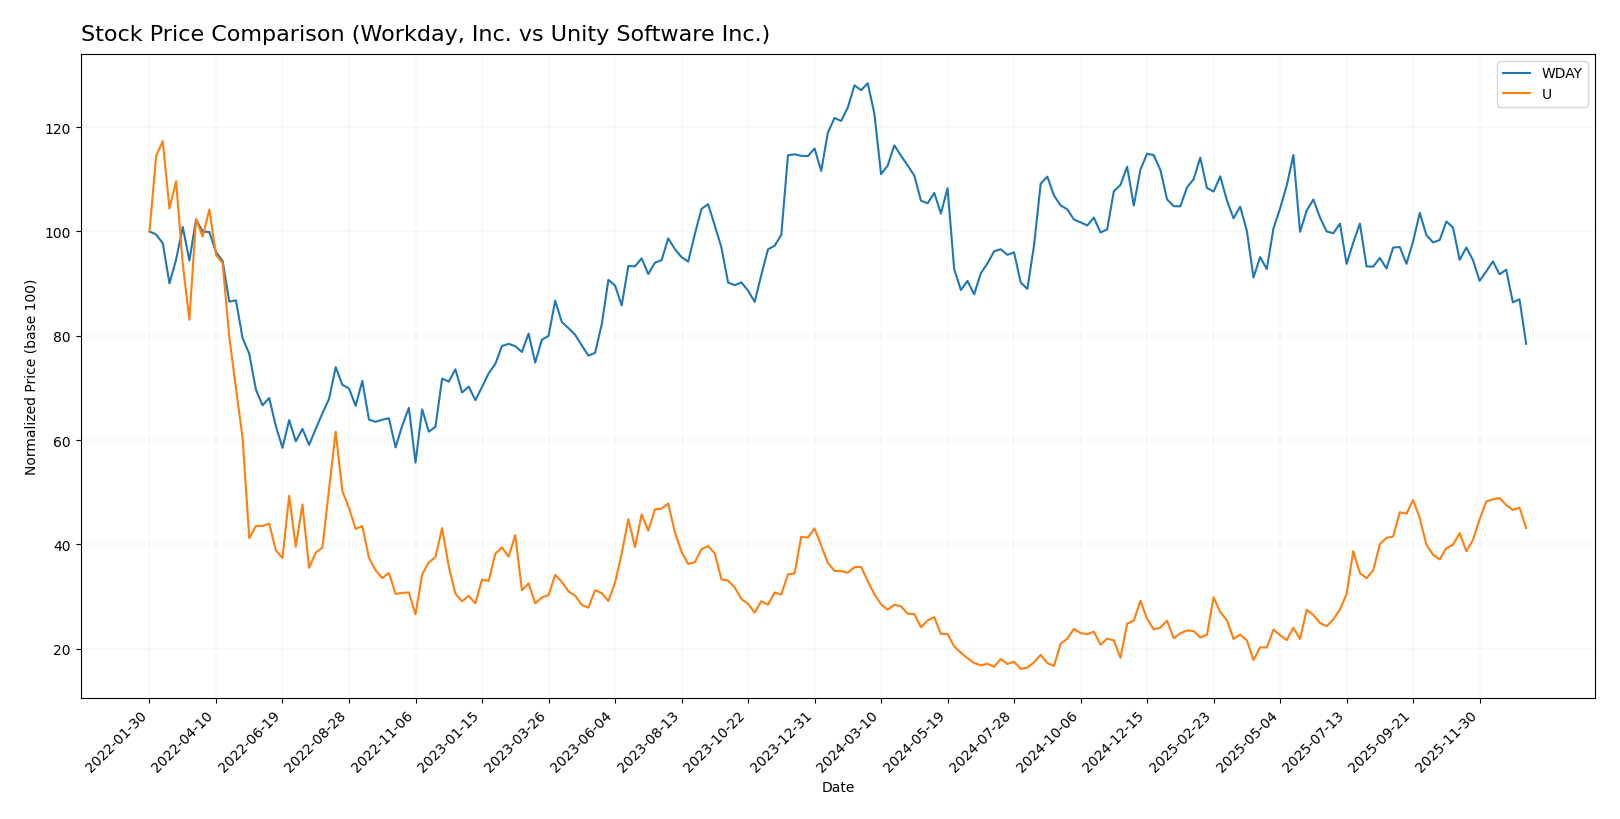
The stock prices of Workday, Inc. and Unity Software Inc. have exhibited contrasting dynamics over the past 12 months, with Workday showing a significant decline and Unity demonstrating steady gains, reflecting divergent market sentiments and trading activity.
Trend Analysis
Workday, Inc. experienced a bearish trend over the past year with a -38.91% price change and deceleration in the downward movement, reaching a high of 305.88 and a low of 186.86, with notable volatility (std deviation 20.22).
Unity Software Inc. showed a bullish trend with a 31.0% price increase and acceleration in gains, hitting a high of 46.42 and a low of 15.32, supported by lower volatility (std deviation 9.04).
Comparing both, Unity Software Inc. delivered the highest market performance with a positive 31.0% change, outperforming Workday’s -38.91% decline during the same period.
Target Prices
The current analyst consensus indicates moderate upside potential for Workday, Inc. and Unity Software Inc.
| Company | Target High | Target Low | Consensus |
|---|---|---|---|
| Workday, Inc. | 320 | 235 | 274.47 |
| Unity Software Inc. | 60 | 39 | 50.98 |
Analysts expect Workday’s price to rise significantly above its current 186.86 USD, while Unity’s consensus target also suggests upside from 40.95 USD, reflecting positive market sentiment for both stocks.
Analyst Opinions Comparison
This section compares analysts’ ratings and grades for Workday, Inc. and Unity Software Inc.:
Rating Comparison
WDAY Rating
- Rating: B-, considered very favorable by analysts.
- Discounted Cash Flow Score: 4, indicating favorable value.
- ROE Score: 3, showing moderate efficiency in equity use.
- ROA Score: 3, moderate asset utilization effectiveness.
- Debt To Equity Score: 2, moderate financial risk.
- Overall Score: 2, moderate overall financial standing.
U Rating
- Rating: D+, also marked very favorable despite lower score.
- Discounted Cash Flow Score: 1, very unfavorable valuation.
- ROE Score: 1, very unfavorable efficiency.
- ROA Score: 1, very unfavorable asset use.
- Debt To Equity Score: 1, very unfavorable financial risk.
- Overall Score: 1, very unfavorable overall standing.
Which one is the best rated?
Based on the provided data, Workday holds a superior position with a B- rating and favorable DCF score, alongside moderate scores in ROE, ROA, and debt-to-equity. Unity’s scores are consistently very unfavorable except for one moderate price-to-book score, resulting in a lower overall rating.
Scores Comparison
Here is a comparison of the financial scores for Workday, Inc. and Unity Software Inc.:
WDAY Scores
- Altman Z-Score: 4.41, indicating a safe zone, low bankruptcy risk
- Piotroski Score: 6, classified as average financial strength
U Scores
- Altman Z-Score: 2.93, in grey zone, moderate bankruptcy risk
- Piotroski Score: 4, classified as average financial strength
Which company has the best scores?
Workday’s Altman Z-Score is higher, placing it in a safer financial zone compared to Unity’s grey zone score. Both companies have average Piotroski Scores, but Workday’s scores suggest comparatively stronger financial stability.
Grades Comparison
The following presents a comparison of recent grades assigned to Workday, Inc. and Unity Software Inc. by major grading companies:
Workday, Inc. Grades
This table summarizes recent grades from notable grading companies for Workday, Inc.:
| Grading Company | Action | New Grade | Date |
|---|---|---|---|
| Barclays | Maintain | Overweight | 2026-01-12 |
| RBC Capital | Maintain | Outperform | 2026-01-05 |
| TD Cowen | Maintain | Buy | 2025-11-26 |
| DA Davidson | Maintain | Neutral | 2025-11-26 |
| Wells Fargo | Maintain | Overweight | 2025-11-26 |
| Barclays | Maintain | Overweight | 2025-11-26 |
| Keybanc | Maintain | Overweight | 2025-11-26 |
| Citigroup | Maintain | Neutral | 2025-11-26 |
| JP Morgan | Maintain | Overweight | 2025-11-26 |
| UBS | Maintain | Neutral | 2025-11-26 |
Workday’s grades predominantly indicate positive sentiment, with multiple “Overweight,” “Outperform,” and “Buy” ratings, suggesting confidence among analysts.
Unity Software Inc. Grades
This table summarizes recent grades from prominent grading companies for Unity Software Inc.:
| Grading Company | Action | New Grade | Date |
|---|---|---|---|
| Morgan Stanley | Maintain | Overweight | 2026-01-13 |
| Goldman Sachs | Maintain | Neutral | 2026-01-13 |
| Wells Fargo | Maintain | Overweight | 2026-01-08 |
| Jefferies | Maintain | Buy | 2026-01-05 |
| Piper Sandler | Upgrade | Overweight | 2025-12-11 |
| BTIG | Upgrade | Buy | 2025-12-11 |
| Wells Fargo | Upgrade | Overweight | 2025-12-05 |
| Arete Research | Upgrade | Buy | 2025-12-01 |
| Citigroup | Maintain | Buy | 2025-11-11 |
| Wells Fargo | Maintain | Equal Weight | 2025-11-07 |
Unity Software shows a mix of maintained and upgraded positive ratings, including several upgrades to “Buy” and “Overweight,” indicating improving analyst sentiment.
Which company has the best grades?
Both companies hold a consensus rating of “Buy,” but Workday has a larger number of “Overweight” and “Outperform” ratings from a broader panel of analysts, reflecting stronger overall endorsement. This may imply more stable analyst confidence, potentially influencing investor sentiment and risk assessment differently compared to Unity Software’s recent upgrades.
Strengths and Weaknesses
The following table summarizes the key strengths and weaknesses of Workday, Inc. (WDAY) and Unity Software Inc. (U) based on the most recent financial and operational data.
| Criterion | Workday, Inc. (WDAY) | Unity Software Inc. (U) |
|---|---|---|
| Diversification | Primarily subscription services (7.7B USD in 2025) with growing professional services segment (728M USD) | Balanced between Create Solutions (614M USD) and Operate Solutions (1.2B USD) segments |
| Profitability | Positive net margin (6.23%), but low ROIC (2.73%) below WACC, indicating value destruction | Negative net margin (-36.63%), negative ROIC (-12.78%), indicating significant value destruction |
| Innovation | Moderate innovation with steady growth in ROIC despite value destruction | Innovation challenged by declining ROIC and profitability |
| Global presence | Established global SaaS presence with consistent subscription revenue growth | Growing global footprint supported by diversified product offerings |
| Market Share | Strong position in enterprise HR and finance software markets | Leading in real-time 3D development platforms but facing profitability headwinds |
Key takeaways: Workday shows solid revenue growth and diversification with improving profitability trends but still struggles with value creation. Unity faces greater profitability and value challenges despite strong market exposure and product diversification. Caution is advised for investors considering these stocks.
Risk Analysis
Below is a comparative table summarizing the key risks associated with Workday, Inc. (WDAY) and Unity Software Inc. (U) as of the most recent fiscal years.
| Metric | Workday, Inc. (WDAY) | Unity Software Inc. (U) |
|---|---|---|
| Market Risk | Moderate (Beta 1.14, stable sector) | High (Beta 2.05, volatile sector) |
| Debt level | Low (Debt/Equity 0.37, favorable) | Moderate (Debt/Equity 0.74, neutral) |
| Regulatory Risk | Moderate (Cloud software compliance) | Moderate (Global content regulation) |
| Operational Risk | Moderate (Large scale SaaS ops) | High (Rapid growth, tech innovation) |
| Environmental Risk | Low (Data center energy use) | Low (Software platform, limited impact) |
| Geopolitical Risk | Moderate (US and international exposure) | Moderate (Global client base, diverse markets) |
Workday shows moderate market and operational risks but benefits from low debt and solid liquidity, making it relatively stable. Unity faces higher market volatility and operational risks due to its aggressive growth and innovation cycle, alongside weaker profitability and financial health indicators. Investors should weigh Unity’s higher risk for potential high reward, while Workday offers a more cautious profile amid sector challenges.
Which Stock to Choose?
Workday, Inc. (WDAY) shows a favorable income evolution with 16.35% revenue growth in the last year and a 78.57% favorable income statement evaluation overall. Its financial ratios are mixed, with 42.86% favorable and 42.86% unfavorable ratings, profitability is positive but moderate, debt levels are manageable, and the company holds a very favorable B- rating.
Unity Software Inc. (U) exhibits an unfavorable income trend with a 17.1% revenue decline last year and a 57.14% unfavorable income statement evaluation overall. Its financial ratios lean slightly unfavorable at 50%, profitability is negative, debt is moderate, and it holds a very unfavorable D+ rating, reflecting challenges in generating returns.
Investors focused on stability and overall financial health might find Workday’s improving profitability and stronger rating more indicative of resilience, while those with a risk-tolerant or growth-oriented profile could interpret Unity’s bullish stock trend and acceleration as potential for recovery despite current financial weaknesses.
Disclaimer: Investment carries a risk of loss of initial capital. The past performance is not a reliable indicator of future results. Be sure to understand risks before making an investment decision.
Go Further
I encourage you to read the complete analyses of Workday, Inc. and Unity Software Inc. to enhance your investment decisions: