In the fast-evolving software application industry, Unity Software Inc. and monday.com Ltd. stand out as innovative leaders shaping digital experiences and work management solutions. Unity excels in real-time 3D content creation, while monday.com revolutionizes organizational productivity with its cloud-based work operating system. Both companies compete for market relevance through cutting-edge technology and global reach. This article will help investors identify which company offers the most compelling opportunity for their portfolio.
Table of contents
Companies Overview
I will begin the comparison between Unity Software Inc. and monday.com Ltd. by providing an overview of these two companies and their main differences.
Unity Software Inc. Overview
Unity Software Inc. develops and operates an interactive real-time 3D content platform aimed at creators and developers of 2D and 3D content for various devices, including mobile phones, PCs, consoles, and AR/VR hardware. Founded in 2004 and headquartered in San Francisco, Unity holds a leading position in the software application industry with a market cap of $17.5B, serving a global client base through multiple sales channels.
monday.com Ltd. Overview
monday.com Ltd. offers a cloud-based Work OS platform featuring modular building blocks that enable users to create software applications and manage work across diverse industries. Founded in 2012 and based in Tel Aviv, the company focuses on work management tools for organizations, educational institutions, and government bodies. It has a market capitalization of $6.5B and operates internationally, with a presence in the U.S., Europe, and the Middle East.
Key similarities and differences
Both companies operate in the software application industry and provide cloud-based platforms targeting business users and creators. Unity emphasizes interactive real-time 3D content creation, while monday.com specializes in work management and collaboration tools. Unity is larger with nearly double the employees and a significantly higher market cap. Additionally, Unity focuses on digital content development, whereas monday.com centers on operational productivity and workflow customization.
Income Statement Comparison
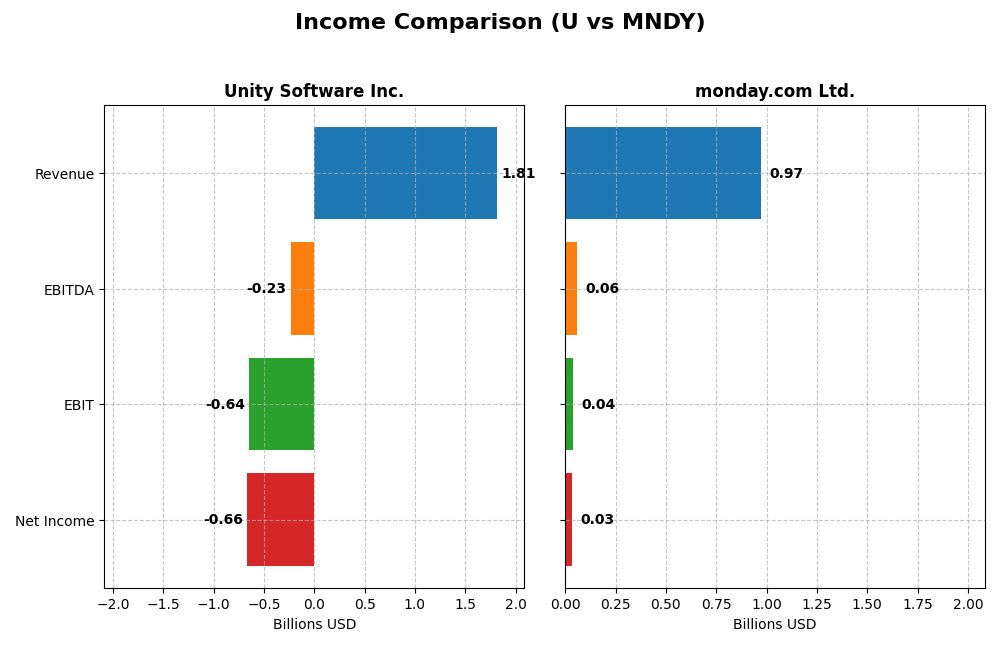
This table compares the key income statement metrics for Unity Software Inc. and monday.com Ltd. for the fiscal year 2024, providing a snapshot of their financial performance.
| Metric | Unity Software Inc. (U) | monday.com Ltd. (MNDY) |
|---|---|---|
| Market Cap | 17.5B | 6.5B |
| Revenue | 1.81B | 972M |
| EBITDA | -235M | 58M |
| EBIT | -644M | 40M |
| Net Income | -664M | 32M |
| EPS | -1.68 | 0.65 |
| Fiscal Year | 2024 | 2024 |
Income Statement Interpretations
Unity Software Inc.
Unity Software’s revenue increased significantly over the 2020-2024 period, rising from $772M to $1.81B, with an overall growth of 134.74%. However, net income remained negative throughout, with a loss of $664M in 2024, though it improved from -$822M in 2023. Gross margin stayed strong at 73.48%, but operating and net margins remained unfavorable, indicating persistent profitability challenges despite improving EBIT and EPS growth in the latest year.
monday.com Ltd.
monday.com experienced robust revenue growth, climbing from $161M in 2020 to nearly $972M in 2024, a 503% increase. Net income turned positive in 2024 at $32M after several years of losses. The company posted a high gross margin of 89.33% and showed improving EBIT and net margins, reaching 4.09% and 3.33%, respectively, signaling a transition toward profitability. The latest fiscal year saw strong margin and EPS expansion, reflecting operational improvements.
Which one has the stronger fundamentals?
monday.com demonstrates stronger fundamentals with consistent, favorable income statement metrics, including positive net income and expanding margins, supported by significant revenue and EPS growth. Unity Software shows impressive revenue growth but continues to report net losses and negative margins, suggesting ongoing operational and profitability challenges. Overall, monday.com’s income statement indicators are more positive for investors assessing business performance.
Financial Ratios Comparison
The table below presents key financial ratios for Unity Software Inc. and monday.com Ltd. based on their latest fiscal year data, providing a snapshot of their financial performance and position.
| Ratios | Unity Software Inc. (U) | monday.com Ltd. (MNDY) |
|---|---|---|
| ROE | -20.8% | 3.14% |
| ROIC | -12.8% | -1.73% |
| P/E | -13.4 | 363 |
| P/B | 2.79 | 11.41 |
| Current Ratio | 2.50 | 2.66 |
| Quick Ratio | 2.50 | 2.66 |
| D/E | 0.74 | 0.10 |
| Debt-to-Assets | 35% | 6.3% |
| Interest Coverage | -32.1 | 0 |
| Asset Turnover | 0.27 | 0.58 |
| Fixed Asset Turnover | 18.3 | 7.13 |
| Payout ratio | 0 | 0 |
| Dividend yield | 0 | 0 |
Interpretation of the Ratios
Unity Software Inc.
Unity Software exhibits several unfavorable profitability ratios, including a negative net margin of -36.63% and a return on equity of -20.81%, indicating challenges in generating returns for shareholders. The company’s current and quick ratios, both at 2.5, are favorable, reflecting solid liquidity. Unity does not pay dividends, likely due to negative earnings and a reinvestment strategy focusing on growth and research and development.
monday.com Ltd.
monday.com shows mixed financial ratios with a slightly positive net margin of 3.33% but still unfavorable return on equity at 3.14%. Its balance sheet strength is indicated by a favorable debt-to-equity ratio of 0.1 and a strong current ratio of 2.66. The company also does not distribute dividends, which suggests a focus on reinvestment and expansion rather than shareholder payouts at this stage.
Which one has the best ratios?
monday.com holds a more balanced ratio profile, with a higher proportion of favorable metrics like debt management and liquidity, despite some concerns in profitability. Unity Software faces more pronounced profitability weaknesses and a higher weighted average cost of capital. Overall, monday.com’s ratios suggest a more stable financial footing compared to Unity’s slightly unfavorable ratio mix.
Strategic Positioning
This section compares the strategic positioning of Unity Software Inc. and monday.com Ltd. across Market position, Key segments, and Exposure to technological disruption:
Unity Software Inc.
- Market leader in interactive real-time 3D content platform with strong global presence and competitive pressure
- Key segments include Create Solutions and Operate Solutions driving software for 2D/3D content creation and monetization
- Exposure to technological disruption through evolving real-time 3D content and AR/VR platforms
monday.com Ltd.
- Growing cloud-based Work OS provider focused on modular applications with international reach but smaller market cap
- Focuses on Work OS, project management, marketing, CRM software solutions supporting diverse industries
- Faces disruption risks in cloud software and work management tools innovation, emphasizing modular building blocks
Unity Software Inc. vs monday.com Ltd. Positioning
Unity pursues a diversified approach with two distinct revenue segments in content creation and operation globally. monday.com concentrates on a unified cloud-based work operating system targeting organizational workflow. Unity’s scale offers broad market coverage, while monday.com’s niche focus supports targeted software applications.
Which has the best competitive advantage?
Based on MOAT evaluation, both companies currently shed value, but monday.com shows an improving profitability trend, while Unity experiences a declining return on invested capital, indicating a slightly better competitive advantage for monday.com.
Stock Comparison
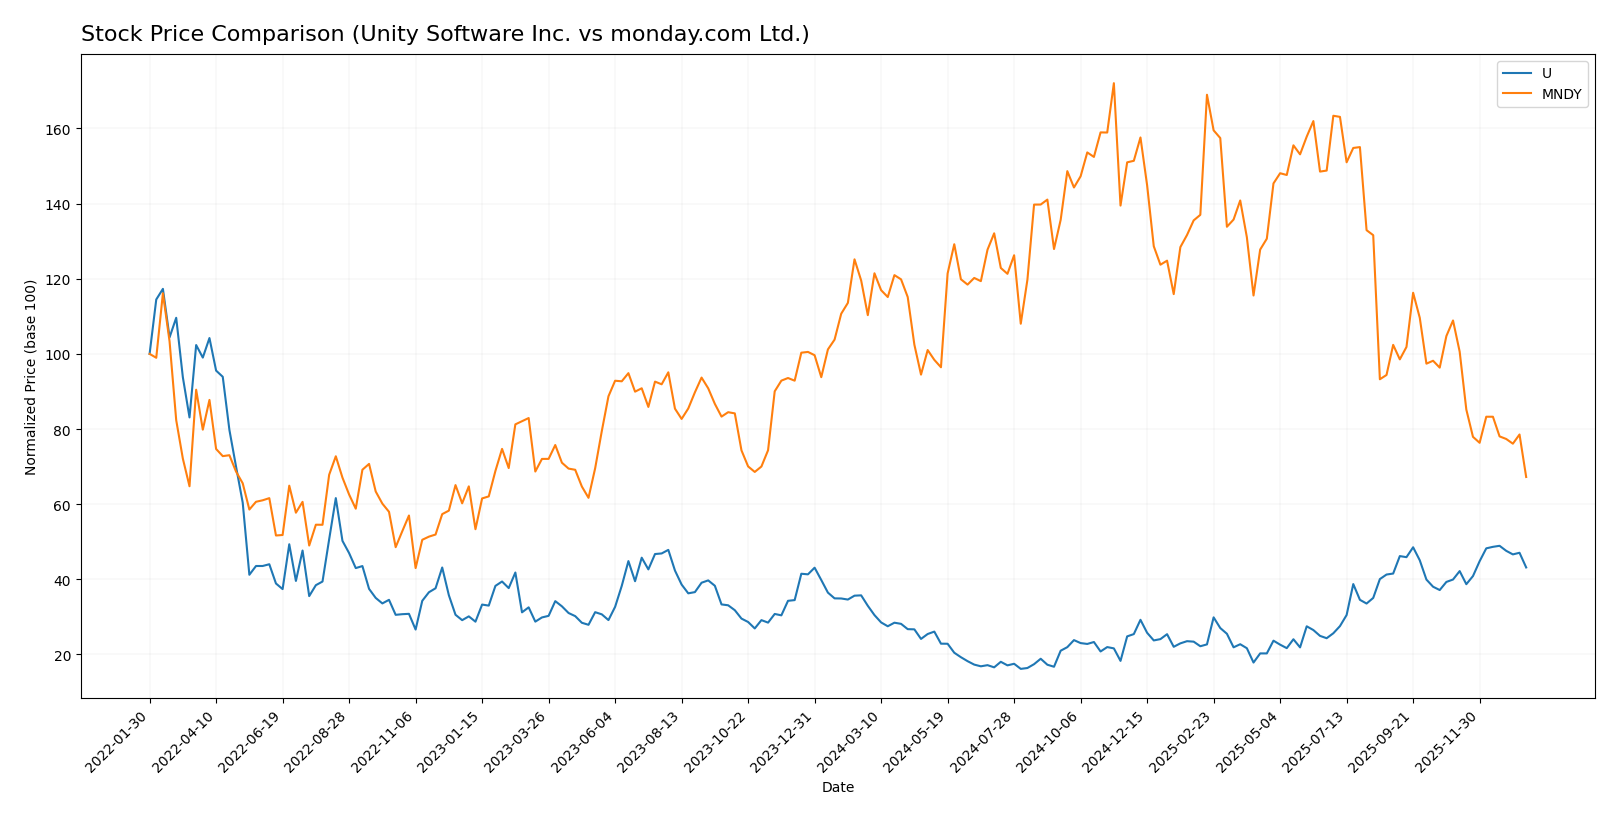
The past year reveals contrasting trajectories for Unity Software Inc. and monday.com Ltd., with Unity showing a strong upward momentum while monday.com experiences significant declines and volatility.
Trend Analysis
Unity Software Inc. exhibits a bullish trend over the past 12 months, gaining 31.0% with accelerating momentum. The price ranged between 15.32 and 46.42, and recent weeks show continued moderate positive growth.
monday.com Ltd. shows a bearish trend with a 39.06% decline over the same period, accompanied by deceleration and high volatility. Prices fluctuated between 126.7 and 324.31, with recent performance sharply negative.
Comparing both, Unity Software clearly delivered the highest market performance, demonstrating robust gains versus monday.com’s sustained losses.
Target Prices
The consensus target prices from verified analysts indicate notable upside potential for both Unity Software Inc. and monday.com Ltd.
| Company | Target High | Target Low | Consensus |
|---|---|---|---|
| Unity Software Inc. | 60 | 39 | 50.98 |
| monday.com Ltd. | 330 | 194 | 264.42 |
Analysts expect Unity Software’s stock price to rise from the current $40.95 to an average target near $51, suggesting moderate upside. monday.com’s consensus target price of $264.42 is significantly higher than its current $126.70, indicating strong growth expectations.
Analyst Opinions Comparison
This section compares analysts’ ratings and grades for Unity Software Inc. and monday.com Ltd.:
Rating Comparison
Unity Software Inc. Rating
- Rating: D+ indicating a very favorable status overall.
- Discounted Cash Flow Score: 1, rated very unfavorable for future cash flow.
- ROE Score: 1, very unfavorable efficiency in generating shareholder profit.
- ROA Score: 1, very unfavorable asset utilization effectiveness.
- Debt To Equity Score: 1, very unfavorable financial risk profile.
- Overall Score: 1, very unfavorable financial health summary.
monday.com Ltd. Rating
- Rating: B- reflecting a very favorable overall status.
- Discounted Cash Flow Score: 4, rated favorable for future cash flow.
- ROE Score: 3, moderate efficiency in generating shareholder profit.
- ROA Score: 3, moderate asset utilization effectiveness.
- Debt To Equity Score: 3, moderate financial risk profile.
- Overall Score: 3, moderate financial health summary.
Which one is the best rated?
Based strictly on the provided data, monday.com Ltd. holds a better rating and higher scores across all key financial metrics compared to Unity Software Inc., reflecting a stronger financial profile and outlook.
Scores Comparison
The following table compares the Altman Z-Score and Piotroski Score of Unity Software Inc. and monday.com Ltd.:
Unity Software Inc. Scores
- Altman Z-Score: 2.93, indicating moderate bankruptcy risk in the grey zone.
- Piotroski Score: 4, reflecting average financial strength.
monday.com Ltd. Scores
- Altman Z-Score: 6.33, indicating low bankruptcy risk in the safe zone.
- Piotroski Score: 5, reflecting average financial strength.
Which company has the best scores?
Based on the provided data, monday.com Ltd. shows a significantly higher Altman Z-Score, indicating stronger financial stability. Both companies have average Piotroski Scores, with monday.com Ltd. slightly ahead.
Grades Comparison
The grades for Unity Software Inc. and monday.com Ltd. from reputable grading companies are as follows:
Unity Software Inc. Grades
Below is a summary of recent grades assigned by leading financial institutions to Unity Software Inc.:
| Grading Company | Action | New Grade | Date |
|---|---|---|---|
| Morgan Stanley | Maintain | Overweight | 2026-01-13 |
| Goldman Sachs | Maintain | Neutral | 2026-01-13 |
| Wells Fargo | Maintain | Overweight | 2026-01-08 |
| Jefferies | Maintain | Buy | 2026-01-05 |
| Piper Sandler | Upgrade | Overweight | 2025-12-11 |
| BTIG | Upgrade | Buy | 2025-12-11 |
| Wells Fargo | Upgrade | Overweight | 2025-12-05 |
| Arete Research | Upgrade | Buy | 2025-12-01 |
| Citigroup | Maintain | Buy | 2025-11-11 |
| Wells Fargo | Maintain | Equal Weight | 2025-11-07 |
The overall trend for Unity Software Inc. shows a positive bias with multiple upgrades from Neutral/Equal Weight to Buy or Overweight in recent months, indicating growing confidence among analysts.
monday.com Ltd. Grades
The following table presents recent grades from prominent grading firms for monday.com Ltd.:
| Grading Company | Action | New Grade | Date |
|---|---|---|---|
| BTIG | Maintain | Buy | 2026-01-15 |
| Barclays | Maintain | Overweight | 2026-01-12 |
| Jefferies | Maintain | Buy | 2026-01-05 |
| Citigroup | Maintain | Buy | 2025-12-23 |
| Tigress Financial | Maintain | Buy | 2025-12-11 |
| Baird | Maintain | Outperform | 2025-11-11 |
| Wells Fargo | Maintain | Overweight | 2025-11-11 |
| DA Davidson | Maintain | Buy | 2025-11-11 |
| Morgan Stanley | Maintain | Overweight | 2025-11-11 |
| Piper Sandler | Maintain | Overweight | 2025-11-11 |
monday.com Ltd. maintains a consistently positive rating environment, with most analysts rating it as Buy or Overweight, and some Outperform, reflecting steady endorsement from the analyst community.
Which company has the best grades?
Both Unity Software Inc. and monday.com Ltd. have received predominantly Buy and Overweight ratings. However, monday.com Ltd. shows a slightly stronger consensus with more Buy and Outperform ratings maintained consistently. This could suggest marginally higher analyst confidence, potentially influencing investor sentiment positively in favor of monday.com Ltd.
Strengths and Weaknesses
Below is a comparison of key strengths and weaknesses for Unity Software Inc. and monday.com Ltd. based on their latest financial and operational data.
| Criterion | Unity Software Inc. (U) | monday.com Ltd. (MNDY) |
|---|---|---|
| Diversification | Moderate product diversification with Create and Operate Solutions generating $1.8B total revenue in 2024 | Limited product segmentation, focused on Work OS platform |
| Profitability | Negative net margin (-36.63%) and declining ROIC (-12.78%), value destroying | Slightly positive net margin (3.33%) and improving ROIC (-1.73%), still value destroying but improving |
| Innovation | Strong innovation in real-time 3D and gaming technology, but profitability issues | Innovative SaaS platform for workflow management, growing profitability trend |
| Global presence | Large global user base, especially in gaming and AR/VR sectors | Growing global adoption in project management and collaboration |
| Market Share | Significant presence in gaming engine market but challenged by profitability | Competitive in SaaS collaboration tools, expanding market share |
Key takeaways: Unity shows strong innovation and global reach but struggles with profitability and value creation. monday.com demonstrates improving profitability and a favorable product focus but faces challenges in achieving consistent high returns. Investors should weigh innovation and growth potential against current financial risks.
Risk Analysis
Below is a comparative table highlighting key risk factors for Unity Software Inc. and monday.com Ltd. based on the most recent 2024 financial data and market conditions.
| Metric | Unity Software Inc. (U) | monday.com Ltd. (MNDY) |
|---|---|---|
| Market Risk | High (Beta 2.05, volatile pricing) | Moderate (Beta 1.26, less volatile) |
| Debt level | Moderate (Debt-to-Equity 0.74) | Low (Debt-to-Equity 0.10) |
| Regulatory Risk | Moderate (US tech regulations) | Moderate (International, Israel-based) |
| Operational Risk | High (Negative margins, high WACC) | Moderate (Low profitability) |
| Environmental Risk | Low (Software industry) | Low (Cloud software services) |
| Geopolitical Risk | Low (US-based) | Moderate (Middle East exposure) |
Unity Software faces significant market risk due to its high beta and negative profitability, reflected in operational challenges and financial distress signals with a 2024 Altman Z-score in the grey zone. monday.com shows more stability with low debt and a safe zone Altman Z-score, but it carries moderate geopolitical risks due to its Israeli headquarters and global exposure. Investors should weigh Unity’s growth potential against its financial vulnerabilities and consider monday.com’s steadier but still cautious profile.
Which Stock to Choose?
Unity Software Inc. (U) shows a declining income trend with a 17.1% revenue drop in 2024, unfavorable profitability and financial ratios, high debt levels, and a very unfavorable global rating despite some favorable liquidity metrics. Its ROIC is well below WACC and declining, indicating value destruction.
monday.com Ltd. (MNDY) presents strong income growth of 33.21% revenue increase in 2024, mixed but more positive financial ratios, low debt, and a moderate overall rating with better liquidity and solvency. Although ROIC remains below WACC, it is growing, suggesting improving profitability.
For investors prioritizing growth and improving profitability, monday.com Ltd. might appear more favorable, while those focused on stability and cautious valuation could view Unity Software’s current financial challenges and rating as signals to watch closely before committing.
Disclaimer: Investment carries a risk of loss of initial capital. The past performance is not a reliable indicator of future results. Be sure to understand risks before making an investment decision.
Go Further
I encourage you to read the complete analyses of Unity Software Inc. and monday.com Ltd. to enhance your investment decisions: