In the dynamic world of household and personal products, Unilever PLC and e.l.f. Beauty, Inc. stand out as prominent players with distinct market positions and innovation strategies. Unilever, a global giant with a broad portfolio, contrasts with e.l.f., a nimble, digitally savvy cosmetics brand targeting younger consumers. This comparison explores which company offers the most compelling investment potential in 2026. Let’s dive into their strengths and opportunities to guide your portfolio choices.
Table of contents
Companies Overview
I will begin the comparison between Unilever PLC and e.l.f. Beauty, Inc. by providing an overview of these two companies and their main differences.
Unilever PLC Overview
Unilever PLC operates as a fast-moving consumer goods company headquartered in London. It focuses on three main segments: Beauty & Personal Care, Foods & Refreshment, and Home Care. Its portfolio includes well-known brands such as Dove, Ben & Jerry’s, and Magnum. With a market cap of approximately 140.6B USD, Unilever serves a broad global market and emphasizes diversified household and personal products.
e.l.f. Beauty, Inc. Overview
e.l.f. Beauty, Inc. is a US-based company specializing in cosmetics and skin care products under brands like e.l.f. Cosmetics and Well People. Founded in 2004 and headquartered in Oakland, California, it sells primarily through retail and direct-to-consumer channels, including e-commerce. With a market cap near 4.9B USD, e.l.f. targets the beauty segment within the consumer defensive sector.
Key similarities and differences
Both companies operate in the Household & Personal Products industry and focus on personal care offerings. Unilever has a broader product range, including food and home care, while e.l.f. specializes exclusively in cosmetics and skin care. Unilever is a longstanding multinational with a large workforce and extensive brand portfolio, whereas e.l.f. is a younger, smaller company focused on direct consumer engagement and digital sales channels.
Income Statement Comparison
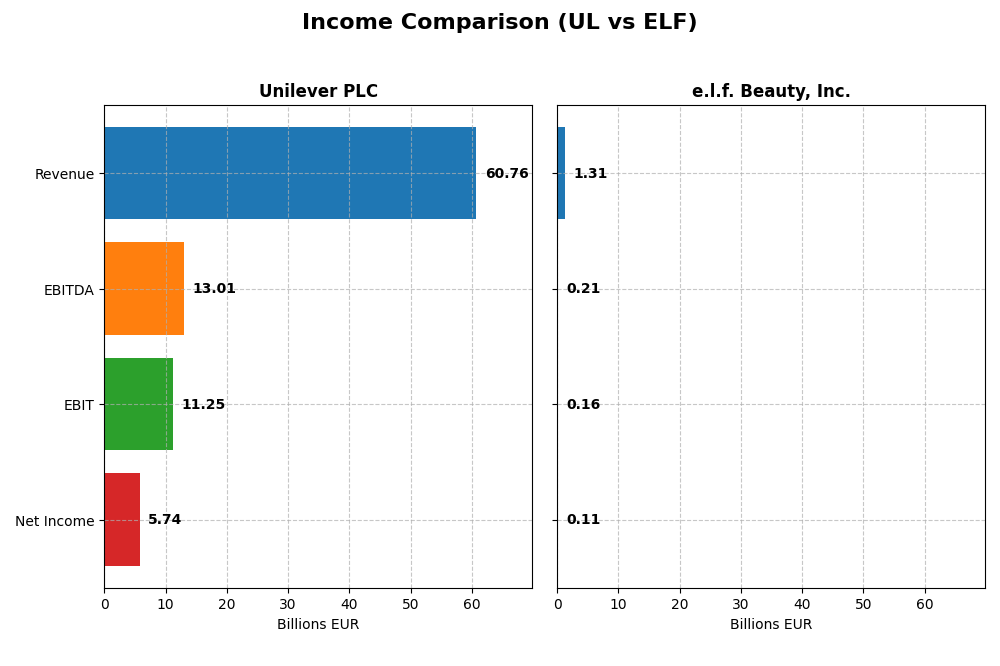
This table presents a side-by-side comparison of the key income statement metrics for Unilever PLC and e.l.f. Beauty, Inc. for their most recent fiscal years.
| Metric | Unilever PLC (UL) | e.l.f. Beauty, Inc. (ELF) |
|---|---|---|
| Market Cap | 140.6B EUR | 4.9B USD |
| Revenue | 60.8B EUR | 1.3B USD |
| EBITDA | 13.0B EUR | 206M USD |
| EBIT | 11.3B EUR | 162M USD |
| Net Income | 5.7B EUR | 112M USD |
| EPS | 2.30 EUR | 1.99 USD |
| Fiscal Year | 2024 | 2025 |
Income Statement Interpretations
Unilever PLC
Unilever’s revenue showed a steady increase from €50.7B in 2020 to €60.8B in 2024, with net income fluctuating but remaining positive, ending at €5.74B in 2024. Margins have been mostly stable, with a gross margin consistently favorable at 100%, but net margin declined by 14.08% over the period. In 2024, revenue growth slowed to 1.94%, and net margin and EPS weakened.
e.l.f. Beauty, Inc.
e.l.f. Beauty’s revenue surged remarkably from $318M in 2021 to $1.31B in 2025, with net income growing from $6.23M to $112M. Margins improved overall, with a gross margin around 71% and net margin at 8.53%, though net margin fell by 31.56% in the last year. The latest year showed strong revenue growth of 28.28%, despite some margin pressure.
Which one has the stronger fundamentals?
Both companies present favorable income statement evaluations, but e.l.f. Beauty exhibits higher revenue and net income growth over the period, alongside improved margins. Unilever demonstrates stability with a higher gross margin and lower interest expense but faces margin declines recently. The fundamentals reflect different growth profiles: steady and large-scale for Unilever, rapid and expanding for e.l.f. Beauty.
Financial Ratios Comparison
The table below presents a side-by-side comparison of key financial ratios for Unilever PLC and e.l.f. Beauty, Inc. based on their most recent fiscal year data.
| Ratios | Unilever PLC (UL) 2024 | e.l.f. Beauty, Inc. (ELF) 2025 |
|---|---|---|
| ROE | 28.7% | 14.7% |
| ROIC | 11.1% | 11.2% |
| P/E | 23.9 | 31.5 |
| P/B | 6.87 | 4.64 |
| Current Ratio | 0.76 | 3.05 |
| Quick Ratio | 0.56 | 2.00 |
| D/E (Debt-to-Equity) | 1.53 | 0.41 |
| Debt-to-Assets | 38.4% | 25.1% |
| Interest Coverage | 8.41 | 9.20 |
| Asset Turnover | 0.76 | 1.05 |
| Fixed Asset Turnover | 5.21 | 45.6 |
| Payout Ratio | 75.2% | 0% |
| Dividend Yield | 3.14% | 0% |
Interpretation of the Ratios
Unilever PLC
Unilever’s ratios present a slightly favorable picture, with a strong return on equity at 28.73% and return on invested capital at 11.12%, supported by a low WACC of 4.42%. However, liquidity ratios such as the current ratio (0.76) and debt-to-equity (1.53) are unfavorable, indicating potential short-term liquidity and leverage concerns. The dividend yield is favorable at 3.14%, reflecting a stable payout supported by free cash flow, though working capital remains negative.
e.l.f. Beauty, Inc.
e.l.f. Beauty shows a neutral ratio profile with several mixed signals. The company has a modest return on equity of 14.73% and an unfavorable WACC of 11.49%, combined with a high price-to-earnings ratio of 31.49. Liquidity is strong, with a current ratio of 3.05 and quick ratio of 2.0, and leverage remains low with a debt-to-equity of 0.41. The company does not pay dividends, likely focusing on growth and reinvestment strategies.
Which one has the best ratios?
Unilever exhibits a more balanced set of favorable ratios, particularly in profitability and dividend yield, despite some liquidity and leverage concerns. e.l.f. Beauty has stronger liquidity and lower leverage but faces challenges with valuation multiples and cost of capital. Overall, Unilever’s ratios are slightly more favorable, reflecting a mature firm with stable shareholder returns compared to e.l.f. Beauty’s mixed profile.
Strategic Positioning
This section compares the strategic positioning of Unilever PLC and e.l.f. Beauty, Inc. regarding Market position, Key segments, and Exposure to technological disruption:
Unilever PLC
- Established global FMCG leader with diversified segments faces moderate competitive pressure.
- Operates in Beauty & Personal Care, Foods & Refreshment, and Home Care segments.
- Exposure limited by traditional FMCG model; no specific technological disruption noted.
e.l.f. Beauty, Inc.
- Smaller, niche cosmetics player with higher volatility and competitive challenges.
- Focused on cosmetics and skin care products sold via retail and direct-to-consumer.
- No explicit exposure to technological disruption detailed in provided data.
Unilever PLC vs e.l.f. Beauty, Inc. Positioning
Unilever’s diversified portfolio across multiple consumer goods sectors contrasts with e.l.f.’s concentrated focus on cosmetics and skin care. Unilever benefits from scale and broad market presence, while e.l.f. targets growth in niche segments but faces higher beta and market volatility.
Which has the best competitive advantage?
Unilever demonstrates a slightly favorable moat with positive value creation despite declining profitability, indicating a more stable competitive advantage. e.l.f. shows a slightly unfavorable moat due to value destruction but improving profitability, reflecting a less established advantage.
Stock Comparison
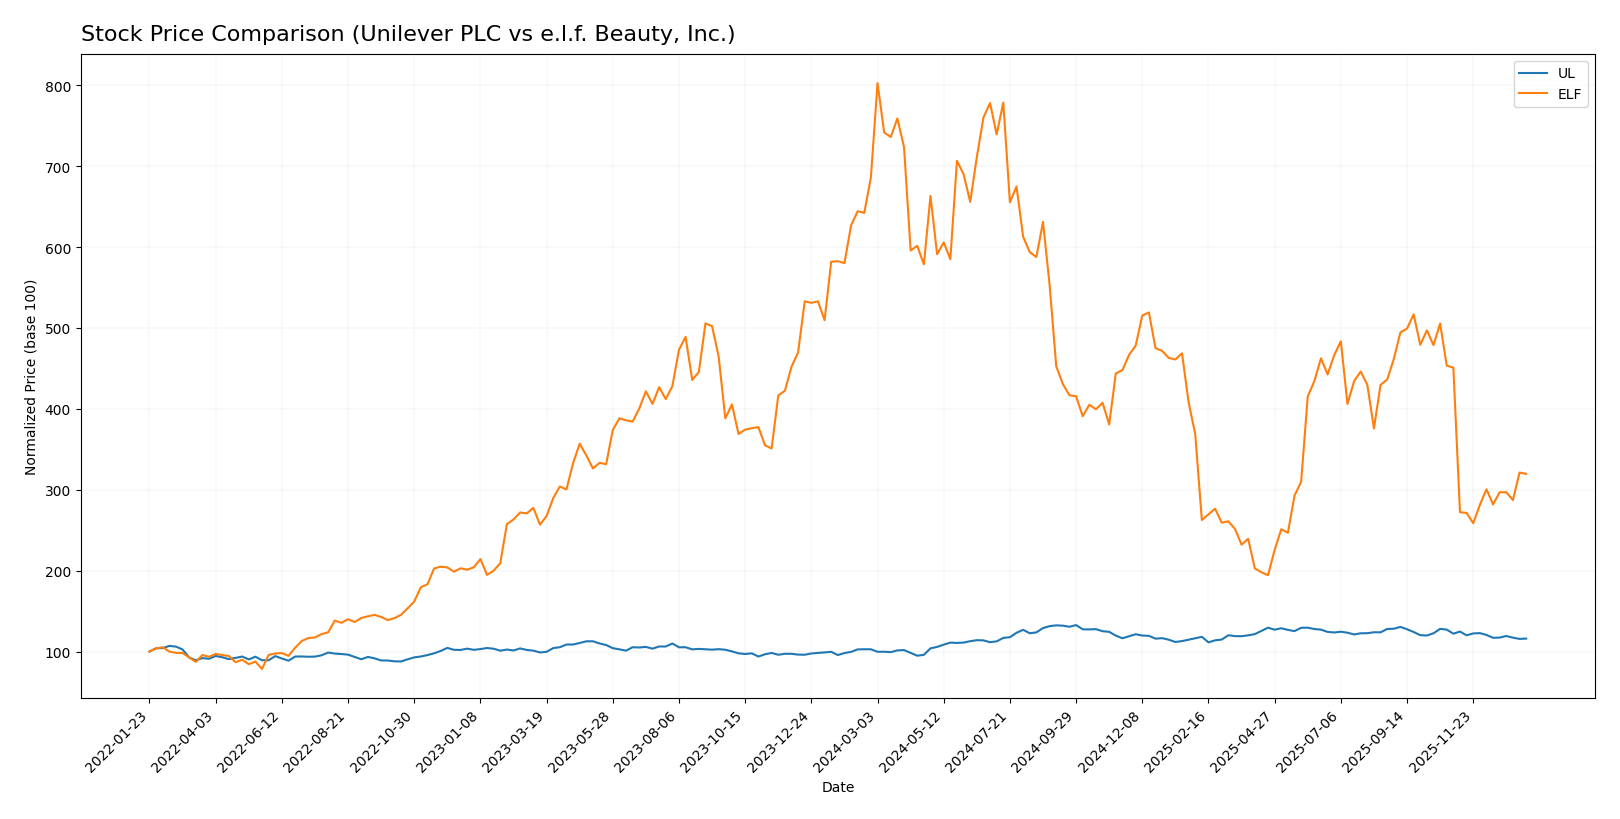
The stock price movements over the past 12 months reveal a clear divergence between Unilever PLC and e.l.f. Beauty, Inc., with Unilever showing steady gains while e.l.f. Beauty experiences significant declines and heightened volatility.
Trend Analysis
Unilever PLC’s stock demonstrated a bullish trend with a 12.92% price increase over the past year, accompanied by decelerating gains and moderate volatility (std deviation 4.86). Recent months showed a slight bearish correction of -4.96%.
e.l.f. Beauty, Inc. faced a sharp bearish trend, declining 53.44% over the same period, with accelerating losses and high volatility (std deviation 43.02). The recent period intensified this downtrend, losing 29.11%.
Comparing both stocks, Unilever PLC delivered the highest market performance, maintaining overall gains versus e.l.f. Beauty’s substantial and accelerating losses.
Target Prices
The consensus target prices for these consumer goods companies reflect moderate to strong upside potential.
| Company | Target High | Target Low | Consensus |
|---|---|---|---|
| Unilever PLC | 71.00 | 60.10 | 65.55 |
| e.l.f. Beauty, Inc. | 165.00 | 85.00 | 128.17 |
Analysts expect Unilever’s stock price to stay near its current level with modest upside, as the consensus target slightly exceeds the current price of 64.42 USD. e.l.f. Beauty shows more significant upside potential, with a consensus target well above its current 86.58 USD price, indicating bullish sentiment.
Analyst Opinions Comparison
This section compares analysts’ ratings and grades for Unilever PLC and e.l.f. Beauty, Inc.:
Rating Comparison
Unilever PLC Rating
- Rating: B+, classified as Very Favorable
- Discounted Cash Flow Score: 5, Very Favorable
- Return on Equity Score: 5, Very Favorable
- Return on Assets Score: 4, Favorable
- Debt To Equity Score: 1, Very Unfavorable
- Overall Score: 3, Moderate
e.l.f. Beauty, Inc. Rating
- Rating: C+, also classified as Very Favorable
- Discounted Cash Flow Score: 3, Moderate
- Return on Equity Score: 3, Moderate
- Return on Assets Score: 3, Moderate
- Debt To Equity Score: 2, Moderate
- Overall Score: 2, Moderate
Which one is the best rated?
Based strictly on the provided data, Unilever PLC holds higher ratings and stronger scores in discounted cash flow, ROE, and ROA compared to e.l.f. Beauty, Inc., although it has a weaker debt-to-equity score. Overall, Unilever is better rated.
Scores Comparison
The scores of Unilever PLC and e.l.f. Beauty, Inc. are compared below based on their Altman Z-Score and Piotroski Score:
UL Scores
- Altman Z-Score: 4.85, indicating a safe zone with low bankruptcy risk.
- Piotroski Score: 6, categorized as average financial strength.
ELF Scores
- Altman Z-Score: 3.44, also in the safe zone but closer to the grey area.
- Piotroski Score: 5, showing average financial strength, slightly below UL.
Which company has the best scores?
Unilever PLC has higher scores in both the Altman Z-Score and Piotroski Score compared to e.l.f. Beauty, indicating relatively stronger financial health and lower bankruptcy risk based on the provided data.
Grades Comparison
The following is an overview of the recent grades assigned to Unilever PLC and e.l.f. Beauty, Inc.:
Unilever PLC Grades
This table summarizes the latest grades given by reputable financial institutions for Unilever PLC:
| Grading Company | Action | New Grade | Date |
|---|---|---|---|
| Erste Group | Downgrade | Hold | 2024-11-19 |
| B of A Securities | Upgrade | Buy | 2024-08-22 |
| JP Morgan | Upgrade | Overweight | 2024-05-23 |
| Argus Research | Maintain | Buy | 2024-05-08 |
| Morgan Stanley | Downgrade | Underweight | 2024-02-27 |
| Bernstein | Upgrade | Market Perform | 2022-03-14 |
| Bernstein | Upgrade | Market Perform | 2022-03-13 |
| Bernstein | Upgrade | Market Perform | 2021-11-01 |
| Bernstein | Upgrade | Market Perform | 2021-10-31 |
| Deutsche Bank | Downgrade | Hold | 2021-09-16 |
Unilever PLC’s grades show a mix of upgrades and downgrades, with a general trend toward maintaining a Hold consensus.
e.l.f. Beauty, Inc. Grades
Below are the recent grades for e.l.f. Beauty, Inc. from recognized grading companies:
| Grading Company | Action | New Grade | Date |
|---|---|---|---|
| Piper Sandler | Maintain | Neutral | 2025-12-22 |
| JP Morgan | Maintain | Overweight | 2025-12-18 |
| Goldman Sachs | Maintain | Buy | 2025-11-07 |
| Baird | Maintain | Outperform | 2025-11-06 |
| Jefferies | Maintain | Buy | 2025-11-06 |
| Piper Sandler | Downgrade | Neutral | 2025-11-06 |
| UBS | Maintain | Neutral | 2025-11-06 |
| Canaccord Genuity | Maintain | Buy | 2025-11-06 |
| JP Morgan | Maintain | Overweight | 2025-11-06 |
| Jefferies | Maintain | Buy | 2025-10-28 |
The grades for e.l.f. Beauty, Inc. largely reflect positive sentiment with consistent Buy and Outperform ratings, resulting in a Buy consensus.
Which company has the best grades?
e.l.f. Beauty, Inc. has received generally stronger grades than Unilever PLC, reflected by more Buy and Outperform ratings. This could indicate higher analyst confidence in e.l.f. Beauty’s growth prospects, potentially influencing investors seeking growth opportunities.
Strengths and Weaknesses
Below is a comparison of key strengths and weaknesses for Unilever PLC (UL) and e.l.f. Beauty, Inc. (ELF) based on the most recent financial and strategic data.
| Criterion | Unilever PLC (UL) | e.l.f. Beauty, Inc. (ELF) |
|---|---|---|
| Diversification | Highly diversified global consumer goods portfolio with strong brand recognition | More focused product range in beauty sector, less diversified |
| Profitability | Creating value with ROIC 6.7% above WACC, but profitability declining | Currently shedding value with ROIC slightly below WACC, yet improving profitability trend |
| Innovation | Established R&D and innovation in sustainability and product lines | Agile and innovative in digital marketing and product launches |
| Global presence | Strong global footprint in multiple regions | Limited international presence, mainly North America |
| Market Share | Large market share in personal care and household products | Growing market share in the affordable beauty segment |
Key takeaways: Unilever offers diversification and a strong global presence with solid profitability despite a declining trend. e.l.f. Beauty shows improving profitability and innovation but remains less diversified and focused on a smaller market. Investors should weigh Unilever’s stability against e.l.f.’s growth potential.
Risk Analysis
The table below summarizes key risk factors for Unilever PLC and e.l.f. Beauty, Inc. in 2026:
| Metric | Unilever PLC (UL) | e.l.f. Beauty, Inc. (ELF) |
|---|---|---|
| Market Risk | Low beta (0.22), stable FMCG sector exposure | High beta (1.72), more volatile cosmetics market |
| Debt level | High debt-to-equity (1.53), interest coverage strong (10.06) | Low debt-to-equity (0.41), manageable leverage |
| Regulatory Risk | Moderate due to global operations and food/health regulations | Moderate, focused on cosmetics regulation mainly in US |
| Operational Risk | Large scale with complex supply chain, some liquidity constraints (current ratio 0.76) | Smaller scale, strong liquidity (current ratio 3.05), but higher market volatility |
| Environmental Risk | Exposure due to global footprint; sustainability initiatives ongoing | Emerging risk, growing focus on eco-friendly products |
| Geopolitical Risk | Moderate, with exposure to Brexit and emerging markets | Lower, mainly US-centric but with some international distribution |
Unilever’s most impactful risks relate to its high debt level and operational complexity despite stable market risk due to a low beta. e.l.f. Beauty faces higher market volatility and regulatory risks but benefits from lower leverage. Investors should weigh Unilever’s financial stability against its debt burden, while e.l.f.’s growth potential comes with higher price volatility.
Which Stock to Choose?
Unilever PLC (UL) shows a favorable income statement with 9.45% net margin and strong profitability ratios, including a 28.73% ROE. Despite a slightly declining ROIC trend, it maintains value creation above WACC. Debt levels and liquidity ratios are unfavorable, but the overall rating is very favorable (B+).
e.l.f. Beauty, Inc. (ELF) presents robust revenue and net income growth, with a favorable income statement overall. However, its ROIC is below WACC, indicating value destruction despite improving profitability. Liquidity and debt ratios are mixed, and the rating is moderate (C+), reflecting some financial challenges.
Investors focused on stability and value creation might find Unilever’s slightly favorable moat and solid rating more aligned with their profile, while those seeking growth and willing to accept higher risk could view e.l.f. Beauty’s strong income growth and improving profitability as potential opportunities.
Disclaimer: Investment carries a risk of loss of initial capital. The past performance is not a reliable indicator of future results. Be sure to understand risks before making an investment decision.
Go Further
I encourage you to read the complete analyses of Unilever PLC and e.l.f. Beauty, Inc. to enhance your investment decisions: