In today’s fast-evolving technology landscape, Zscaler, Inc. and UiPath Inc. stand out as leaders in software infrastructure, each driving innovation in cloud security and robotic process automation respectively. Both companies operate in overlapping markets focused on digital transformation, making their strategies and growth potential highly relevant for investors. This article will analyze their strengths and challenges to help you decide which stock deserves a place in your portfolio.

Table of contents
Companies Overview
I will begin the comparison between Zscaler and UiPath by providing an overview of these two companies and their main differences.
Zscaler Overview
Zscaler, Inc. operates as a cloud security company, offering solutions that secure user access to externally managed applications, including SaaS and private cloud environments. Its platform includes digital experience measurement and workload segmentation to prevent threats and ensure compliance. Headquartered in San Jose, California, Zscaler serves a diverse range of industries such as financial services, healthcare, and telecommunications, positioning itself as a key player in infrastructure software security.
UiPath Overview
UiPath Inc. provides an end-to-end automation platform specializing in robotic process automation (RPA). The company’s software integrates AI and low-code environments to help organizations discover, build, and manage automated workflows. Based in New York City, UiPath primarily serves banking, healthcare, and government sectors, focusing on enhancing operational efficiency through automation and offering complementary professional services such as training and implementation.
Key similarities and differences
Both Zscaler and UiPath operate within the software infrastructure industry, focusing on enterprise solutions that improve operational performance. However, Zscaler emphasizes cloud security and threat prevention, while UiPath centers on automation and process efficiency through RPA. Both companies serve large, diverse client bases but target different technological needs—security versus automation—reflecting distinct yet complementary business models in the technology sector.
Income Statement Comparison
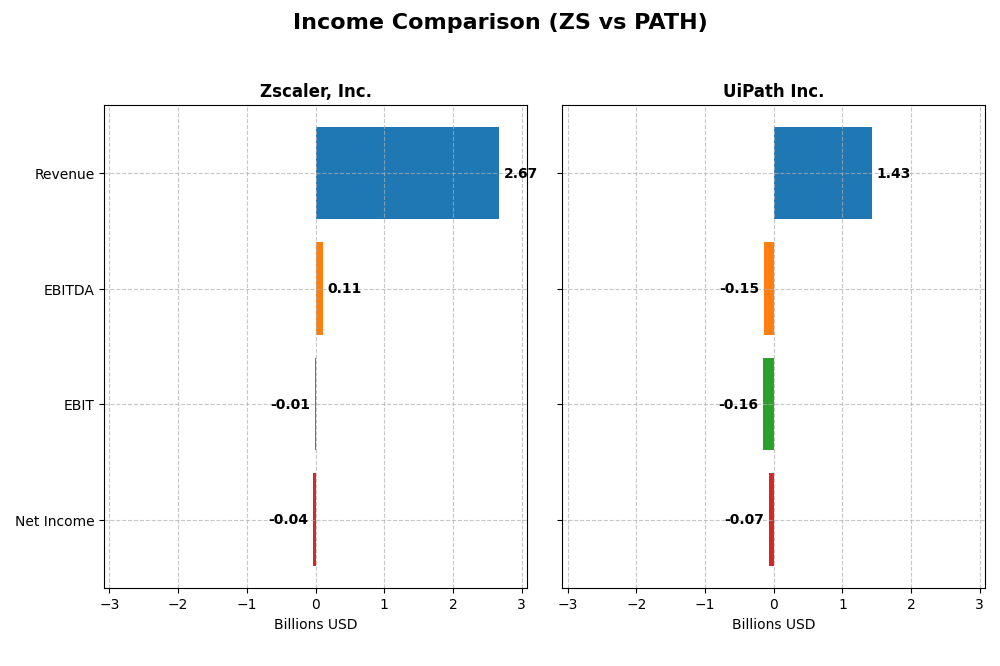
The table below provides a side-by-side comparison of the most recent fiscal year income statement figures for Zscaler, Inc. and UiPath Inc., focusing on key financial metrics.
| Metric | Zscaler, Inc. (ZS) | UiPath Inc. (PATH) |
|---|---|---|
| Market Cap | 34.1B | 7.7B |
| Revenue | 2.67B | 1.43B |
| EBITDA | 112M | -145M |
| EBIT | -8.8M | -163M |
| Net Income | -41.5M | -73.7M |
| EPS | -0.27 | -0.13 |
| Fiscal Year | 2025 | 2025 |
Income Statement Interpretations
Zscaler, Inc.
Zscaler, Inc. demonstrated strong revenue growth from 2021 to 2025, increasing from $673M to $2.67B, with gross margins remaining robust near 77%. Despite persistent net losses, the company improved net income and EBIT margins notably in 2025. The latest fiscal year showed 23.3% revenue growth and a 41.7% increase in net margin, signaling improving operational efficiency and profitability trends.
UiPath Inc.
UiPath Inc. also recorded consistent revenue growth over 2021-2025, rising from $608M to $1.43B, with an impressive gross margin of 82.7% in 2025. However, its EBIT and net margins remained negative, though net margin improved by nearly 25% in the latest year. Revenue growth slowed to 9.3% in 2025, while EBIT growth was largely flat, indicating a more cautious profitability trajectory.
Which one has the stronger fundamentals?
Both companies exhibit favorable income statement fundamentals, with strong gross margins and improving net margins. Zscaler shows higher revenue and net income growth rates and a more pronounced margin recovery. UiPath maintains higher gross margins but slower overall growth and less EBIT improvement. Zscaler’s income statement displays a slightly stronger positive momentum in recent years.
Financial Ratios Comparison
Below is a comparison of key financial ratios for Zscaler, Inc. (ZS) and UiPath Inc. (PATH) based on their most recent fiscal year data.
| Ratios | Zscaler, Inc. (2025) | UiPath Inc. (2025) |
|---|---|---|
| ROE | -2.31% | -3.99% |
| ROIC | -3.18% | -7.41% |
| P/E | -1063 | -108 |
| P/B | 24.51 | 4.31 |
| Current Ratio | 2.01 | 2.93 |
| Quick Ratio | 2.01 | 2.93 |
| D/E (Debt-to-Equity) | 1.00 | 0.04 |
| Debt-to-Assets | 27.98% | 2.72% |
| Interest Coverage | -13.49 | 0 |
| Asset Turnover | 0.42 | 0.50 |
| Fixed Asset Turnover | 4.22 | 14.41 |
| Payout Ratio | 0 | 0 |
| Dividend Yield | 0 | 0 |
Interpretation of the Ratios
Zscaler, Inc.
Zscaler shows a mixed ratio profile with 35.71% favorable and 50% unfavorable metrics, leading to a slightly unfavorable overall view. Key concerns include negative net margin (-1.55%) and return on equity (-2.31%), alongside weak interest coverage (-0.92). The current and quick ratios at 2.01 are strong, suggesting good short-term liquidity. The company does not pay dividends, likely reflecting its focus on reinvestment and growth.
UiPath Inc.
UiPath presents a slightly better ratio distribution with 42.86% favorable but similarly 50% unfavorable ratios, indicating a slightly unfavorable stance. It faces significant profitability challenges, such as a -5.15% net margin and -3.99% ROE, but maintains a robust current ratio of 2.93 and low leverage with debt-to-equity at 0.04. Like Zscaler, UiPath pays no dividends, consistent with its growth and reinvestment strategy.
Which one has the best ratios?
Both companies face profitability and coverage challenges with negative margins and returns, impacting their financial health. UiPath edges Zscaler slightly in favorable ratio percentages and leverage metrics, but both are rated slightly unfavorable overall. Liquidity is sound for both, and neither pays dividends, reflecting growth priorities over shareholder returns.
Strategic Positioning
This section compares the strategic positioning of Zscaler and UiPath, focusing on market position, key segments, and exposure to technological disruption:
Zscaler, Inc. (ZS)
- Leading cloud security provider with global presence; faces competitive pressure in cybersecurity space.
- Focuses on cloud security solutions, workload segmentation, digital experience; serves multiple industries globally.
- Operates in a fast-evolving cloud security industry requiring continuous innovation to address emerging cyber threats.
UiPath Inc. (PATH)
- Provider of end-to-end robotic process automation platform; competes in automation software market.
- Concentrates on RPA software licenses, subscriptions, and professional services, serving banking, healthcare, government.
- Relies on AI-driven automation technologies, vulnerable to rapid changes in AI and software development trends.
Zscaler vs UiPath Positioning
Zscaler pursues a diversified approach across cloud security and multiple sectors, offering broad solutions; UiPath concentrates on automation software with focused segments. Zscaler’s broader market may mitigate risks, while UiPath’s specialization could face higher disruption risk.
Which has the best competitive advantage?
Both companies have slightly unfavorable MOAT ratings, shedding value despite growing ROIC trends. Neither currently demonstrates a strong economic moat, suggesting limited competitive advantage based on capital efficiency.
Stock Comparison
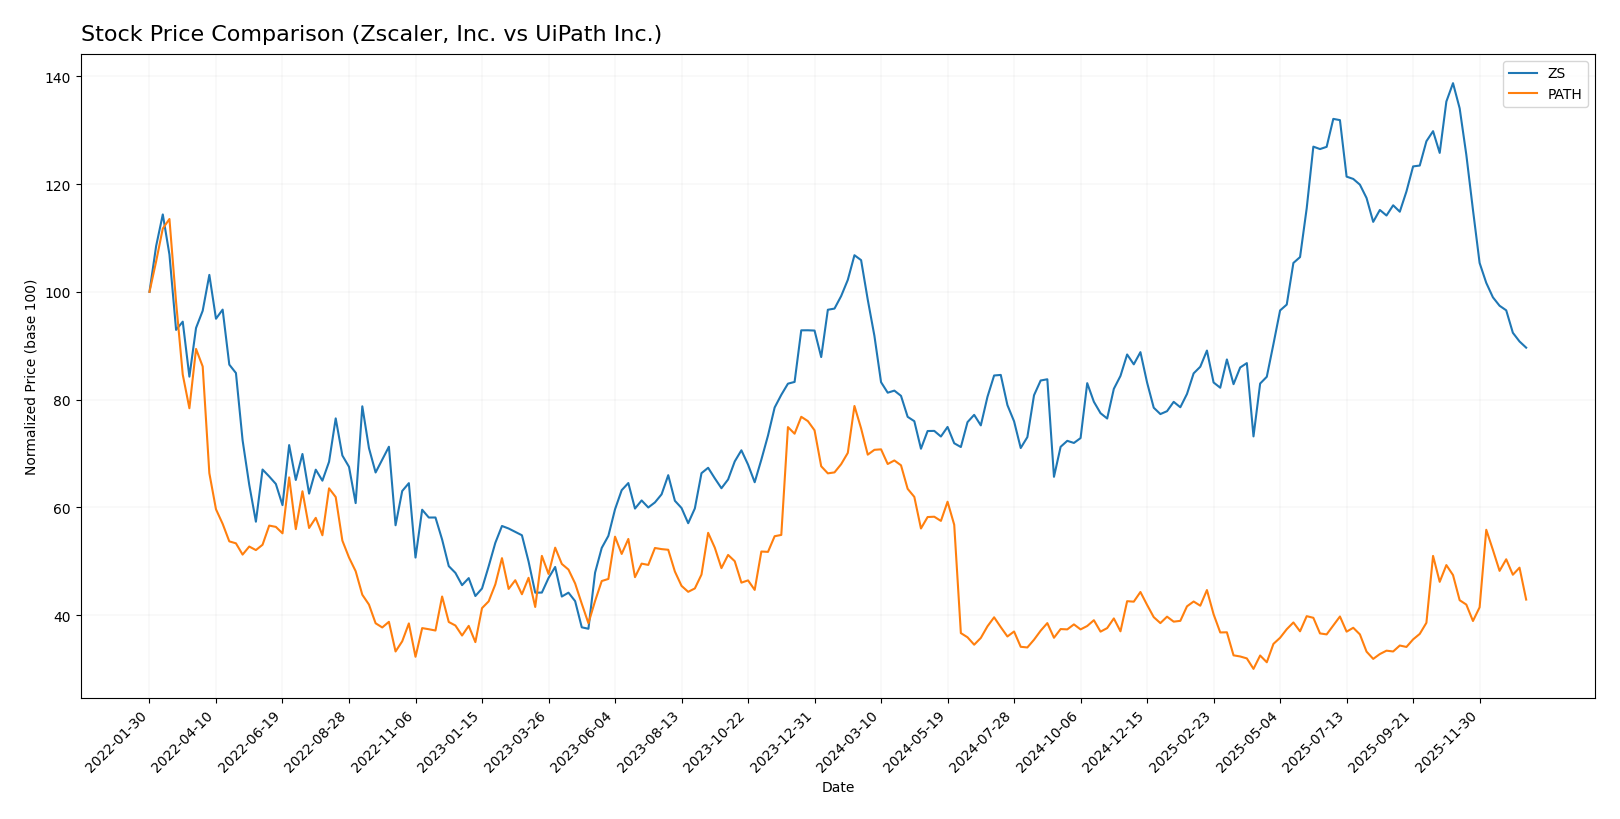
The stock prices of Zscaler, Inc. (ZS) and UiPath Inc. (PATH) have exhibited notable bearish trends over the past 12 months, with significant declines and shifting trading volumes impacting their market dynamics.
Trend Analysis
Zscaler, Inc. (ZS) experienced a 9.03% price decline over the past year, indicating a bearish trend with decelerating losses. The stock showed high volatility, with prices ranging from 156.78 to 331.14 and a standard deviation of 47.11.
UiPath Inc. (PATH) recorded a sharper 38.53% price decrease in the same period, also bearish but with accelerating downward momentum. Its price fluctuated between 10.04 and 23.66, with lower volatility reflected by a 3.33 standard deviation.
Comparing both, ZS outperformed PATH in relative terms, as its price decline was less severe, making ZS the stronger performer despite both stocks trending downward.
Target Prices
The current analyst consensus indicates optimistic target prices for both Zscaler, Inc. and UiPath Inc.
| Company | Target High | Target Low | Consensus |
|---|---|---|---|
| Zscaler, Inc. | 360 | 260 | 311.41 |
| UiPath Inc. | 19 | 14 | 16.6 |
Analysts expect Zscaler’s stock to rise significantly above its current price of 214, suggesting strong growth potential. UiPath’s consensus target is also above its current price of 14.34, indicating moderate upside according to market experts.
Analyst Opinions Comparison
This section compares analysts’ ratings and grades for Zscaler, Inc. and UiPath Inc.:
Rating Comparison
ZS Rating
- Rating: C- reflecting a very favorable overall rating despite some concerns.
- Discounted Cash Flow Score: 4, showing a favorable valuation based on cash flow.
- ROE Score: 1, very unfavorable, indicating poor profit generation from equity.
- ROA Score: 1, very unfavorable, poor asset utilization.
- Debt To Equity Score: 1, very unfavorable, indicating higher financial risk.
- Overall Score: 1, very unfavorable overall financial health indicator.
PATH Rating
- Rating: B+ indicating a very favorable overall standing.
- Discounted Cash Flow Score: 3, moderate valuation based on future cash flow.
- ROE Score: 4, favorable, showing efficient profit generation from equity.
- ROA Score: 4, favorable, effective use of assets to generate earnings.
- Debt To Equity Score: 4, favorable, reflecting lower financial risk.
- Overall Score: 3, moderate overall financial health indicator.
Which one is the best rated?
Based strictly on the data, PATH is better rated than ZS, with a higher overall score (3 vs. 1) and superior scores in ROE, ROA, and debt-to-equity, reflecting stronger financial health and profitability.
Scores Comparison
Here is a comparison of the Altman Z-Score and Piotroski Score for Zscaler, Inc. and UiPath Inc.:
ZS Scores
- Altman Z-Score: 4.89, in safe zone, low bankruptcy risk.
- Piotroski Score: 3, very weak financial strength indication.
PATH Scores
- Altman Z-Score: 5.27, in safe zone, low bankruptcy risk.
- Piotroski Score: 7, strong financial strength indication.
Which company has the best scores?
UiPath exhibits stronger financial health with a higher Piotroski Score of 7 compared to Zscaler’s 3, while both have similar safe zone Altman Z-Scores, indicating low bankruptcy risk.
Grades Comparison
Here is the comparison of the latest reliable grades provided by recognized financial institutions for Zscaler, Inc. and UiPath Inc.:
Zscaler, Inc. Grades
The following table summarizes recent grades and actions by major grading companies for Zscaler, Inc.:
| Grading Company | Action | New Grade | Date |
|---|---|---|---|
| Citigroup | Maintain | Buy | 2026-01-13 |
| Keybanc | Maintain | Overweight | 2026-01-12 |
| Piper Sandler | Maintain | Neutral | 2026-01-05 |
| RBC Capital | Maintain | Outperform | 2026-01-05 |
| Mizuho | Upgrade | Outperform | 2025-12-16 |
| Bernstein | Downgrade | Market Perform | 2025-12-01 |
| Citigroup | Maintain | Buy | 2025-12-01 |
| JP Morgan | Maintain | Overweight | 2025-11-26 |
| Baird | Maintain | Outperform | 2025-11-26 |
| BTIG | Maintain | Buy | 2025-11-26 |
Zscaler has received predominantly positive and stable grades, with several institutions maintaining Buy/Outperform ratings and only one recent downgrade to Market Perform.
UiPath Inc. Grades
Below is the recent grading summary for UiPath Inc. by verified grading firms:
| Grading Company | Action | New Grade | Date |
|---|---|---|---|
| Barclays | Maintain | Equal Weight | 2026-01-12 |
| RBC Capital | Maintain | Sector Perform | 2026-01-05 |
| RBC Capital | Maintain | Sector Perform | 2025-12-10 |
| Morgan Stanley | Maintain | Equal Weight | 2025-12-09 |
| DA Davidson | Maintain | Neutral | 2025-12-05 |
| Canaccord Genuity | Maintain | Buy | 2025-12-04 |
| Mizuho | Maintain | Neutral | 2025-12-04 |
| RBC Capital | Maintain | Sector Perform | 2025-12-04 |
| Wells Fargo | Maintain | Equal Weight | 2025-12-04 |
| Evercore ISI Group | Maintain | In Line | 2025-12-04 |
UiPath’s grades are mostly neutral to moderate, with the consensus skewing towards Hold and Sector Perform ratings, reflecting a more cautious stance.
Which company has the best grades?
Zscaler, Inc. has received stronger and more consistent positive grades compared to UiPath Inc., which mostly holds neutral or moderate ratings. Investors may interpret Zscaler’s better grades as a signal of higher confidence from analysts, potentially impacting portfolio decisions differently than UiPath’s more cautious outlook.
Strengths and Weaknesses
Below is a comparative overview of the strengths and weaknesses of Zscaler, Inc. (ZS) and UiPath Inc. (PATH) based on recent financial and operational data.
| Criterion | Zscaler, Inc. (ZS) | UiPath Inc. (PATH) |
|---|---|---|
| Diversification | Primarily focused on cloud security with $2.67B revenue; limited product diversification. | More diversified with License, Subscription Services, and Professional Services totaling ~$1.46B revenue. |
| Profitability | Negative net margin (-1.55%) and ROIC (-3.18%); slightly unfavorable profitability. | Larger negative net margin (-5.15%) and ROIC (-7.41%); profitability challenges more pronounced. |
| Innovation | Strong innovation in cloud security; improving ROIC trend (+76%). | Innovative in automation software; ROIC improving (+65%) but still negative. |
| Global presence | Significant global presence in cybersecurity market. | Global footprint in RPA/automation sector expanding. |
| Market Share | Leading player in cloud security niche; high fixed asset turnover (4.22). | Growing market share in automation; very high fixed asset turnover (14.41). |
Key takeaways: Both companies are currently shedding value with negative profitability metrics, yet they demonstrate improving ROIC trends, signaling potential future profitability. Zscaler shows strong focus and leadership in cloud security, while UiPath offers more product diversification and rapid asset utilization. Caution and close monitoring of their profitability path remain essential.
Risk Analysis
Below is a comparison of key risks for Zscaler, Inc. and UiPath Inc. based on the most recent data available for 2025.
| Metric | Zscaler, Inc. (ZS) | UiPath Inc. (PATH) |
|---|---|---|
| Market Risk | Beta 1.02 (moderate volatility) | Beta 1.08 (moderate volatility) |
| Debt Level | Debt-to-Equity 1.0 (neutral) | Debt-to-Equity 0.04 (low risk) |
| Regulatory Risk | Moderate (tech/cloud sector regulation) | Moderate (automation/software sector) |
| Operational Risk | High (negative net margin and ROE) | High (negative net margin and ROE) |
| Environmental Risk | Low (software industry, limited impact) | Low (software industry, limited impact) |
| Geopolitical Risk | Moderate (US-based, global customers) | Moderate (US-based, global customers) |
The most significant risks for both companies are operational, reflecting negative profitability margins and returns on equity. Zscaler carries more debt, increasing financial risk, while UiPath’s low debt reduces this concern. Market volatility remains moderate for both, and regulatory or geopolitical risks are manageable but warrant monitoring.
Which Stock to Choose?
Zscaler, Inc. (ZS) shows strong income growth with a 297% revenue increase over five years and improved profitability metrics, despite negative net margins and returns on equity. Its financial ratios are slightly unfavorable overall, with solid liquidity and manageable debt, but low profitability indicators, and it holds a very favorable rating with some score weaknesses.
UiPath Inc. (PATH) also demonstrates favorable income growth, with 135% revenue growth over five years and positive trends in net margin and EPS growth. Its financial ratios are slightly unfavorable but better than ZS in debt management and asset turnover, supported by a favorable rating and stronger financial scores indicating less distress risk.
For investors prioritizing growth, ZS’s rapid income expansion and improving profitability might appear attractive, whereas those valuing financial stability and lower leverage could find PATH’s stronger balance sheet and higher financial scores more reassuring. Each stock’s slightly unfavorable financial ratios and value destruction signals suggest careful consideration of risk profiles and investment goals.
Disclaimer: Investment carries a risk of loss of initial capital. The past performance is not a reliable indicator of future results. Be sure to understand risks before making an investment decision.
Go Further
I encourage you to read the complete analyses of Zscaler, Inc. and UiPath Inc. to enhance your investment decisions: