In the rapidly evolving software infrastructure sector, UiPath Inc. and Wix.com Ltd. stand out as influential players driving innovation. UiPath focuses on robotic process automation, streamlining complex workflows with AI-driven tools, while Wix empowers millions globally with user-friendly web development platforms. Both companies leverage cutting-edge technology and target diverse markets, making their comparison compelling. Join me as we analyze which company offers the most promising opportunity for your investment portfolio.
Table of contents
Companies Overview
I will begin the comparison between UiPath Inc. and Wix.com Ltd. by providing an overview of these two companies and their main differences.
UiPath Inc. Overview
UiPath Inc. operates in the software infrastructure industry, offering an end-to-end automation platform focused on robotic process automation (RPA). Its mission centers on enabling organizations to automate complex processes through AI-driven tools that combine desktop recording, process mining, and low-code development environments. Headquartered in New York, UiPath serves sectors like banking, healthcare, and government, emphasizing enterprise automation management and compliance.
Wix.com Ltd. Overview
Wix.com Ltd. is a technology company that develops a cloud-based platform for website and web application creation. Its mission is to empower users globally to build, automate, and grow their online presence using tools like drag-and-drop editors, AI-powered design, and integrated business services. Based in Tel Aviv, Wix serves millions of registered users worldwide, offering solutions that include e-commerce, customer support, and payment processing.
Key similarities and differences
Both UiPath and Wix operate in the software infrastructure sector, leveraging technology to enhance business efficiency and user engagement. UiPath specializes in automation primarily for enterprise clients, while Wix targets individual users and small businesses with web development tools. UiPath’s platform emphasizes AI-driven robotic process automation, whereas Wix provides a broad suite of creative and business management applications for online presence and commerce.
Income Statement Comparison
The table below compares the key income statement metrics for UiPath Inc. and Wix.com Ltd. for their most recent fiscal years, providing a snapshot of their financial performance.
| Metric | UiPath Inc. (PATH) | Wix.com Ltd. (WIX) |
|---|---|---|
| Market Cap | 7.67B | 4.46B |
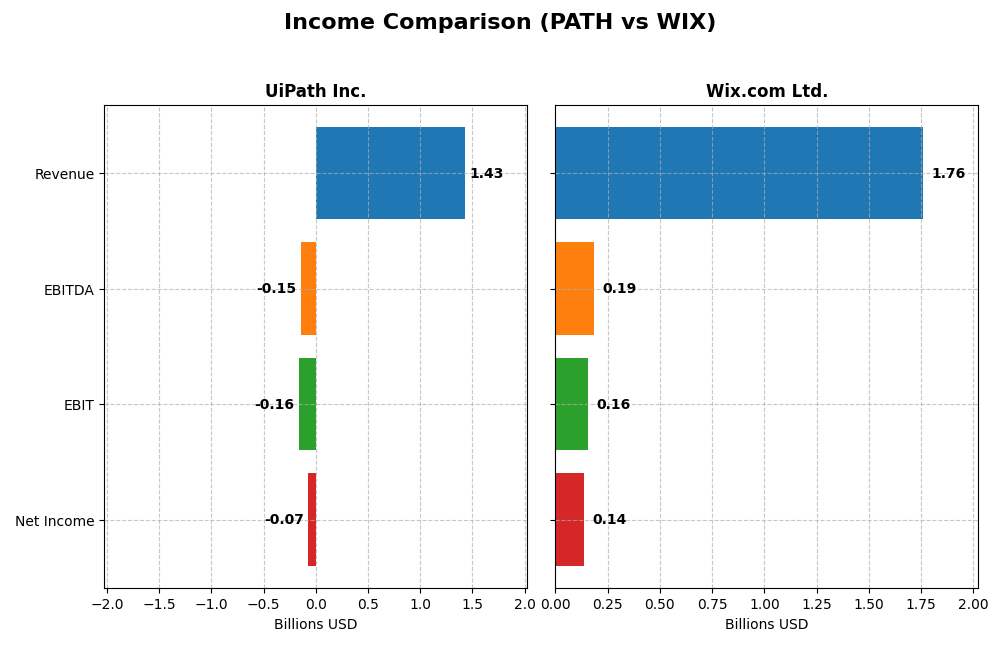
| Revenue | 1.43B | 1.76B |
| EBITDA | -145M | 186M |
| EBIT | -163M | 155M |
| Net Income | -74M | 138M |
| EPS | -0.13 | 2.49 |
| Fiscal Year | 2025 | 2024 |
Income Statement Interpretations
UiPath Inc.
UiPath’s revenue surged from $608M in 2021 to $1.43B in 2025, reflecting strong growth of over 135% across five years. Despite high gross margins near 83%, net income remained negative, though losses narrowed from -$524M in 2022 to -$74M in 2025. The latest year showed improved net margins and EPS, signaling stabilizing profitability prospects amid rising operating expenses.
Wix.com Ltd.
Wix exhibited consistent revenue growth from $984M in 2020 to $1.76B in 2024, with gross margins steady around 68%. Profitability turned positive recently, with net income rising to $138M in 2024 from losses in prior years. The firm’s EBIT margin improved notably to 8.8% in 2024, supported by controlled expenses and robust growth in net margin and EPS over the last year.
Which one has the stronger fundamentals?
Wix demonstrates stronger fundamentals with sustained revenue growth and a clear transition to profitability, reflected in positive net income and EBIT margins. UiPath shows faster revenue growth but remains unprofitable, though it has improved margins and reduced losses recently. Wix’s consistent margin expansion and profitability contrast with UiPath’s ongoing net losses, indicating more favorable income statement metrics at present.
Financial Ratios Comparison
The table below presents a side-by-side comparison of key financial ratios for UiPath Inc. and Wix.com Ltd., based on their most recent fiscal year data, providing insight into their profitability, liquidity, leverage, and efficiency metrics.
| Ratios | UiPath Inc. (PATH) | Wix.com Ltd. (WIX) |
|---|---|---|
| ROE | -4.0% | -175.6% |
| ROIC | -7.4% | 9.1% |
| P/E | -108.0 | 86.2 |
| P/B | 4.31 | -151.35 |
| Current Ratio | 2.93 | 0.84 |
| Quick Ratio | 2.93 | 0.84 |
| D/E (Debt to Equity) | 0.042 | -12.31 |
| Debt-to-Assets | 2.7% | 50.7% |
| Interest Coverage | 0 | 25.9 |
| Asset Turnover | 0.50 | 0.92 |
| Fixed Asset Turnover | 14.41 | 3.33 |
| Payout ratio | 0 | 0 |
| Dividend yield | 0 | 0 |
Interpretation of the Ratios
UiPath Inc.
UiPath exhibits mixed financial ratios with a slightly unfavorable overall evaluation. Positive indicators include a strong current and quick ratio around 2.93, low debt-to-equity at 0.04, and a high fixed asset turnover of 14.41, signaling efficient asset use. However, the company faces challenges with negative net margin (-5.15%), return on equity (-3.99%), and return on invested capital (-7.41%). UiPath does not pay dividends, reflecting its reinvestment strategy and growth phase focus.
Wix.com Ltd.
Wix.com shows a slightly unfavorable ratio profile with some neutral and favorable aspects. The company has a favorable price-to-book ratio (-151.35) and strong interest coverage (40.14), but a weak current ratio of 0.84 and high debt-to-assets at 50.7% raise concerns. Net margin is modestly positive at 7.86%, while return on equity is deeply negative (-175.57%). Wix.com does not pay dividends, consistent with its emphasis on growth and reinvestment.
Which one has the best ratios?
Both UiPath and Wix.com present slightly unfavorable overall ratio evaluations, but UiPath has a higher proportion of favorable liquidity and leverage ratios, suggesting better short-term financial stability. Wix.com benefits from strong interest coverage and asset turnover but is hindered by weaker liquidity and higher debt levels. Neither company pays dividends, reflecting their growth-oriented strategies.
Strategic Positioning
This section compares the strategic positioning of UiPath Inc. and Wix.com Ltd. across Market position, Key segments, and Exposure to technological disruption:
UiPath Inc.
- Market position and competitive pressure
- Key segments and business drivers
- Exposure to technological disruption
Wix.com Ltd.
- Market cap of 7.67B, operates in automation software with global competition
- Focus on RPA licenses, subscription services, and professional services
- Combines AI with automation, low-code environments, and enterprise governance
UiPath Inc. vs Wix.com Ltd. Positioning
UiPath’s strategy is concentrated on robotic process automation with strong AI integration, while Wix has a more diversified cloud platform targeting website creation and online business tools. UiPath’s focus on enterprise automation contrasts with Wix’s broad user base and multiple product lines.
Which has the best competitive advantage?
Both companies are currently shedding value as ROIC is below WACC but show growing profitability. Their economic moats are slightly unfavorable, reflecting challenges in sustaining a competitive advantage despite increasing returns.
Stock Comparison
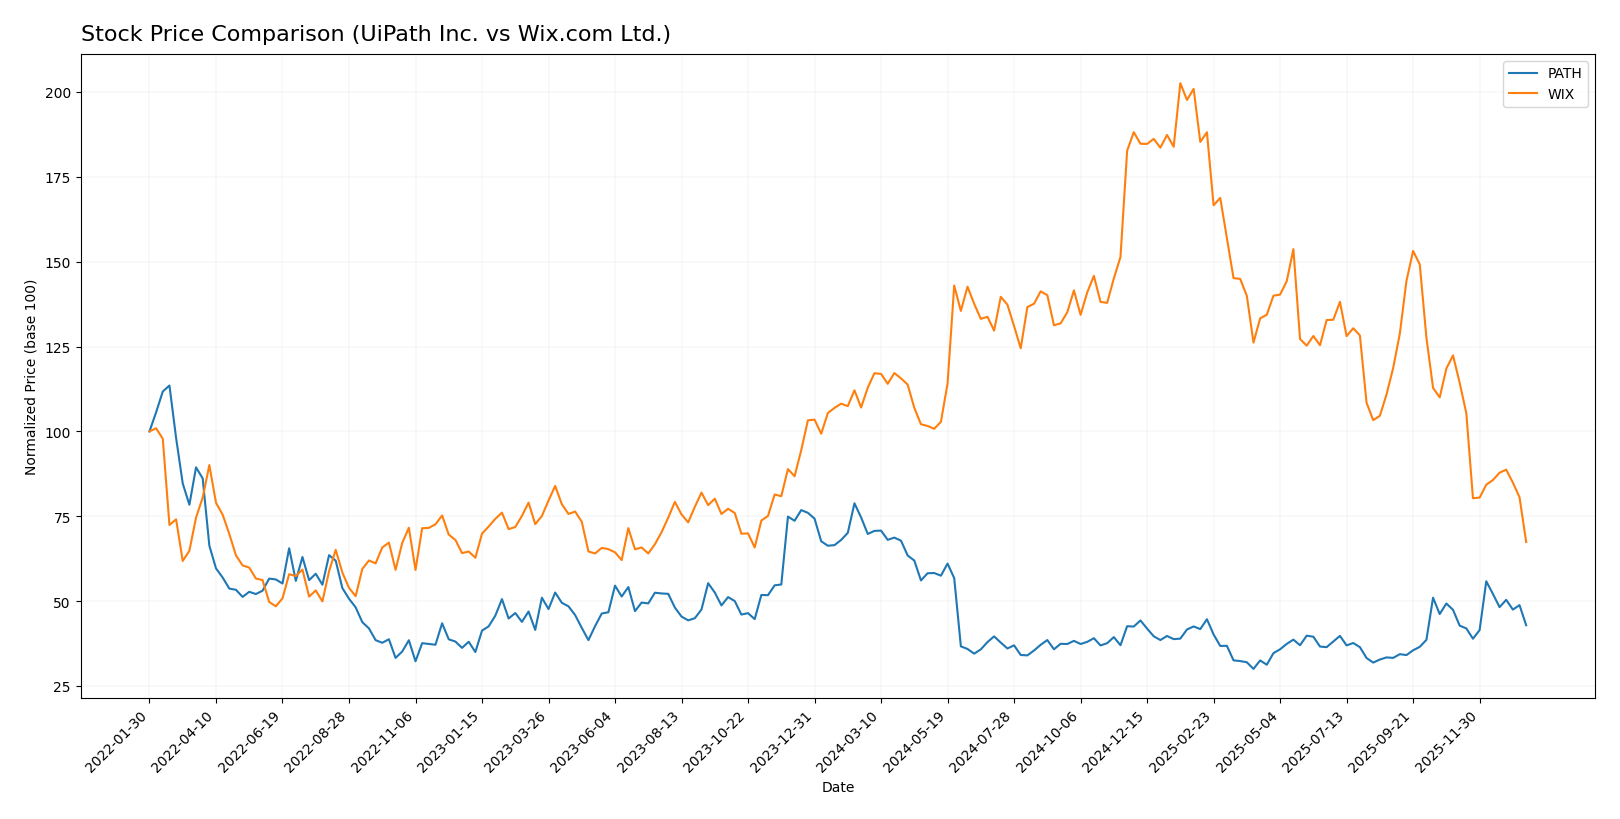
The stock price dynamics over the past year reveal significant bearish trends for both UiPath Inc. and Wix.com Ltd., with marked declines and contrasting volatility patterns shaping investor sentiment.
Trend Analysis
UiPath Inc. experienced a bearish trend with a 38.53% price decline over the past 12 months, showing accelerating downward momentum and moderate volatility with a standard deviation of 3.33. The stock hit a high of 23.66 and a low of 10.04 during this period.
Wix.com Ltd. also followed a bearish trajectory, with a 40.28% decrease in price over the last year, but its decline shows deceleration and much higher volatility, evidenced by a standard deviation of 34.39. The stock fluctuated between 240.89 and 80.16.
Comparing both stocks, UiPath Inc. delivered a slightly better market performance with a less severe decline than Wix.com Ltd., which faced a steeper drop and greater price volatility over the same timeframe.
Target Prices
The consensus target prices for UiPath Inc. and Wix.com Ltd. reflect cautious optimism among analysts.
| Company | Target High | Target Low | Consensus |
|---|---|---|---|
| UiPath Inc. | 19 | 14 | 16.6 |
| Wix.com Ltd. | 210 | 70 | 160.27 |
Analysts expect UiPath’s stock to trade moderately above its current price of 14.34 USD, while Wix’s consensus target significantly exceeds its current price of 80.16 USD, indicating stronger growth expectations for Wix.
Analyst Opinions Comparison
This section compares analysts’ ratings and grades for UiPath Inc. and Wix.com Ltd.:
Rating Comparison
UiPath Inc. Rating
- Rating: B+ indicating a very favorable evaluation.
- Discounted Cash Flow Score: 3, moderate valuation risk.
- ROE Score: 4, favorable efficiency in generating profit from equity.
- ROA Score: 4, favorable asset utilization for earnings.
- Debt To Equity Score: 4, favorable financial stability with low reliance on debt.
- Overall Score: 3, moderate overall financial standing.
Wix.com Ltd. Rating
- Rating: C with a very unfavorable evaluation.
- Discounted Cash Flow Score: 3, moderate valuation risk.
- ROE Score: 1, very unfavorable profit generation from equity.
- ROA Score: 4, favorable asset utilization for earnings.
- Debt To Equity Score: 1, very unfavorable financial stability with high debt.
- Overall Score: 2, moderate overall financial standing.
Which one is the best rated?
Based strictly on the provided data, UiPath Inc. is better rated than Wix.com Ltd., showing stronger scores in ROE, debt management, and an overall more favorable rating. Wix has weaker financial stability and profitability metrics.
Scores Comparison
Here is a comparison of the Altman Z-Score and Piotroski Score for the two companies:
UiPath Inc. Scores
- Altman Z-Score: 5.27, indicating a safe zone.
- Piotroski Score: 7, classified as strong.
Wix.com Ltd. Scores
- Altman Z-Score: 1.83, indicating a grey zone.
- Piotroski Score: 6, classified as average.
Which company has the best scores?
UiPath has a higher Altman Z-Score in the safe zone and a stronger Piotroski Score compared to Wix, which is in the grey zone with an average Piotroski Score.
Grades Comparison
Here is the detailed grades comparison for UiPath Inc. and Wix.com Ltd.:
UiPath Inc. Grades
The following table summarizes recent grades from reputable financial institutions for UiPath Inc.:
| Grading Company | Action | New Grade | Date |
|---|---|---|---|
| Barclays | Maintain | Equal Weight | 2026-01-12 |
| RBC Capital | Maintain | Sector Perform | 2026-01-05 |
| RBC Capital | Maintain | Sector Perform | 2025-12-10 |
| Morgan Stanley | Maintain | Equal Weight | 2025-12-09 |
| DA Davidson | Maintain | Neutral | 2025-12-05 |
| Canaccord Genuity | Maintain | Buy | 2025-12-04 |
| Mizuho | Maintain | Neutral | 2025-12-04 |
| RBC Capital | Maintain | Sector Perform | 2025-12-04 |
| Wells Fargo | Maintain | Equal Weight | 2025-12-04 |
| Evercore ISI Group | Maintain | In Line | 2025-12-04 |
UiPath’s grades mostly cluster around “Equal Weight,” “Sector Perform,” and “Neutral,” indicating a cautious stance with limited upward momentum.
Wix.com Ltd. Grades
Below is the compilation of recent grades from recognized grading firms for Wix.com Ltd.:
| Grading Company | Action | New Grade | Date |
|---|---|---|---|
| Morgan Stanley | Maintain | Overweight | 2026-01-15 |
| Wells Fargo | Maintain | Overweight | 2025-12-19 |
| Cantor Fitzgerald | Maintain | Overweight | 2025-12-11 |
| Wells Fargo | Maintain | Overweight | 2025-11-20 |
| Barclays | Maintain | Overweight | 2025-11-20 |
| Citizens | Maintain | Market Outperform | 2025-11-20 |
| Citigroup | Maintain | Buy | 2025-11-20 |
| Scotiabank | Maintain | Sector Outperform | 2025-11-20 |
| Needham | Maintain | Buy | 2025-11-20 |
| Evercore ISI Group | Maintain | Outperform | 2025-11-20 |
Wix.com Ltd. consistently receives strong positive ratings, mostly “Overweight,” “Buy,” and “Outperform,” signaling greater analyst confidence.
Which company has the best grades?
Wix.com Ltd. holds generally superior grades compared to UiPath Inc., with a consensus leaning toward “Buy” versus UiPath’s “Hold.” This suggests stronger analyst optimism for Wix, which could influence investor sentiment and portfolio allocation decisions.
Strengths and Weaknesses
Below is a comparison of key strengths and weaknesses for UiPath Inc. (PATH) and Wix.com Ltd. (WIX) based on their most recent financial and operational data.
| Criterion | UiPath Inc. (PATH) | Wix.com Ltd. (WIX) |
|---|---|---|
| Diversification | Moderate: Revenue mainly from Subscription Services (801M in 2025), with License and Professional Services contributing less | Moderate: Revenue split between Creative Subscription (1.26B in 2024) and Business Solutions (496M), showing some product mix |
| Profitability | Weak: Negative net margin (-5.15%) and ROIC (-7.41%) indicate current value destruction | Mixed: Positive net margin (7.86%) but negative ROE (-175.57%) and neutral ROIC (9.13%) show uneven profitability |
| Innovation | Strong ROIC growth trend (+65%) suggests improving operational efficiency and innovation | Strong ROIC growth trend (+159%) reflects effective innovation and business model adaptation |
| Global presence | Strong: Leading in Robotic Process Automation with broad international reach | Strong: Well-established global platform for website creation and online business tools |
| Market Share | Significant in automation software but challenged by competitive pressures | Leading in SMB website platforms, continuously expanding market share |
Key takeaways: Both companies face challenges in profitability with slightly unfavorable moat ratings, yet they demonstrate strong growth in ROIC, indicating improving efficiency and potential for value creation. PATH excels in innovation related to automation, while WIX’s diversified subscription services support steady revenue growth. Investors should weigh current value destruction against future growth prospects.
Risk Analysis
Below is a comparative table of key risk factors for UiPath Inc. (PATH) and Wix.com Ltd. (WIX) based on the most recent data available for 2025 and 2024 respectively:
| Metric | UiPath Inc. (PATH) | Wix.com Ltd. (WIX) |
|---|---|---|
| Market Risk | Beta 1.08, moderate volatility | Beta 1.42, higher volatility |
| Debt level | Very low debt-to-equity (0.04) | High debt-to-assets (50.7%) |
| Regulatory Risk | Moderate, US & international compliance | Moderate, operating globally with regulatory complexity |
| Operational Risk | Moderate, relies on AI and cloud infrastructure | Moderate, dependent on platform stability and user growth |
| Environmental Risk | Low, software sector with limited direct impact | Low, primarily digital services |
| Geopolitical Risk | Moderate, exposure mainly US, Romania, Japan | Higher, headquartered in Israel with broad international reach |
UiPath’s low debt and strong liquidity mitigate financial risk, making operational execution and market adoption the largest concerns. Wix faces elevated financial risk due to significant debt levels and geopolitical exposure, which could impact stability amid global uncertainties. Both companies operate in dynamic tech sectors with inherent market volatility.
Which Stock to Choose?
UiPath Inc. (PATH) shows a favorable income evolution with 9.3% revenue growth in the last year and a 135.28% increase over 2021-2025. Despite unfavorable profitability and some negative returns on equity and assets, PATH maintains a strong current ratio of 2.93 and low debt levels, earning a very favorable B+ rating. The company’s ROIC is below WACC, indicating value destruction, but the ROIC trend is improving.
Wix.com Ltd. (WIX) reports steady income growth with 12.74% revenue rise last year and 78.86% over 2020-2024. Profitability is more favorable with a positive net margin of 7.86%, but the company faces challenges like a low current ratio of 0.84 and high debt-to-assets ratio of 50.7%. WIX holds a very favorable C rating, though its ROIC is slightly below WACC, also signaling value destruction but with rising profitability.
The choice between PATH and WIX may appear to depend on investor profiles: growth-oriented investors might lean towards PATH, given its strong revenue gains and improving profitability despite current losses. Conversely, investors favoring more stable income and profitability metrics could find WIX’s consistent net margin and cash flow yields more appealing, though its higher leverage and weaker liquidity call for caution. Both companies show slightly unfavorable economic moats but positive ROIC trends.
Disclaimer: Investment carries a risk of loss of initial capital. The past performance is not a reliable indicator of future results. Be sure to understand risks before making an investment decision.
Go Further
I encourage you to read the complete analyses of UiPath Inc. and Wix.com Ltd. to enhance your investment decisions: