In today’s rapidly evolving technology landscape, UiPath Inc. and Veritone, Inc. stand out as innovators in the software infrastructure sector, specializing in automation and artificial intelligence. UiPath leads with robotic process automation, while Veritone focuses on AI-driven data insights. Their overlapping markets and cutting-edge innovation strategies make them compelling choices for investors. This article will help you decide which company presents the most attractive investment opportunity in 2026.

Table of contents
Companies Overview
I will begin the comparison between UiPath and Veritone by providing an overview of these two companies and their main differences.
UiPath Overview
UiPath Inc. offers an end-to-end automation platform specializing in robotic process automation (RPA). Headquartered in New York City, it provides software that integrates AI with process mining, low-code development, and automation management tools. Its platform serves industries such as banking, healthcare, and government, aiming to optimize workflows by combining attended and unattended automation modes across enterprise environments.
Veritone Overview
Veritone, Inc., based in Denver, Colorado, delivers AI computing solutions through its aiWARE platform, which leverages machine learning and cognitive processes to extract insights from complex data sets. The company focuses on media advertising and various sectors including government and legal compliance. Veritone also offers media agency services alongside its AI technology, serving markets primarily in the US and the UK.
Key similarities and differences
Both UiPath and Veritone operate within the software infrastructure industry with a focus on AI-driven technologies. UiPath centers on robotic process automation to streamline business workflows, while Veritone emphasizes AI-powered data analytics and media services. UiPath is significantly larger in market cap and workforce, reflecting a broader enterprise automation focus, whereas Veritone targets niche AI applications and advertising solutions with a smaller scale and higher stock volatility.
Income Statement Comparison
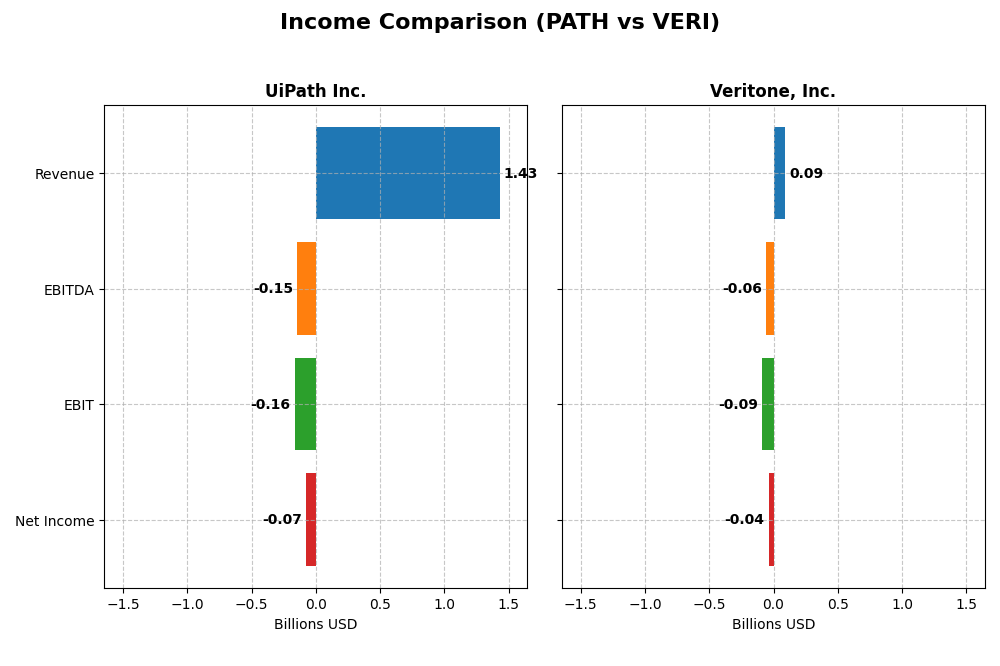
This table compares the most recent fiscal year income statement metrics for UiPath Inc. and Veritone, Inc., providing a snapshot of their financial performance in 2025 and 2024 respectively.
| Metric | UiPath Inc. (PATH) | Veritone, Inc. (VERI) |
|---|---|---|
| Market Cap | 7.67B | 225M |
| Revenue | 1.43B | 93M |
| EBITDA | -145M | -59M |
| EBIT | -163M | -88M |
| Net Income | -74M | -37M |
| EPS | -0.13 | -0.98 |
| Fiscal Year | 2025 | 2024 |
Income Statement Interpretations
UiPath Inc.
UiPath’s revenue showed strong growth from 607M in 2021 to nearly 1.43B in 2025, with net income losses narrowing from -92M to -74M. Gross margins remained stable and favorable at 82.7%. The latest year saw a 9.3% revenue increase and a 25% improvement in net margin, indicating improving profitability despite continued operating losses.
Veritone, Inc.
Veritone’s revenue grew overall from 58M in 2020 to 93M in 2024 but dipped 7.4% in the last year. Net losses improved from -48M to -37M but margins remain weak with a negative net margin near -40%. Gross margin was favorable at 70.6%. The latest year experienced declines in revenue and EBIT, though net margin and EPS showed year-over-year improvement.
Which one has the stronger fundamentals?
UiPath demonstrates stronger fundamentals with superior revenue scale, higher gross margins, consistent revenue growth, and improving net margin trends. Veritone faces more volatility and higher losses with less consistent revenue growth and unfavorable interest expense. UiPath’s financials suggest a more stable operational trajectory despite ongoing losses.
Financial Ratios Comparison
Below is a comparison of the most recent financial ratios for UiPath Inc. (PATH) and Veritone, Inc. (VERI) for fiscal year 2025 and 2024 respectively, highlighting key performance and financial health metrics.
| Ratios | UiPath Inc. (PATH) FY2025 | Veritone, Inc. (VERI) FY2024 |
|---|---|---|
| ROE | -3.99% | -277.91% |
| ROIC | -7.41% | -58.27% |
| P/E | -108.04 | -3.34 |
| P/B | 4.31 | 9.27 |
| Current Ratio | 2.93 | 0.97 |
| Quick Ratio | 2.93 | 0.97 |
| D/E (Debt-to-Equity) | 0.04 | 8.91 |
| Debt-to-Assets | 2.72% | 60.54% |
| Interest Coverage | 0 | -7.31 |
| Asset Turnover | 0.50 | 0.47 |
| Fixed Asset Turnover | 14.41 | 8.51 |
| Payout ratio | 0 | 0 |
| Dividend yield | 0 | 0 |
Interpretation of the Ratios
UiPath Inc.
UiPath exhibits a mixed ratio profile with a slightly unfavorable overall rating. While liquidity ratios like current and quick ratios at 2.93 are favorable, the company shows weak profitability metrics, such as negative net margin (-5.15%) and return on equity (-3.99%). Debt levels are low, but interest coverage is zero. UiPath does not pay dividends, likely reflecting its reinvestment strategy and growth focus.
Veritone, Inc.
Veritone’s financial ratios are predominantly unfavorable, with a very unfavorable global assessment. It suffers from low liquidity (current ratio 0.97) and high leverage (debt to equity 8.91, debt to assets 60.54%). Profitability is poor, with net margin at -40.36% and return on equity at -277.91%. The company also does not pay dividends, possibly due to ongoing losses and prioritization of R&D and expansion.
Which one has the best ratios?
Between the two, UiPath presents a stronger financial ratio profile with more favorable metrics, particularly in liquidity and leverage, compared to Veritone’s weaker profitability, high debt, and liquidity challenges. Both companies show negative returns and no dividend payouts, but UiPath’s ratios suggest a relatively more stable financial position.
Strategic Positioning
This section compares the strategic positioning of UiPath Inc. and Veritone, Inc. in terms of market position, key segments, and exposure to technological disruption:
UiPath Inc.
- Large market cap of 7.7B USD in software infrastructure with moderate beta of 1.08.
- Focuses on robotic process automation (RPA) with license, subscription, and professional services revenues.
- Combines AI with automation tools but no explicit mention of disruptive technology threats.
Veritone, Inc.
- Small market cap of 225M USD with higher beta of 2.05 in software infrastructure.
- Provides AI computing solutions and media advertising services with diverse revenue streams.
- AI platform uses advanced machine learning but faces challenges from rapid tech changes.
UiPath Inc. vs Veritone, Inc. Positioning
UiPath exhibits a more concentrated approach centered on RPA and automation software with a large market presence, while Veritone pursues a diversified AI and media services model but with smaller scale and higher volatility. UiPath’s positioning benefits from scale but may face competitive pressure in automation.
Which has the best competitive advantage?
Neither company currently demonstrates a strong economic moat; UiPath shows slightly unfavorable value creation with improving profitability, whereas Veritone faces very unfavorable conditions with declining returns and shrinking profitability.
Stock Comparison
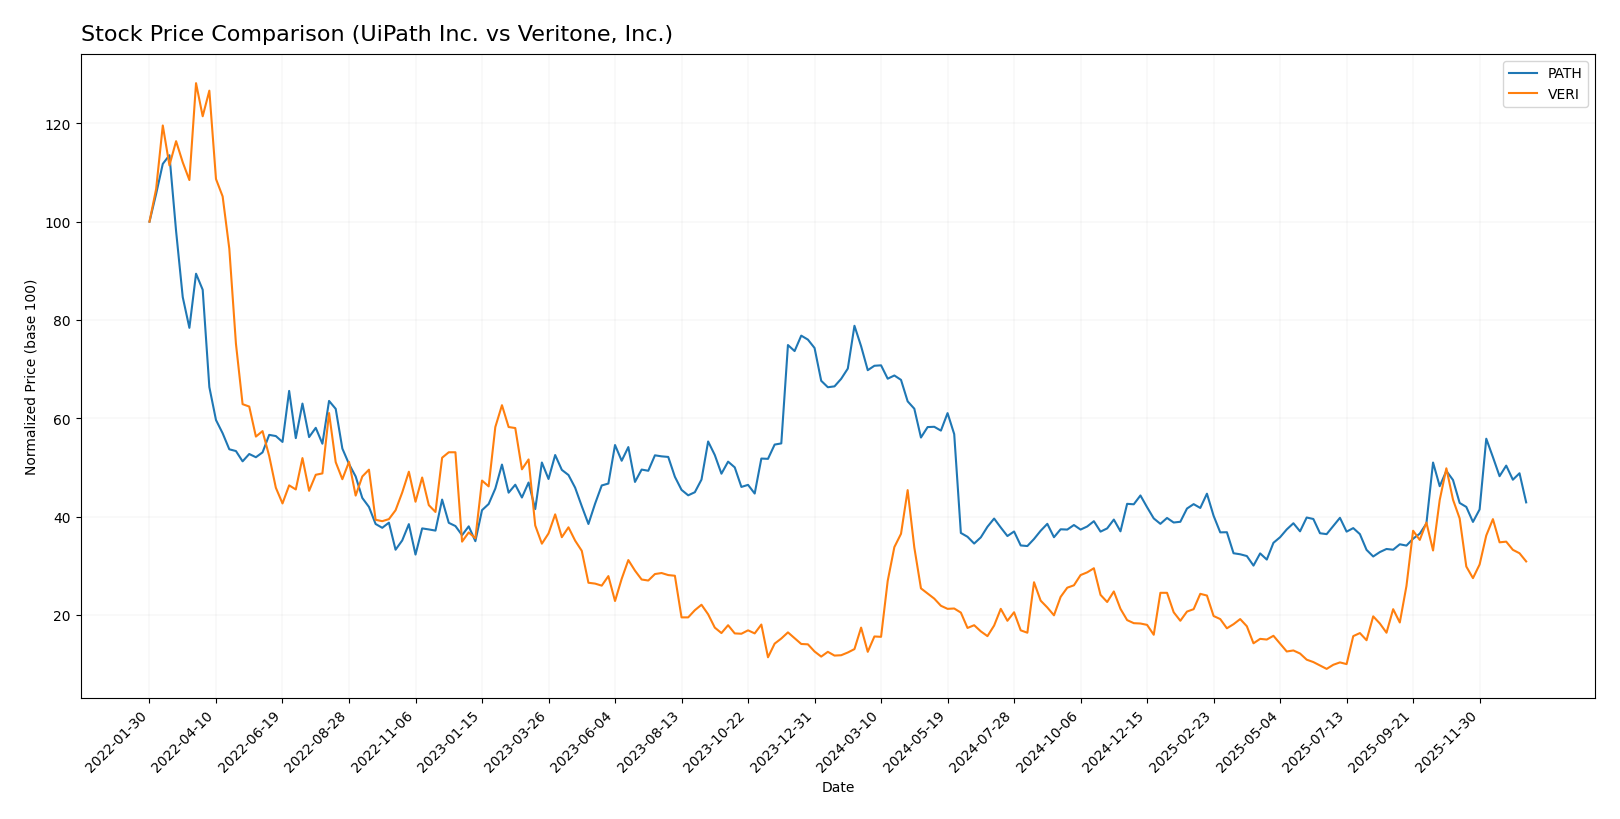
The stock price chart over the past 12 months highlights significant divergences in performance and trading dynamics between UiPath Inc. and Veritone, Inc., with contrasting overall trends and recent market behavior.
Trend Analysis
UiPath Inc. (PATH) shows a bearish trend with a 38.53% price decline over the past year, marked by accelerating downward momentum and higher volatility at 3.33 std deviation. The stock reached a high of 23.66 and a low of 10.04.
Veritone, Inc. (VERI) experienced a bullish trend over the past year with a 147.22% price increase, although recent months show a deceleration and a 28.91% decline. Volatility remains lower at 1.26 std deviation, with prices ranging from 1.3 to 7.18.
Comparing both stocks, Veritone delivered the highest market performance over the 12-month period despite recent corrections, outperforming UiPath’s sustained bearish trend and accelerated decline.
Target Prices
The current analyst consensus presents moderate upside potential for these technology infrastructure companies.
| Company | Target High | Target Low | Consensus |
|---|---|---|---|
| UiPath Inc. | 19 | 14 | 16.6 |
| Veritone, Inc. | 10 | 9 | 9.5 |
UiPath’s consensus target price of 16.6 suggests a potential gain from the current 14.34 USD price, while Veritone’s consensus at 9.5 significantly exceeds its current 4.45 USD price, indicating expectations of strong recovery or growth.
Analyst Opinions Comparison
This section compares analysts’ ratings and grades for UiPath Inc. and Veritone, Inc.:
Rating Comparison
UiPath Inc. Rating
- Rating: B+ indicating a very favorable overall evaluation by analysts.
- Discounted Cash Flow Score: Moderate score of 3, reflecting fair valuation outlook.
- ROE Score: Favorable 4, showing efficient profit generation from equity.
- ROA Score: Favorable 4, demonstrating effective asset utilization.
- Debt To Equity Score: Favorable 4, suggesting a strong balance sheet with low leverage.
- Overall Score: Moderate 3, summarizing a balanced financial standing.
Veritone, Inc. Rating
- Rating: C with a very favorable overall evaluation status, despite a lower grade.
- Discounted Cash Flow Score: Very favorable 5, indicating strong undervaluation potential.
- ROE Score: Very unfavorable 1, indicating poor profit efficiency from equity.
- ROA Score: Very unfavorable 1, reflecting weak asset earnings performance.
- Debt To Equity Score: Very unfavorable 1, indicating higher financial risk.
- Overall Score: Moderate 2, indicating a lower overall financial assessment.
Which one is the best rated?
Based on the provided data, UiPath Inc. holds a higher rating (B+) and better scores in ROE, ROA, and debt-to-equity, while Veritone shows a stronger discounted cash flow score but lower overall and profitability scores. UiPath is better rated overall.
Scores Comparison
The following table presents a comparison of UiPath Inc. and Veritone, Inc. based on their Altman Z-Score and Piotroski Score:
UiPath Inc. Scores
- Altman Z-Score of 5.27 indicates a safe zone, low bankruptcy risk.
- Piotroski Score of 7 shows strong financial health and value potential.
Veritone, Inc. Scores
- Altman Z-Score of -0.07 places the company in distress zone.
- Piotroski Score of 3 reflects very weak financial strength.
Which company has the best scores?
UiPath Inc. clearly outperforms Veritone, Inc. with a strong Altman Z-Score in the safe zone and a robust Piotroski Score, while Veritone’s scores indicate financial distress and weak strength.
Grades Comparison
Here is a detailed comparison of the recent grades assigned to UiPath Inc. and Veritone, Inc.:
UiPath Inc. Grades
The following table summarizes recent grades from major grading firms for UiPath Inc.:
| Grading Company | Action | New Grade | Date |
|---|---|---|---|
| Barclays | Maintain | Equal Weight | 2026-01-12 |
| RBC Capital | Maintain | Sector Perform | 2026-01-05 |
| RBC Capital | Maintain | Sector Perform | 2025-12-10 |
| Morgan Stanley | Maintain | Equal Weight | 2025-12-09 |
| DA Davidson | Maintain | Neutral | 2025-12-05 |
| Canaccord Genuity | Maintain | Buy | 2025-12-04 |
| Mizuho | Maintain | Neutral | 2025-12-04 |
| RBC Capital | Maintain | Sector Perform | 2025-12-04 |
| Wells Fargo | Maintain | Equal Weight | 2025-12-04 |
| Evercore ISI Group | Maintain | In Line | 2025-12-04 |
UiPath’s grades mostly range between “Neutral,” “Equal Weight,” and “Sector Perform,” with a single “Buy” rating. The trend indicates a generally cautious stance by analysts.
Veritone, Inc. Grades
The following table shows recent grades given to Veritone, Inc. by recognized grading companies:
| Grading Company | Action | New Grade | Date |
|---|---|---|---|
| D. Boral Capital | Maintain | Buy | 2025-12-09 |
| D. Boral Capital | Maintain | Buy | 2025-12-04 |
| Needham | Maintain | Buy | 2025-12-02 |
| D. Boral Capital | Maintain | Buy | 2025-12-02 |
| D. Boral Capital | Maintain | Buy | 2025-11-07 |
| D. Boral Capital | Maintain | Buy | 2025-10-28 |
| HC Wainwright & Co. | Maintain | Buy | 2025-10-20 |
| D. Boral Capital | Maintain | Buy | 2025-10-15 |
| D. Boral Capital | Maintain | Buy | 2025-09-24 |
| D. Boral Capital | Maintain | Buy | 2025-09-09 |
Veritone’s grades are consistently “Buy” from multiple analysts, reflecting a strong positive consensus.
Which company has the best grades?
Veritone, Inc. has received consistently stronger grades than UiPath Inc., with all recent ratings being “Buy” compared to UiPath’s mix of “Hold,” “Neutral,” and only one “Buy.” For investors, this could imply differing market sentiment and risk profiles between the two companies.
Strengths and Weaknesses
The table below summarizes key strengths and weaknesses of UiPath Inc. (PATH) and Veritone, Inc. (VERI) based on their recent financial performance, market presence, and innovation capabilities.
| Criterion | UiPath Inc. (PATH) | Veritone, Inc. (VERI) |
|---|---|---|
| Diversification | Strong revenue mix: 58% subscription, 34% license, 8% services | Less diversified: software products and managed services dominate |
| Profitability | Negative net margin (-5.15%), improving ROIC but still value-destroying | Significantly negative net margin (-40.36%), declining ROIC, value destroying |
| Innovation | Growing ROIC trend indicates improving operational efficiency | Declining ROIC trend reflects challenges in innovation and execution |
| Global presence | Established global footprint with growing subscription base | More limited global scale, focused on AI and managed services markets |
| Market Share | Leading in robotic process automation (RPA) sector | Niche player in AI-driven media and advertising technology |
Key takeaways: UiPath shows promise with an improving profitability trend and strong subscription growth despite current losses. Veritone faces significant profitability challenges with declining returns and less diversification, indicating higher risk for investors.
Risk Analysis
Below is a comparative table of key risks for UiPath Inc. (PATH) and Veritone, Inc. (VERI) based on the most recent data available in 2026:
| Metric | UiPath Inc. (PATH) | Veritone, Inc. (VERI) |
|---|---|---|
| Market Risk | Beta 1.08 – Moderate volatility | Beta 2.05 – High volatility |
| Debt Level | Low – Debt/Equity 0.04, Debt to Assets 2.7% | High – Debt/Equity 8.91, Debt to Assets 60.5% |
| Regulatory Risk | Moderate – operates in US, Romania, Japan with exposure to tech regulations | Moderate to High – US and UK markets, AI regulatory scrutiny rising |
| Operational Risk | Moderate – scaling automation solutions globally | High – smaller scale, fewer employees, AI platform complexity |
| Environmental Risk | Low – software company, limited direct environmental impact | Low – software, but energy-intensive AI computing possible |
| Geopolitical Risk | Moderate – exposure to multiple international markets | Moderate – US/UK focused with potential trade policy impact |
The most impactful risks differ: Veritone faces significant financial and operational risks due to high leverage and weak profitability indicators, while UiPath’s risks lie mainly in market volatility and operational scaling challenges. Veritone’s Altman Z-Score indicates distress, raising bankruptcy concerns, whereas UiPath is in a safe zone. Investors should be cautious with Veritone’s high debt and volatile earnings.
Which Stock to Choose?
UiPath Inc. (PATH) shows favorable income evolution with 9.3% revenue growth in 2025 and a strong gross margin of 82.73%. However, profitability ratios remain unfavorable, including a -5.15% net margin and negative returns on equity and invested capital. The company has low debt levels and a robust current ratio of 2.93, with a moderate overall rating of B+ and a slightly unfavorable moat due to value destruction despite growing ROIC.
Veritone, Inc. (VERI) displays mixed income trends, with a 7.35% revenue decline in 2024 but positive net income growth overall. Profitability ratios are highly unfavorable, including a -40.36% net margin and very weak returns on equity and capital. VERI carries significant debt with a debt-to-equity ratio of 8.91 and a current ratio below 1. Its overall rating is C with a very unfavorable moat, reflecting declining ROIC and value destruction.
Considering ratings and financial evaluations, PATH’s stronger income growth and more balanced financial ratios might appeal to investors seeking improving profitability and stronger balance sheet metrics. Conversely, VERI’s volatile income and weaker financial health could be seen as higher risk, possibly suiting investors with higher risk tolerance aiming for turnaround potential. Each stock’s suitability could depend on the investor’s risk profile and strategy focus.
Disclaimer: Investment carries a risk of loss of initial capital. The past performance is not a reliable indicator of future results. Be sure to understand risks before making an investment decision.
Go Further
I encourage you to read the complete analyses of UiPath Inc. and Veritone, Inc. to enhance your investment decisions: