VeriSign, Inc. and UiPath Inc. are two prominent players in the software infrastructure sector, each shaping the digital landscape through distinct but complementary innovations. VeriSign secures and stabilizes internet navigation with domain registry services, while UiPath leads in robotic process automation, enhancing business efficiency. Both companies target technology-driven growth, making their comparison crucial for investors seeking promising opportunities. Let’s explore which one stands out as the smarter investment choice in 2026.
Table of contents
Companies Overview
I will begin the comparison between VeriSign and UiPath by providing an overview of these two companies and their main differences.
VeriSign Overview
VeriSign, Inc. focuses on domain name registry services and internet infrastructure, ensuring security, stability, and resiliency for recognized domain names worldwide. It operates key internet root servers and manages authoritative resolution for major domains like .com and .net, supporting global e-commerce. With 929 employees, VeriSign plays a critical role in internet navigation and infrastructure maintenance from its base in Reston, Virginia.
UiPath Overview
UiPath Inc. delivers an end-to-end robotic process automation (RPA) platform that integrates AI and low-code development environments to automate business processes. Its software suite enables users to build, manage, and analyze automations across various sectors, including banking and healthcare. Headquartered in New York City, UiPath employs 3,868 people and emphasizes enterprise-grade automation solutions combining attended and unattended robotic deployments.
Key similarities and differences
Both companies operate within the software infrastructure industry, emphasizing technology solutions that enhance operational efficiency. VeriSign focuses on internet infrastructure and domain registry services, underpinning global internet functionality, while UiPath concentrates on automation software to optimize business workflows. VeriSign’s market cap is significantly larger at 23B compared to UiPath’s 7.7B, reflecting their distinct market roles and scale.
Income Statement Comparison
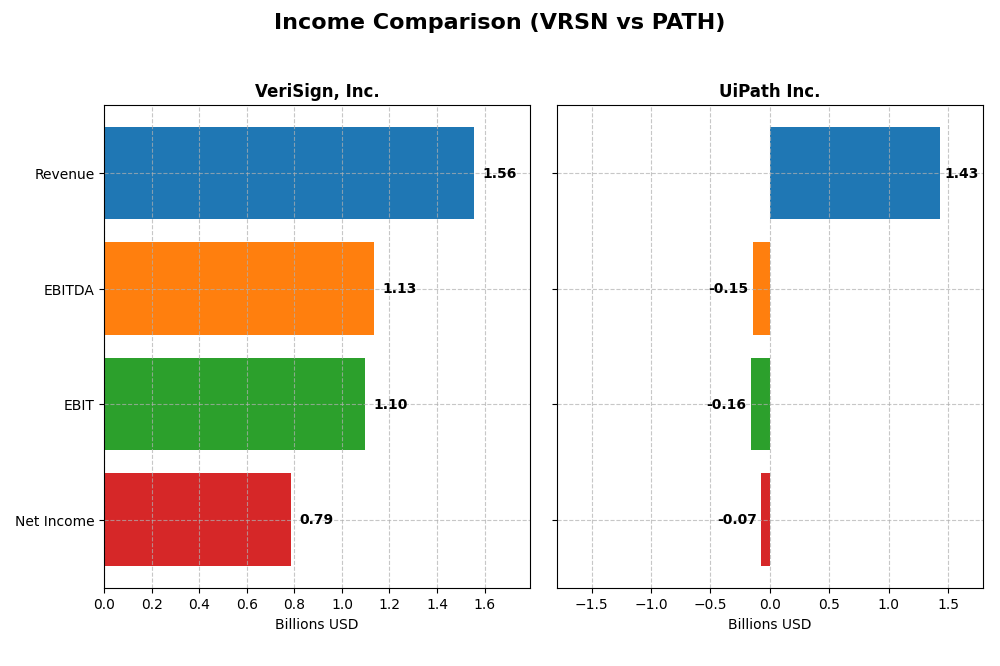
The table below compares key income statement metrics for VeriSign, Inc. and UiPath Inc. based on their most recent fiscal year data.
| Metric | VeriSign, Inc. (VRSN) | UiPath Inc. (PATH) |
|---|---|---|
| Market Cap | 23.1B | 7.7B |
| Revenue | 1.56B | 1.43B |
| EBITDA | 1.13B | -145M |
| EBIT | 1.10B | -163M |
| Net Income | 786M | -74M |
| EPS | 8.01 | -0.13 |
| Fiscal Year | 2024 | 2025 |
Income Statement Interpretations
VeriSign, Inc.
VeriSign’s revenue steadily grew over 2020-2024, reaching $1.56B in 2024, a 4.31% increase from 2023. Net income showed some volatility, declining 3.58% overall and falling to $786M in 2024. Margins remain strong, with a high gross margin around 87.7% and net margin near 50%. The latest year saw margin contraction despite stable revenue growth.
UiPath Inc.
UiPath’s revenue expanded rapidly from $608M in 2021 to $1.43B in 2025, marking a 9.3% increase in the last year alone. Net income improved significantly, turning less negative to -$74M in 2025 from -$90M in 2024. Although still unprofitable, UiPath’s gross margin is favorable at 82.7%, and its net margin and EBIT margin have improved recently, reflecting operational progress.
Which one has the stronger fundamentals?
VeriSign exhibits solid profitability with consistently high margins and positive net income, though recent net margin declined. UiPath shows robust revenue and net income growth, narrowing losses and improving margins, but remains unprofitable. VeriSign’s stable earnings contrast with UiPath’s growth trajectory, highlighting a trade-off between profitability and expansion in fundamentals.
Financial Ratios Comparison
The table below presents key financial ratios for VeriSign, Inc. (VRSN) and UiPath Inc. (PATH) based on their most recent fiscal year data, offering a clear comparison of profitability, liquidity, valuation, leverage, and operational efficiency.
| Ratios | VeriSign, Inc. (2024) | UiPath Inc. (2025) |
|---|---|---|
| ROE | -40.1% | -4.0% |
| ROIC | 4.51% | -7.41% |
| P/E | 25.8 | -108.0 |
| P/B | -10.4 | 4.31 |
| Current Ratio | 0.43 | 2.93 |
| Quick Ratio | 0.43 | 2.93 |
| D/E (Debt-to-Equity) | -0.92 | 0.04 |
| Debt-to-Assets | 128.1% | 2.7% |
| Interest Coverage | 14.1 | 0 |
| Asset Turnover | 1.11 | 0.50 |
| Fixed Asset Turnover | 6.66 | 14.41 |
| Payout Ratio | 0 | 0 |
| Dividend Yield | 0% | 0% |
Interpretation of the Ratios
VeriSign, Inc.
VeriSign shows a mixed financial profile with favorable net margin at 50.45% and strong returns on invested capital (451.0%) but a concerning negative return on equity (-40.13%) and low liquidity ratios (current and quick at 0.43). Debt levels are high relative to assets (128.08%), although interest coverage remains healthy. VeriSign pays dividends with consistent yield but no recent growth, suggesting stable but cautious shareholder returns.
UiPath Inc.
UiPath’s ratios highlight challenges, including negative net margin (-5.15%), returns (ROE -3.99%, ROIC -7.41%), and zero interest coverage, indicating operational losses and financial strain. Liquidity is strong with current and quick ratios near 3.0. The company does not pay dividends, reflecting its reinvestment strategy during a high-growth phase, prioritizing R&D and business expansion over shareholder payouts.
Which one has the best ratios?
VeriSign’s ratios are generally more favorable, with strong profitability and cash flow metrics despite some liquidity and leverage concerns. UiPath faces more unfavorable ratios, reflecting operational losses and financial stress, though it maintains strong liquidity. Overall, VeriSign’s profile appears stronger, though both companies have notable risks to monitor.
Strategic Positioning
This section compares the strategic positioning of VeriSign and UiPath, including market position, key segments, and exposure to technological disruption:
VeriSign, Inc.
- Dominant domain registry operator for .com and .net with stable competitive pressure.
- Focuses on domain name registry, internet infrastructure, and security services.
- Operates critical root servers, supporting internet stability, with moderate exposure to tech disruption.
UiPath Inc.
- Automation platform provider facing competitive pressure in RPA and AI-enhanced software markets.
- Generates revenue mainly from licenses, subscriptions, and professional services in automation software.
- Combines AI and automation tech, subject to rapid innovation and evolving technological disruption.
VeriSign vs UiPath Positioning
VeriSign has a concentrated strategic focus on internet infrastructure and domain registry, offering stability but limited diversification. UiPath pursues a diversified automation platform strategy, driving growth but facing intense technological and market shifts.
Which has the best competitive advantage?
VeriSign demonstrates a very favorable moat with strong value creation and growing ROIC, indicating a durable competitive advantage. UiPath shows slightly unfavorable moat metrics, shedding value despite improving profitability.
Stock Comparison
The stock price movements of VeriSign, Inc. (VRSN) and UiPath Inc. (PATH) over the past 12 months reveal contrasting dynamics, with VRSN showing a strong upward trend while PATH experiences a notable decline, reflecting divergent market sentiment and trading activity.
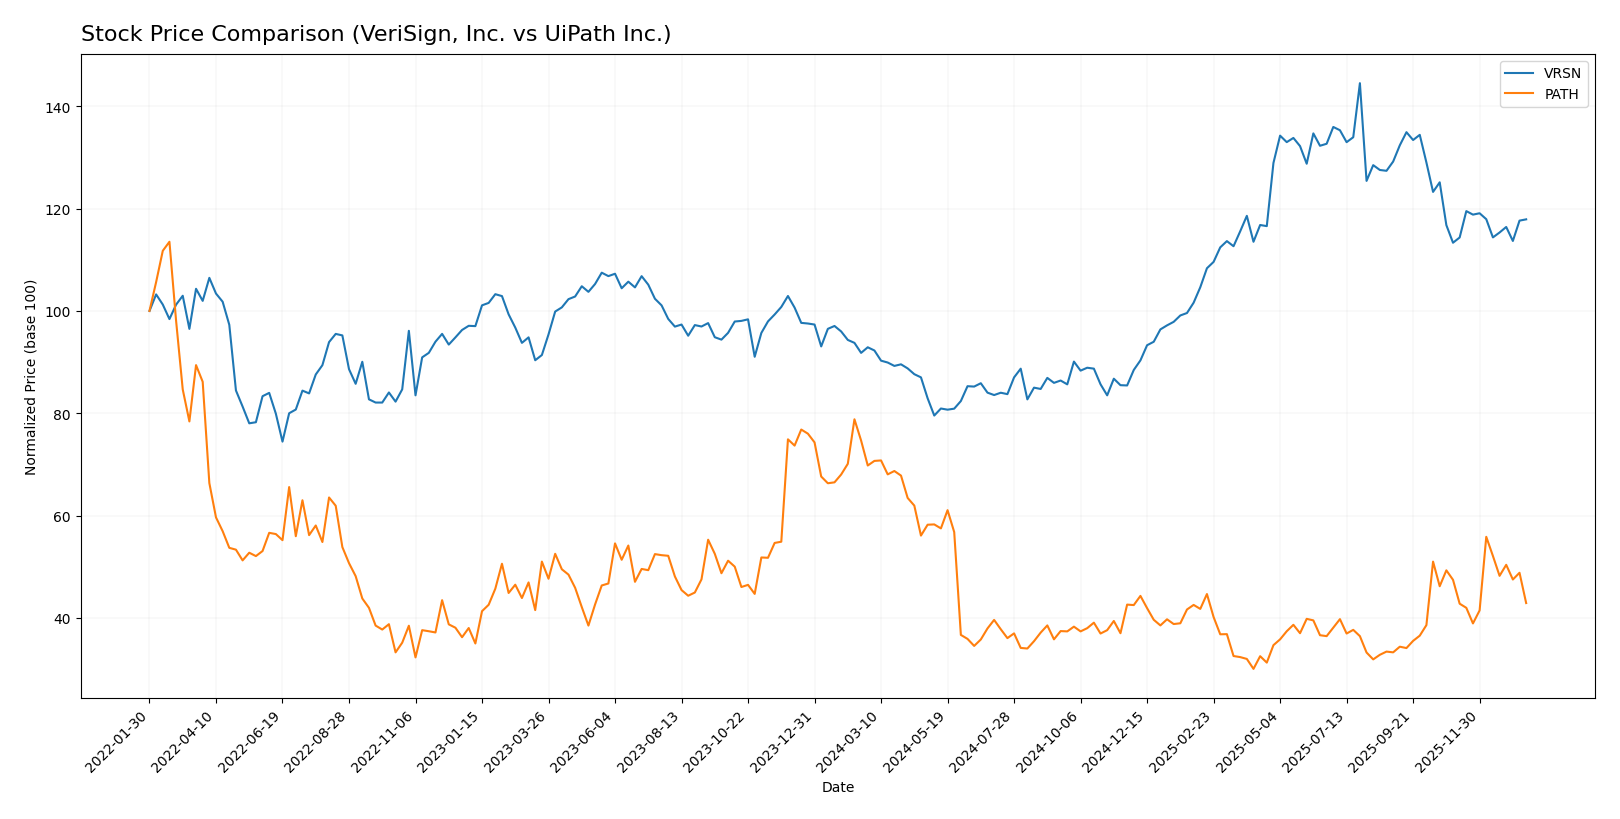
Trend Analysis
VeriSign, Inc. exhibits a bullish trend with a 26.92% price increase over the past 12 months, though this growth is decelerating. The stock shows significant volatility with a standard deviation of 40.88 and a high at 305.79.
UiPath Inc. has a bearish trend, declining 38.53% over the last year with accelerating downward momentum. The stock experiences lower volatility, evidenced by a 3.33 standard deviation and a low point at 10.04.
Comparing both, VeriSign’s stock delivered the highest market performance with a strong positive return, while UiPath’s stock showed a substantial decrease, indicating divergent investor confidence.
Target Prices
Here is the current consensus on target prices for VeriSign, Inc. and UiPath Inc. based on verified analyst data.
| Company | Target High | Target Low | Consensus |
|---|---|---|---|
| VeriSign, Inc. | 325 | 325 | 325 |
| UiPath Inc. | 19 | 14 | 16.6 |
Analysts expect VeriSign’s stock to reach 325, significantly above its current price of 249.47 USD. UiPath’s consensus target of 16.6 USD suggests moderate upside from the current 14.34 USD share price.
Analyst Opinions Comparison
This section compares analysts’ ratings and financial grades for VeriSign, Inc. and UiPath Inc.:
Rating Comparison
VeriSign, Inc. Rating
- Rating: B-, considered very favorable overall.
- Discounted Cash Flow Score: 4, favorable valuation outlook.
- ROE Score: 1, very unfavorable efficiency in equity usage.
- ROA Score: 5, very favorable asset utilization.
- Debt To Equity Score: 1, very unfavorable balance sheet risk.
- Overall Score: 2, moderate overall financial standing.
UiPath Inc. Rating
- Rating: B+, considered very favorable overall.
- Discounted Cash Flow Score: 3, moderate valuation.
- ROE Score: 4, favorable equity profitability.
- ROA Score: 4, favorable asset utilization.
- Debt To Equity Score: 4, favorable financial stability.
- Overall Score: 3, moderate overall financial standing.
Which one is the best rated?
UiPath Inc. holds a higher rating (B+) compared to VeriSign’s B-, with stronger scores in return on equity, return on assets, and debt-to-equity, indicating better financial efficiency and stability based on the provided data.
Scores Comparison
Here is a comparison of the financial health scores for VeriSign, Inc. and UiPath Inc.:
VRSN Scores
- Altman Z-Score: -4.67 indicating financial distress and high bankruptcy risk.
- Piotroski Score: 8, reflecting very strong financial health and value.
PATH Scores
- Altman Z-Score: 5.27 indicating a safe zone with low bankruptcy risk.
- Piotroski Score: 7, indicating strong financial health and value.
Which company has the best scores?
UiPath shows a significantly better Altman Z-Score, placing it in the safe zone, while VeriSign is in distress. VeriSign, however, has a slightly higher Piotroski Score, indicating very strong financial health compared to UiPath’s strong score.
Grades Comparison
Here is a comparison of the recent grades and ratings assigned to VeriSign, Inc. and UiPath Inc.:
VeriSign, Inc. Grades
The following table summarizes recent grades from reputable financial institutions for VeriSign, Inc.:
| Grading Company | Action | New Grade | Date |
|---|---|---|---|
| JP Morgan | Maintain | Neutral | 2026-01-06 |
| Baird | Maintain | Outperform | 2025-07-01 |
| Baird | Maintain | Outperform | 2025-04-25 |
| Baird | Maintain | Outperform | 2025-04-01 |
| Citigroup | Maintain | Buy | 2025-02-04 |
| Citigroup | Maintain | Buy | 2025-01-03 |
| Baird | Upgrade | Outperform | 2024-12-09 |
| Baird | Maintain | Neutral | 2024-06-27 |
| Baird | Maintain | Neutral | 2024-04-26 |
| Citigroup | Maintain | Buy | 2024-04-02 |
VeriSign’s grades show a consistent trend towards Outperform and Buy ratings from respected firms, indicating positive analyst sentiment.
UiPath Inc. Grades
The following table presents recent grades from credible grading companies for UiPath Inc.:
| Grading Company | Action | New Grade | Date |
|---|---|---|---|
| Barclays | Maintain | Equal Weight | 2026-01-12 |
| RBC Capital | Maintain | Sector Perform | 2026-01-05 |
| RBC Capital | Maintain | Sector Perform | 2025-12-10 |
| Morgan Stanley | Maintain | Equal Weight | 2025-12-09 |
| DA Davidson | Maintain | Neutral | 2025-12-05 |
| Canaccord Genuity | Maintain | Buy | 2025-12-04 |
| Mizuho | Maintain | Neutral | 2025-12-04 |
| RBC Capital | Maintain | Sector Perform | 2025-12-04 |
| Wells Fargo | Maintain | Equal Weight | 2025-12-04 |
| Evercore ISI Group | Maintain | In Line | 2025-12-04 |
UiPath’s grades are mostly in the neutral to sector perform range, with a single Buy rating, showing a more cautious analyst outlook compared to VeriSign.
Which company has the best grades?
VeriSign has received more favorable grades overall, with multiple Outperform and Buy ratings, whereas UiPath predominantly shows Hold and Neutral ratings. This suggests VeriSign is viewed more optimistically by analysts, potentially impacting investor sentiment towards higher confidence in VeriSign’s near-term prospects.
Strengths and Weaknesses
Below is a comparison table summarizing the key strengths and weaknesses of VeriSign, Inc. (VRSN) and UiPath Inc. (PATH) based on their recent financial and operational data.
| Criterion | VeriSign, Inc. (VRSN) | UiPath Inc. (PATH) |
|---|---|---|
| Diversification | Limited product segmentation, focused on domain name services | More diversified revenue streams: License (587M), Subscription (802M), Professional Services (71M) |
| Profitability | High net margin (50.45%), strong ROIC (451%), but negative ROE (-40.13%) | Negative net margin (-5.15%), negative ROIC (-7.41%), slight improvement trend |
| Innovation | Durable competitive advantage with growing ROIC and very favorable moat | Growing ROIC but still value-destructive; innovation ongoing but not yet profitable |
| Global presence | Strong, established global footprint in internet infrastructure | Growing global presence as an automation software provider but less dominant |
| Market Share | Leading position in domain name services with high asset turnover (6.66) | Smaller market share, improving turnover but still under pressure (asset turnover 0.5) |
Key takeaways: VeriSign demonstrates strong profitability and a durable competitive moat but has limited diversification. UiPath shows promising growth and diversification but continues to face profitability challenges and a slightly unfavorable moat position. Investors should weigh VeriSign’s stability against UiPath’s growth potential and risks.
Risk Analysis
Below is a comparative table highlighting key risks for VeriSign, Inc. (VRSN) and UiPath Inc. (PATH) based on the most recent data available from 2025-2026.
| Metric | VeriSign, Inc. (VRSN) | UiPath Inc. (PATH) |
|---|---|---|
| Market Risk | Moderate (Beta 0.77, stable sectors) | Higher (Beta 1.08, volatile growth sector) |
| Debt level | Unfavorable (High debt to assets 128%) | Low (Debt to assets 2.7%) |
| Regulatory Risk | Moderate (Internet infrastructure regulations) | Moderate (Software compliance and data privacy) |
| Operational Risk | Low (Strong infrastructure with 929 employees) | Moderate (Complex RPA platform, 3,868 employees) |
| Environmental Risk | Low (Digital infrastructure focused) | Low (Software-based, limited physical footprint) |
| Geopolitical Risk | Moderate (US-based with global domain influence) | Moderate (Global operations with US, Romania, Japan exposure) |
VeriSign’s most impactful risk lies in its high debt relative to assets, posing financial strain despite strong operational margins. UiPath faces higher market volatility and operational complexity but benefits from a low debt level, reducing financial risk. Regulatory and geopolitical risks affect both due to their global tech presence.
Which Stock to Choose?
VeriSign, Inc. (VRSN) shows a stable income evolution with a 4.31% revenue growth last year and a favorable gross margin of 87.71%. Its financial ratios are mostly favorable, including a strong ROIC of 451% and a low net debt to EBITDA ratio of 1.41, despite some unfavorable metrics like a negative ROE of -40.13%. The company maintains a very favorable moat rating and a B- overall rating.
UiPath Inc. (PATH) demonstrates a strong income growth with 9.3% revenue increase last year and a favorable gross margin of 82.73%, but it reports negative net and EBIT margins. Its financial ratios are mixed with favorable liquidity and debt measures but unfavorable profitability ratios and a slightly unfavorable moat rating. PATH holds a B+ overall rating with a safe zone Altman Z-Score.
Considering rating and financial evaluation, VRSN could appeal to investors prioritizing quality and durability, given its strong moat and value creation. PATH may appear more suitable for growth-oriented investors willing to tolerate short-term profitability challenges while benefiting from its improving income trends and financial stability.
Disclaimer: Investment carries a risk of loss of initial capital. The past performance is not a reliable indicator of future results. Be sure to understand risks before making an investment decision.
Go Further
I encourage you to read the complete analyses of VeriSign, Inc. and UiPath Inc. to enhance your investment decisions: